![Causes of flooding ,[object Object],Nashua River](data:image/gif;base64,R0lGODlhAQABAIAAAAAAAP///yH5BAEAAAAALAAAAAABAAEAAAIBRAA7)
Recommandé
Recommandé
Contenu connexe
Similaire à Nashua River Flooding
Similaire à Nashua River Flooding (20)
Nashua River Flooding
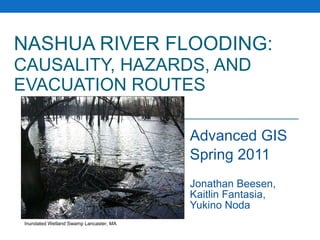
- 1. NASHUA RIVER FLOODING: CAUSALITY, HAZARDS, AND EVACUATION ROUTES Advanced GIS Spring 2011 Jonathan Beesen, Kaitlin Fantasia, Yukino Noda Inundated Wetland Swamp Lancaster, MA
- 6. Making of Impervious Surfaces and Shaded Relief Map Shaded Relief Major Hydrography Impervious Surfaces
- 7. Impervious Surfaces and Shaded Relief of Study Area IMPERVIOUS SURFACES AND SHADED RELIEF OF STUDY AREA WITHIN NORTHERN CLINTON AND SOUTHERN LANCASTER, MASSACHUSETTS Framingham State University, Framingham, Massachusetts Drafted By: Kaitlin Fantasia Date: May 5, 2011 Source: MassGIS http://www.mass.gov/mgis/ Proj: NAD83 SP FIPS 2001
- 8. Making of Shoreline Change Map USGS Color Ortho Imagery FEMA Q3 Flood Zones Collected Trimble Data from site
- 9. Trimble Data: Nashua River Shoreline Changes NASHUA RIVER SHORELINE CHANGES IN NORTHERN CLINTON AND SOUTHERN LANCASTER, MASSACHUSETTS Framingham State University, Framingham, Massachusetts Drafted By: Jonathan Beesen and Kaitlin Fantasia Date: May 5, 2011 Source: MassGIS http://www.mass.gov/mgis/ Proj: NAD83 SP FIPS 2001
- 10. FEMA Flood Zone Descriptions Orange Blue X500 Zone X (500-year) An area inundated by 500-year flooding; an area inundated by 100-year flooding with average depths of less than 1 foot or with drainage areas less than 1 square mile; or an area protected by levees from 100-year flooding. AE Zone AE An area inundated by 100-year flooding, for which BFEs have been determined.
- 11. List of Data layers File Type Name Last Modified Raster Data Impervious Surface February 2007 Shaded Relief February 2005 USGS Color Ortho Imagery April 2005 Vector Data Polygon Community Boundaries (Towns) September 2009 Polygon FEMA Q3 Flood July 1997 Line/ Polygon Major Hydrography March 2010 Line Collected Trimble Data (Shorelines) May 2011 Point Collected Trimble Data (Trees) May 2011
- 13. INDEX MAP Hazard Sites in Flood Zones FLOODING HAZARD AREAS: TIER CLASSIFIED DEP 21E SITES Framingham State University, Framingham, Massachusetts Drafted By: Jonathan Beesen Date: May 5, 2011 Source: MassGIS http://www.mass.gov/mgis/ Proj: NAD83 SP FIPS 2001
- 14. Mass DEP 21E Site Classification
- 16. FLOOD EVACUATION MAP OF NORTHERN CLINTON AND SOUTHERN LANCASTER, MASSACHUSETTS Yukino Noda
- 18. Northern Clinton and southern Lancaster (9.4 square miles) Schools Study Area
- 19. Impervious Land Surface Image of the Study Area Potential Flooding Area
- 20. A B C D E F G H Zones Assigned to Each Evacuation Sites MassDOT Road
- 21. Potential Impassable Roads Potential Impassable Roads and Area Potentially Blocked by Impassable Roads Area Potentially Blocked by Impassable Roads Potential Flooding Area
- 24. The List of Data layers File Type Name Last Modified Raster Data Impervious Surface February 2007 USGS Topographic Quadrangle Images June 2001 Vector Data Point Acute Care Hospitals August 2009 Point Colleges and Universities July 2007 Polygon Community Boundaries (Towns) September 2009 Point Community Health Centers August 2007 Polygon FEMA Q3 Flood July 1997 Point Fire Stations February 2007 Polygon Land Use (2005) June 2009 Line Major Ponds and Major Streams July 1998 Line Massachusetts Department of Transportation (MassDOT) Roads October 2009 Point Police Stations February 2007 Point Schools November 2010 Point Town Halls February 2007
- 25. Thank you for paying attention. Are there any questions or comments? Beaver Dam within wetland swamp