Call Girls in Delhi Triveni Complex Escort Service(🔝))/WhatsApp 97111⇛47426
Anthro and bmi
1. NUTRITIONAL ASSESSMENT
BY
USING ANTHROPOMETRY AND BMI
Md. Moksed Ali Pramanik
Principal Research Associate
INFS University of Dhaka
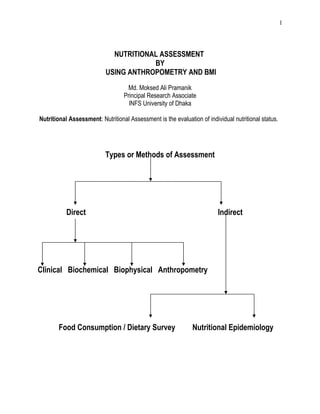
Nutritional Assessment: Nutritional Assessment is the evaluation of individual nutritional status.
Types or Methods of Assessment
Direct Indirect
Clinical Biochemical Biophysical Anthropometry
Food Consumption / Dietary Survey Nutritional Epidemiology
1
2. Anthropometric Assessment:
For Anthropometric Assessment, information is needed on each individual’s sex, age, weight,
height, Mid Upper Arm Circumference etc.
Anthropometric Data Analysis:
The anthropometric data were calculated and analyzed as standard deviation scores (Z-scores) of
NCHS (The US National Center for Health Statistics) reference height-for-age, weight-for-age and
weight-for-height and as percentage of reference median of these indicators. The Anthro software
package and Epi Info were used in this regard.
Z-score (Standard Score): Z-score is simple a position score in terms of standard vdeviation with
reference to the mean.
Individual’s value ─ Mean value x = ∑ x I ÷ n
Z score = ------------------------------------------------------------------ SD = ∑ √ ( xi ―x)2
÷ (n ― 1)
Standard deviation = √ 1 [ ∑ xi
2
―(∑xi)2
]
There are three categories of z-score for Anthropometric Data Analysis. They are as follows
• HAZ (Height for age z-score) – Measures Stunting
Low HA is considered an indicator of stunting (i.e. shortness) which is frequently associated
with poor overall economic condition and/or repeated exposure to adverse condition. (past
chronic under nutrition)
• WAZ (Weight for age z-score) – Measures Underweight
WA is primarily a composite of WH and HA, and fails to distinguish tall, thin. Children from
short, well proportioned children (stunting wasting / current acute and chronic under
nutrition).
• WHZ (Weight for height z-score) – Measures Wasting
Low WH is considered an indicator of wasting (i.e. thinness) and is associated with failure
to gain weight or a loss of weight.
2
4. Weight for-age percent of median (WAM) (PEM or Gomez Classification):
Percent Expected
weight for age
Classification Category of
Nutritional status
Weight for-age percent of
median (WAM) > 90 %
Normal Normal
Weight for-age percent of
median (WAM) 76-90 %
Mild malnutrition 1st
degree
malnutrition
Weight for-age percent of
median (WAM) 61-75 %
Moderate
malnutrition
2nd
degree
malnutrition
Weight for-age percent of
median (WAM) ≤ 60 %
Severe
malnutrition
3rd
degree
malnutrition
Wellcome Classification
Percent Expected
weight for age
Edema present Edema absent
WAM 60-80 % Kwashiorkor Underweight
WAM < 60 % Marasmic-Kwashiorkor Marasmus
In Waterlow classification children are categorized into four groups on the basis of percentage
deviation from the reference median height-for-age and weight-for-height. The following cut-off
points were used to categories normal, stunted, wasted and stunted & wasted:
Normal : Height-for-age ≥ 90 % of reference median
Weight-for-height ≥ 80 % of reference median
Stunted : Height-for-age < 90 % of reference median
Weight-for-height ≥ 80 % of reference median
Wasted : Height-for-age ≥ 90 % of reference median
Weight-for-height < 80 % of reference median
Stunted : Height-for-age < 90 % of reference median
and wasted Weight-for-height < 80 % of reference median
4
5. Degree of Stunting
Height for age percent of median (HAM) Category of nutritional status
HAM > 95% Grade ‘0’ or normal
HAM 90 – 95% Grade 1 stunting
HAM 85 – 89.99% Grade 2 stunting
HAM < 85% Grade 3 stunting
WAM = (hs ÷ hp) × 100
Where hs = height of the sample
hp = height of the reference population.
Equivalents of percentile and Z-score in normal distribution
Below Mean Above Mean
percentile Z-score percentile Z-score
0.0 to 4.9 - 3.090 to – 1.650 50.0 to 54.9 0.000 to 0.120
5.0 to 9.9 - 1.645 to – 1.290 55.0 to 59.9 0.126 to 0.250
10.0 to 14.9 - 1.282 to – 1.040 60.0 to 64.9 0.253 to 0.380
15.0 to 19.9 - 1.036 to – 0.850 65.0 to 69.9 0.3855 to 0.520
20.0 to 24.9 - 0.842 to – 0.680 70.0 to 74.9 0.524 to 0.670
25.0 to 29.9 - 0.675 to – 0.530 75.0 to 79.9 0.675 to 0.840
30.0 to 34.9 - 0.524 to – 0.390 80.0 to 84.9 0.842 to 1.030
35.0 to 39.9 - 0.385 to – 0.260 85.0 to 89.9 1.036 to 1.280
40.0 to 44.9 - 0.253 to – 0.130 90.0 to 94.9 1.282 to 1.640
45.0 to 50.0 - 0.126 to – 0.000 95.0 to 99.9 1.645 to 3.090
Anthropometric classification for the evaluation of growth
and nutritional status
Category Percentile Z –score Growth
status
Weight
status
Muscle status
Category I 0.0 to 5.0 Z<-1.650 Short Low
Weight
Low Muscle
Wasted
Category II 5.1 to 15.0 -1.645<Z
<-1.040
Below
Average
Below
Average
Below Average
Category III 15.1 to 85.0 -1.036<Z
<+1.030
Average Average Average
Category IV 85.1 to 95.0 +1.036<Z
<+1.640
Above
Average
Above
Average
Above Average
Category V 95.1 to 100.0 Z>+1.645 Tall Heavy
Weight
High muscle:
Good Nutrition
5
12. Weight in kg.
BMI = -----------------------------
(Height in metre)2
The following cut-off points were used to categories the nutrition status by BMI:
Grade 3 Chronic energy deficiency (CED) ( Severely thinness) :BMI < 16
Grade 2 Chronic energy deficiency (CED) (Moderate thinness) :BMI 16-16.99
Grade 1 Chronic energy deficiency (CED) :17- 18.49 (Mild thinness)
BMI 18.5-24.99 : Normal
Grade 1 Over weight :BMI 25-29.99
Grade 2 Overweight :BMI 30.00-39.99
Grade 3 Over weight :BMI ≥40
(Source: WHO 1995)
Three category of BMI
Body Mass Index were usually classified into three categories. The following cut-off points were
used to categories chronic energy deficiency (CED), normal and obese:
CED = BMI < 18.5
Normal = BMI 18.5-24.99
Obese = BMI equal or greater than 25
Classification of malnutrition in children aged 1-5 years by
Mid Upper Arm Circumference (MUAC)
Circumference (cm) Level of nutrition
MUAC > 14 Normal
MUAC 12.5 – 14.0 Mild / moderate malnutrition
MUAC < 12.5 Severe malnutrition
For Bangladeshi children 11 cm. is the cut-off point.
Classification of adult malnutrition by MUAC
Sex Circumference (cm) Level of nutrition
Male MUAC ≥ 23
MUAC < 23
Normal
Malnourished
Female MUAC ≥ 22
MUAC < 22
Normal
Malnourished
12

![Anthropometric Assessment:
For Anthropometric Assessment, information is needed on each individual’s sex, age, weight,
height, Mid Upper Arm Circumference etc.
Anthropometric Data Analysis:
The anthropometric data were calculated and analyzed as standard deviation scores (Z-scores) of
NCHS (The US National Center for Health Statistics) reference height-for-age, weight-for-age and
weight-for-height and as percentage of reference median of these indicators. The Anthro software
package and Epi Info were used in this regard.
Z-score (Standard Score): Z-score is simple a position score in terms of standard vdeviation with
reference to the mean.
Individual’s value ─ Mean value x = ∑ x I ÷ n
Z score = ------------------------------------------------------------------ SD = ∑ √ ( xi ―x)2
÷ (n ― 1)
Standard deviation = √ 1 [ ∑ xi
2
―(∑xi)2
]
There are three categories of z-score for Anthropometric Data Analysis. They are as follows
• HAZ (Height for age z-score) – Measures Stunting
Low HA is considered an indicator of stunting (i.e. shortness) which is frequently associated
with poor overall economic condition and/or repeated exposure to adverse condition. (past
chronic under nutrition)
• WAZ (Weight for age z-score) – Measures Underweight
WA is primarily a composite of WH and HA, and fails to distinguish tall, thin. Children from
short, well proportioned children (stunting wasting / current acute and chronic under
nutrition).
• WHZ (Weight for height z-score) – Measures Wasting
Low WH is considered an indicator of wasting (i.e. thinness) and is associated with failure
to gain weight or a loss of weight.
2](data:image/gif;base64,R0lGODlhAQABAIAAAAAAAP///yH5BAEAAAAALAAAAAABAAEAAAIBRAA7)