iStudio Reporting Template
•Télécharger en tant que PPTX, PDF•
0 j'aime•553 vues

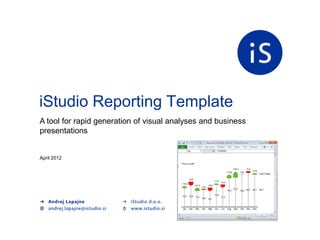
A tool for rapid generation of visual analyses and business presentations. Generate professional reports in plain Excel in just a a few clicks!

Recommandé
Recommandé
Contenu connexe
En vedette
En vedette (20)
iStudio Reporting Template
- 1. iStudio Reporting Template A tool for rapid generation of visual analyses and business presentations April 2012 Price in EUR +22,4 -5,2 +4,9 +13,9 -0,6 %ACT-BUD -16,5 +7,6 -14,0 +12,2 +21,3 -18,9 -4,8 21,2 20,1 20,1 ACT 19,3 19,2 13,9 12,3 12,5 11,3 11,3 10,0 9,2 Jan Feb Mar Apr Maj Jun Jul Avg Sep Okt Nov Dec
- 2. VISUAL ANALYSIS IN A FEW CLICKS
- 3. Step 1: Click on desired business analysis
- 4. Step 2: Copy & Paste your data
- 5. Step 3: Select business data categories Immediate result is generated automatically!
- 6. Step 4: Press the COPY button
- 7. Step 5: Paste to PowerPoint (or Word or Excel or …)
- 8. EXAMPLES OF VISUAL ANALYSES
- 9. Sales in mio € Profitability in % 21,2 19,3 19,2 15,3 15,1 13,9 12,5 12,5 9,3 9,3 9,2 13,5 13,2 8,9 8,3 8,3 12,3 6,0 8,6 9,2 8,5 8,0 7,2 5,4 5,6 5,7 5,5 4,7 4,3 3,9 Okt Nov Dec Jan Feb Mar Apr Maj Jun Jul Avg Sep Okt Nov Dec PY ACT BUD
- 10. Sales in mio € 21,2 19,3 19,2 15,3 15,1 13,9 12,5 12,5 9,3 8,3 9,3 8,3 9,2 8,9 6,0 Okt Nov Dec Jan Feb Mar Apr Maj Jun Jul Avg Sep Okt Nov Dec PY ACT BUD Price in EUR 14,7 15,5 12,3 10,5 11,2 9,2 7,1 8,0 6,2 6,3 6,9 4,7 5,0 5,2 5,6 Okt Nov Dec Jan Feb Mar Apr Maj Jun Jul Avg Sep Okt Nov Dec PY ACT BUD Profitability in % 13,5 13,2 12,3 8,6 9,2 8,5 8,0 7,2 5,4 5,6 5,7 5,5 4,7 4,3 3,9 Okt Nov Dec Jan Feb Mar Apr Maj Jun Jul Avg Sep Okt Nov Dec PY ACT BUD
- 11. Monthly ACT vs. BUD development Sales in Mio € +22,4 -5,2 +9,5 +13,9 -0,6 %ACT-BUD -16,5 +7,6 -14,0 +12,2 +21,3 -18,9 -4,8 21,2 20,1 21,0 ACT 19,3 19,2 12,3 12,5 13,9 11,3 10,0 11,3 9,2 Jan Feb Mar Apr Maj Jun Jul Avg Sep Okt Nov Dec Price in EUR -7,4 +16,3 +3,1 %ACT-BUD -7,4 -11,5 -6,5 +7,5 +1,0 -2,9 -9,9 +4,2 +1,0 10,5 11,2 ACT 9,2 8,0 6,3 6,9 7,1 5,6 6,2 4,7 5,0 5,2 Jan Feb Mar Apr Maj Jun Jul Avg Sep Okt Nov Dec
- 12. ACT vs. BUD comparison Sales in Mio € ACT %ACT-BUD Product 1 21,2 +22,4 Product 2 20,1 -5,2 Product 3 19,3 +13,9 Product 4 19,2 -0,6 Product 5 17,9 -6,6 Product 6 13,9 +7,6 Product 7 12,5 -16,5 Product 8 12,3 +10,9 Product 9 11,3 -14,0 Product 10 11,3 +21,3 Product 11 10,0 -4,8 Product 12 9,2 -18,9
- 13. Mfg comparison on the market Sales in Mio € 157,2 142,8 142,0 40,4 113,6 36,7 36,5 112,0 105,4 103,1 92,2 21,2 29,2 19,3 19,2 28,7 26,5 27,6 Others 69,2 23,7 68,0 21,2 61,7 61,3 15,3 19,3 19,2 15,1 13,9 12,9 Competitor 3 17,8 12,5 17,5 15,3 31,9 15,1 13,9 Competitor 2 15,8 17,0 13,9 28,9 28,8 9,3 12,5 9,2 9,3 8,3 9,0 9,2 20,9 23,0 22,7 21,2 Competitor 1 18,7 8,3 10,0 14,0 12,5 13,8 42,5 13,4 27,9 30,7 38,6 38,4 30,3 29,8 Danfoss 18,7 24,9 16,7 18,4 11,9 Jan Feb Mar Apr Maj Jun Jul Avg Sep Okt Nov Dec ACT FC BUD
- 14. Quarterly production development Production in Mio Unit +3,9 -1,5 +3,9 -1,5 -1,8 +2,4 +5,0 -1,8 +2,4 +1,2 -2,5 +2,0 23,9 21,0 18,1 12,3 PY ∆Q1 ∆Q2 ∆Q3 ∆Q4 ACT ∆Q1 ∆Q2 ∆Q3 ∆Q4 FC ∆Q1 ∆Q2 ∆Q3 ∆Q4 BUD
- 15. Product contribution analysis ACT vs. PY Sales in Mio EUR PY 32,3 Product 1 +6,6 Product 2 +6,1 Product 3 +5,0 Product 4 +3,9 Product 5 +3,9 Product 6 +2,4 Product 7 +2,4 Product 8 +2,0 Product 9 +1,2 Product 10 -2,5 Product 11 -3,5 Product 12 -4,8 Product 13 -5,8 Product 14 -8,5 ACT 40,6
- 16. Sales analysis: PY – ACT – BUD Sales in Mio € PY ACT - PY ACT ACT - BUD BUD Products abs % abs % Product 1 21,2 -3,9 -18,3 ● 17,3 -1,0 -5,8 18,3 Product 2 20,1 +1,1 +5,5 · 21,2 +1,0 +4,7 20,2 Product 3 19,3 -2,4 -12,2 • 16,9 +2,0 +11,8 • 14,9 Category1 60,7 -5,1 -8,5 55,5 +2,0 +3,6 53,5 Product 5 17,9 +1,3 +7,0 · 19,2 -3,0 -15,6 ● 22,2 Product 6 13,9 -1,0 -7,0 13,0 -1,0 -7,7 14,0 Product 7 12,5 +2,5 +19,8 ● 14,9 +3,0 +20,1 ● 11,9 Category2 44,3 +2,7 +6,2 · 47,1 -1,0 -2,1 48,1 Product 9 11,3 +1,8 +16,3 ● 13,2 +2,0 +15,2 ● 11,2 Product 10 11,3 -2,0 -17,6 ● 9,3 -1,0 -10,7 • 10,3 Product 11 10,0 +0,5 +5,0 · 10,5 +1,0 +9,6 · 9,5 Product 12 9,2 +2,1 +23,3 ● 11,3 +1,0 +8,8 · 10,3 Total 105,0 -2,4 -2,3 102,6 +1,0 +1,0 101,6
- 17. Previous 10 slides were produced in 15 minutes
- 18. PRODUCT FEATURES
- 19. Standard and easy to use • Standard Excel 2007 or 2010 • Extremely intuitive usage • Built-in reporting standards • Corporate color coding • Support for typical business cases • Users cannot build a „bad“ analysis
- 20. Support for typical business analyses Prodaja v k€ % Gross Margin Sales in Mio € 21,2 22,3 +22,4 -5,2 19,3 19,2 +4,9 +13,9 -0,6 12,5 %ACT-BUD 15,3 15,1 13,9 8,3 8,9 12,5 12,5 -16,5 2,0 +7,6 9,3 9,3 9,2 8,9 -14,0 8,3 8,3 +12,2 +21,3 -18,9 6,0 -4,8 21,2 20,1 20,1 ACT -2,4 19,3 19,2 -5,1 -9,9 13,9 12,3 12,5 11,3 11,3 Okt Nov Dec Jan Feb Mar Apr Maj Jun Jul Avg Sep Okt Nov Dec -15,3 -16,2 10,0 9,2 PY ACT BUD -21,3 -27,2 Jan Feb Mar Apr Maj Jun Jul Avg Sep Okt Nov Dec Jan Feb Mar Apr Maj Jun Jul Avg Sep Okt Nov Dec ACT BUD Sales in Mio € Sales in Mio € Sales in Mio € Postpaid Prepaid Orto Smart Niz5 Niz6 ACT %ACT-BUD 157,2 Product 1 21,2 +22,4 142,8 142,0 Customer 1 9,3 9,3 9,3 9,3 9,3 9,3 56,1 Product 2 20,1 -5,2 40,4 Customer 2 12,5 12,5 12,5 12,5 12,5 12,5 74,7 113,6 36,7 Product 3 19,3 +13,9 36,5 112,0 105,4 103,1 92,2 21,2 Customer 3 8,3 8,3 8,3 8,3 8,3 8,3 50,0 Product 4 19,2 -0,6 29,2 19,3 19,2 28,7 26,5 27,6 Others Customer 4 6,0 6,0 6,0 6,0 6,0 6,0 35,7 Product 5 17,9 -6,6 69,2 23,7 68,0 21,2 61,7 61,3 15,3 19,3 19,2 15,1 Product 6 13,9 12,9 Competitor 3 Customer 5 13,9 +7,6 17,8 12,5 15,3 15,1 9,2 9,2 9,2 9,2 9,2 9,2 55,2 15,8 17,5 13,9 31,9 13,9 Competitor 2 12,5 17,0 28,9 28,8 Product 7 12,5 -16,5 9,3 8,3 9,2 23,0 22,7 Customer 6 13,9 13,9 13,9 13,9 13,9 13,9 83,6 9,3 9,0 9,2 20,9 21,2 Competitor 1 18,7 8,3 10,0 Product 8 12,3 +10,9 14,0 12,5 13,8 42,5 Customer 7 13,4 30,7 38,6 38,4 30,3 29,8 Danfoss 15,3 15,3 15,3 15,3 15,3 15,3 92,1 Product 9 18,7 24,9 16,7 18,4 27,9 11,3 -14,0 11,9 Customer 8 19,3 19,3 19,3 19,3 19,3 19,3 115,8 Product 10 11,3 +21,3 Jan Feb Mar Apr Maj Jun Jul Avg Sep Okt Nov Dec Customer 9 21,2 21,2 21,2 21,2 21,2 21,2 127,4 Product 11 10,0 -4,8 ACT FC BUD Customer 10 19,2 19,2 19,2 19,2 19,2 19,2 115,1 Product 12 9,2 -18,9 Customer 11 15,1 15,1 15,1 15,1 15,1 15,1 90,8 Customer 12 12,4 14,1 11,9 12,9 13,9 18,9 84,2 Production in Mio Unit Sales in Mio EUR Prodaja v k€ PY 32,3 Kategorija 1 21,1 +3,9 -1,5 Product 1 +6,6 Kategorija 2 18,2 Kategorija 3 15,3 +3,9 -1,5 Product 2 +6,1 Kategorija 4 12,5 -1,8 +2,4 Product 3 +5,0 Kategorija 5 8,3 +5,0 -1,8 +2,4 Product 4 Kategorija 6 2,0 +3,9 Kategorija 7 -2,4 Product 5 +3,9 +1,2 -2,5 +2,0 Kategorija 8 -3,9 Product 6 +2,4 Kategorija 9 -5,5 23,9 Kategorija 10 -7,0 21,0 Product 7 +2,4 18,1 Kategorija 11 -8,6 Product 8 +2,0 Kategorija 12 -10,1 12,3 Product 9 +1,2 Kategorija 13 -11,6 Product 10 -2,5 Kategorija 14 -13,2 Kategorija 15 -14,7 Product 11 -3,5 Kategorija 16 -16,3 PY ∆Q1 ∆Q2 ∆Q3 ∆Q4 ACT ∆Q1 ∆Q2 ∆Q3 ∆Q4 FC ∆Q1 ∆Q2 ∆Q3 ∆Q4 BUD Product 12 -4,8 Kategorija 17 -17,8 Product 13 -5,8 Kategorija 18 -19,3 Kategorija 19 -20,9 Product 14 -8,5 Kategorija 20 -22,4 ACT 40,6 Kategorija 21 -24,0
- 21. Automatic highlighting and spot coloring Sales in Mio € +22,4 -5,2 +4,9 +13,9 -0,6 %ACT-BUD -16,5 +7,6 -14,0 +12,2 +21,3 -18,9 -4,8 21,2 20,1 20,1 ACT 19,3 19,2 13,9 12,3 12,5 11,3 11,3 10,0 9,2 Jan Feb Mar Apr Maj Jun Jul Avg Sep Okt Nov Dec
- 22. Semantic axis Prodaja v k€ 21,2 19,3 19,2 15,3 15,1 13,9 12,5 12,5 9,3 9,3 9,2 8,9 8,3 8,3 6,0 Okt Nov Dec Jan Feb Mar Apr Maj Jun Jul Avg Sep Okt Nov Dec PY ACT BUD
- 23. Semantic axis Prodaja v k€ 21,4 21,2 20,3 19,3 19,2 15,3 15,1 13,9 12,5 12,5 9,3 9,3 9,2 8,9 8,3 8,3 6,0 Okt Nov Dec Jan Feb Mar Apr Maj Jun Jul Avg Sep Okt Nov Dec PY ACT BUD BUD BUD
- 24. Mapping KPI to standard shapes % Gross Margin Price Mio Sales in EUREUR Production in 000 tons 22,3 22,3 12,5 12,5 8,3 8,9 8,9 8,3 2,0 2,0 -2,4 -2,4 -5,1 -5,1 -9,9 -9,9 -15,3 -15,3 -16,2 -16,2 -21,3 -21,3 -27,2 -27,2 Jan Feb Mar Apr Maj Jun Jul Avg Sep Okt Nov Dec ACT BUD
- 25. Dynamic charts % Gross Margin 22,3 22,3 22,3 22,3 12,5 12,5 12,5 12,5 8,3 8,3 8,3 8,3 8,9 2,0 2,0 2,0 2,0 -2,4 -2,4 -2,4 -2,4 -5,1 -5,1 -9,9-9,9 -9,9 -9,9 -15,3 -15,3-15,3 -15,3 -16,2 -16,2 -16,2 -21,3-21,3 -21,3 -21,3 -27,2 -27,2 -27,2 -27,2 Jan FebFebMarMarApr AprApr Maj Jun Jul Jul Jul SepAvgOktAvgNov Sep Jan Jan Feb Jan Feb Mar MarApr Maj JunMaj Jun Jun AvgJul Sep Sep Maj Avg Okt Okt Nov Dec ACT ACT ACT ACT BUDBUD BUD BUD
- 26. Automatic tables Sales in Mio € PY ACT -ACT - PY ACT ACT -ACT PY BUD ACT - BUD BUD BUD Products % abs % % abs % Product 1 21,2 ● -18,3-3,9 ● -18,317,3 -5,8 17,3 18,3 -1,0 -5,8 18,3 Product 2 20,1 +5,5 · +1,1 · +5,521,2 +4,7 21,2 +1,0 20,2 +4,7 20,2 Product 3 19,3 • -12,2-2,4 • -12,216,9 +11,8 • 16,9 +2,0 14,9 +11,8 • 14,9 Category1 60,7 -8,5-5,1 -8,555,5 +3,6 55,5 +2,0 53,5 +3,6 53,5 Product 5 17,9 +7,0 · +1,3 · +7,019,2 -15,6 ● 19,2 22,2 -3,0 -15,6 ● 22,2 Product 6 13,9 -7,0-1,0 -7,013,0 -7,7 13,0 14,0 -1,0 -7,7 14,0 Product 7 12,5 +19,8 ● +2,5 ● +19,814,9 +20,1 ● 14,9 +3,0 11,9 +20,1 ● 11,9 Category2 44,3 +6,2 · +2,7 · +6,247,1 -2,1 47,1 48,1 -1,0 -2,1 48,1 Product 9 11,3 +16,3 ● +1,8 ● +16,313,2 +15,2 ● 13,2 +2,0 11,2 +15,2 ● 11,2 Product 10 11,3 ● -17,6-2,0 ● -17,6 9,3 -10,7 • 9,3 10,3 -1,0 -10,7 • 10,3 Product 11 10,0 +5,0 · +0,5 · +5,010,5 +9,6 · 10,5 +1,0 9,5 +9,6 · 9,5 Product 12 9,2 +23,3 ● +2,1 ● +23,311,3 +8,8 · 11,3 +1,0 10,3 +8,8 · 10,3 Total 105,0 -2,3-2,4 -2,3 102,6 +1,0 102,6 101,6 +1,0 +1,0 101,6
- 27. “The Cognitive Fit Theory” Best fit? Problem-solving task Problem representation iStudio Reporting Template will help you achieve: • the best cognitive fit, • in minimal time and effort.