Biomarker study estimates sample size
•
0 j'aime•72 vues

1) The document presents a method for finding an optimal combination of biomarkers to maximize classification performance and estimating the necessary sample size for further studies. 2) It uses AUC (area under the receiver operating characteristic curve) to evaluate biomarkers and combinations thereof based on a pilot study of 50,416 biomarker candidates for chronic hip infection. 3) The analysis identifies the top 12 biomarkers by AUC, calculates AUC for combinations of biomarkers, and estimates a sample size of 60 would be needed to validate a combination with AUC of 0.85.
Recommandé

Recommandé
Contenu connexe
Similaire à Biomarker study estimates sample size
Similaire à Biomarker study estimates sample size (20)
Plus de LEGATO project
Plus de LEGATO project (20)
Dernier
Dernier (20)
Biomarker study estimates sample size
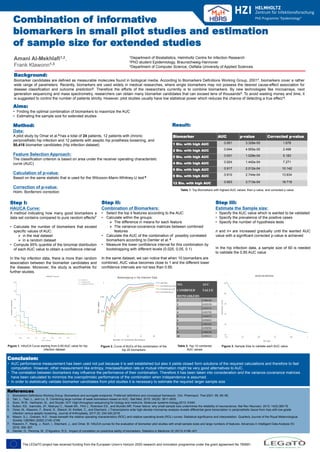
- 1. www.helmholtz-hzi.de Combination of informative biomarkers in small pilot studies and estimation of sample size for extended studies Amani Al-Mekhlafi1,2, Frank Klawonn1,3 Figure 1. HAUCA Curve starting from 0.85 AUC value for hip infection dataset Aims: • Finding the optimal combination of biomarkers to maximize the AUC • Estimating the sample size for extended studies 1Department of Biostatistics, Helmholtz Centre for Infection Research 2PhD student Epidemiology, Braunschweig-Hannover 3Department of Computer Science, Ostfalia University of Applied Sciences Method: Data: A pilot study by Omar et al.5 has a total of 24 patients, 12 patients with chronic periprosthetic hip infection and 12 patients with aseptic hip prosthesis loosening, and 50,416 biomarker candidates (Hip infection dataset) Feature Selection Approach: The classification criterion is based on area under the receiver operating characteristic curve (AUC) Calculation of p-value: Based on the same statistic that is used for the Wilcoxon-Mann-Whitney-U test 6 Correction of p-value: Holm- Bonferroni correction Background: Biomarker candidates are defined as measurable molecules found in biological media. According to Biomarkers Definitions Working Group, 20011, biomarkers cover a rather wide range of parameters. Recently, biomarkers are used widely in medical researches, where single biomarkers may not possess the desired cause-effect association for disease classification and outcome prediction2. Therefore the efforts of the researchers currently is to combine biomarkers. By new technologies like microarrays, next generation sequencing and mass spectrometry, researchers can obtain many biomarker candidates that can exceed tens of thousands3. To avoid wasting money and time, it is suggested to control the number of patients strictly. However, pilot studies usually have low statistical power which reduces the chance of detecting a true effect 4. Step I: HAUCA Curve: A method indicating how many good biomarkers a data set contains compared to pure random effects7 • Calculate the number of biomarkers that exceed specific values of AUC: in the real dataset in a random dataset • Compute 95% quantile of the binomial distribution of each AUC value to obtain a confidence interval In the hip infection data, there is more than random association between the biomarker candidates and the disease. Moreover, the study is worthwhile for further studies. Biomarker AUC p-value Corrected p-value 1 Bio. with high AUC 0.951 3.328e-05 1.678 2 Bio. with high AUC 0.944 4.955e-05 2.498 5 Bio. with high AUC 0.931 1.028e-04 5.183 4 Bio. with high AUC 0.924 1.442e-04 7.271 6 Bio. with high AUC 0.917 2.012e-04 10.142 9 Bio. with high AUC 0.910 2.744e-04 13.834 12 Bio. with high AUC 0.903 3.713e-04 18.718 Table 1. Top Biomarkers with highest AUC values, their p-value, and corrected p-value Step III: Estimate the Sample size: • Specify the AUC value which is wanted to be validated • Specify the prevalence of the positive cases • Specify the number of hypothesis tests n and n+ are increased gradually until the wanted AUC value with a significant corrected p-value is achieved In the hip infection data, a sample size of 60 is needed to validate the 0.85 AUC value Step II: Combination of Biomarkers: • Select the top k features according to the AUC • Calculate within the groups: The difference in means for each feature The variance-covariance matrices between combined features • Calculate the AUC of the combination of possibly correlated biomarkers according to Demler et al. 8 • Measure the lower confidence interval for this combination by bootstrapping with different levels (0.025, 0.05, 0.1) In the same dataset, we can notice that when 10 biomarkers are combined, AUC value becomes close to 1 and the different lower confidence intervals are not less than 0.95. NO. COMBINED BIOMARKERS AUC VALUE 1 0.906186 2 0.952129 3 0.935715 4 0.955792 5 0.944372 6 0.958933 7 0.965342 8 0.978783 9 0.986358 10 0.993131 Figure 2. Curve of AUCs of the combination of the top 20 biomarkers Figure 3. Sample Size to validate each AUC valueTable 2. Top 10 combined AUC values The LEGaTO project has received funding from the European Union’s Horizon 2020 research and innovation programme under the grant agreement No 780681. References 1. Biomarkers Definitions Working Group: Biomarkers and surrogate endpoints: Preferred definitions and conceptual framework. Clin. Pharmacol. Ther,2001; 69, 89–95. 2. Yan, L., Tian, L., and Liu, S. Combining large number of weak biomarkers based on AUC. Stat Med, 2015; 34(29): 3811-3830. 3. Soon, W.W., Hariharan, M., and Snyder, M.P. High-throughput sequencing for biology and medicine. Molecular systems biology,2013; 9:640. 4. Button, KS., Ioannidis, JP., Mokrysz C., Nosek BA., Flint J., Robinson ES., and Munafo MR. Power failure: why small sample size undermines the reliability of neuroscience. Nat Rev Neurosci. 2013;.14(5):365-76. 5. Omar, M., Klawonn, F., Brand, S., Stiesch, M. Krettek, C., and Eberhard, J.Transcriptome wide high-density microarray analysis reveals differential gene transcription in periprosthetic tissue from hips with low-grade infection versus aseptic loosening. Journal of Arthroplasty, 2017;32: 234-240,2016. 6. Mason, S.J., Graham, N.E.: Areas beneath the relative operating characteristics (ROC) and relative operating levels (ROL) curves: Statistical significance and interpretation. Quarterly Journal of the Royal Meteorological Society 128(584) (2002) 2145–2166 7. Klawonn, F., Wang, J., Koch, I., Eberhard, J., and Omar, M. HAUCA curves for the evaluation of biomarker pilot studies with small sample sizes and large numbers of features. Advances in Intelligent Data Analysis XV, 2016; 356–367. 8. Demler, O., Pencina, M., D’Agostino, R.S.: Impact of correlation on predictive ability of biomarkers. Statistics in Medicine 32 (2013) 4196–421 Conclusion: • AUC performance measurement has been used not just because it is well established but also it yields closed form solutions of the required calculations and therefore to fast computation. However, other measurement like entropy, misclassification rate or mutual information might be very good alternatives to AUC. • The correlation between biomarkers may influence the performance of their combination. Therefore it has been taken into consideration and the variance-covariance matrices have been calculated to minimize the overoptimistic performance of the combination when independence is assumed. • In order to statistically validate biomarker candidates from pilot studies it is necessary to estimate the required larger sample size Result: