SlideShare une entreprise Scribd logo
1  sur  17
Télécharger pour lire hors ligne
Zoosymposia 2: 487–503 (2009)                                                                ISSN 1178-9905 (print edition)
      www.mapress.com / zoosymposia /
                                                                                                   ZOOSYMPOSIA
Copyright © 2009      ·   Magnolia Press                                                           ISSN 1178-9913 (online edition)


Distribution of Idanthyrsus cretus (Polychaeta: Sabellariidae) in the Tropical
Eastern Pacific and application of PCR-RAPD for population analysis

L. M. BARRIOS1,4, S. J. CHAMBERS2, N. ISMAIL1, H.M. GUZMAN3 & J. M. MAIR1
1
  School of Life Sciences, Centre for Marine Biodiversity and Biotechnology, Heriot-Watt University, Edinburgh, EH14 4AS, UK.
E-mail: j.m.mair@hw.ac.uk
2
  National Museums of Scotland, Edinburgh, EH1 1JF, UK. E-mail s.chambers@nms.ac.uk
3
  Smithsonian Tropical Research Institute, PO Box 0843-03092, Balboa, Ancon, Republic of Panama. E-mail: guzmanh@si.edu
4
  Corresponding author


Abstract

Sabellariid polychaetes, commonly known as honeycomb worms, are capable of forming large reef-like
aggregations. One species, Idanthyrsus cretus, has recently been found in several localities during surveys of Las
Perlas Archipelago, Pacific Panama. Large reefs of this species have not been recorded elsewhere in the Tropical
Eastern Pacific. The reef distribution patterns were examined and mapped with the aid of Geographical
Information Systems. Principal Component Analysis showed that the distribution of polychaete reefs in Las Perlas
Archipelago and the reef building itself seem to be mainly dependent on depth, suitable substrate, and topography,
the potential particle size for tube building, and wave exposure. Cluster analysis of Random Amplified
Polymorphic DNA with Polymerase Chain Reaction molecular techniques demonstrated that the polychaete reefs
in Las Perlas Archipelago may be derived from one population.

Key words: Polychaeta, Sabellariidae, distribution patterns, Tropical Eastern Pacific, population analysis,
molecular techniques


Introduction

Sabellariid polychaetes, commonly known as honeycomb worms, form large reef-like aggregations
in many parts of the world, including the Tropical Eastern Pacific (TEP). Since the first records in
1904 (Chamberlain 1919), many specimens of Idanthyrsus cretus have been collected from the
Pacific coast of Colombia (Hartman 1940), Costa Rica (Hartman 1944), the Galapagos Islands
(Hartman 1944; Kirtley 1994), Ecuador (Hartman 1944), and other localities in Panama (Monro
1933; Fauchald 1977; Kirtley 1994). These sites are all in the surf zone (Fig. 1) where the cool (18º–
22ºC) Peru Current (PC) initially joins the warmer South Equatorial Current (SEC), and then moves
westward toward the equator. The PC and the trade winds from the NE produce a coastal upwelling
that brings nutrient-rich sea water (Glynn & Mate 1997). The turbidity is caused, therefore, by high
nutrient waters that promote the phytoplankton blooms during the dry season (upwelling) and by the
sediments released (siltation) with freshwater discharges from rivers due to erosion of adjacent land
masses during the wet season (Macintyre et al. 1992, D´Croz & Robertson 1997).


Accepted by N. Maciolek: 2 May 2009; published: 31 Aug. 2009                                                                    487
FIGURE 1. The Tropical Eastern Pacific and the study area, the Las Perlas Archipelago. CC: California Current,
NEC: North Equatorial Current, NECC: North Equatorial countercurrent, SEC: South Equatorial Current, PC: Peru
Current. Modified from Glynn and Mate (1997) and REEF (2004).

     Nearly all previously recorded sabellariids from the TEP were incorrectly identified as
Idanthyrsus pennatus Peters, 1854 or Idanthyrsus armatus Kinberg, 1867. Idanthyrsus cretus
Chamberlain, 1919 was first described from Taboguilla Island (Pacific coast of Panama) and also
recorded as Idanthyrsus regalis Chamberlain, 1919 from the Galapagos Islands. The two species
were synonymized by Kirtley (1994) as I. cretus. In that revision of the Sabellariidae, many records
were reidentified and described as new species (Kirtley 1994).
     Sabellariid distribution is constrained by the availability of stable substrates for the settlement of
immature stages and sedentary adult stages (Kirtley 1994). There has been extensive work on
Sabellaria alveolata Linnaeus, 1767 larvae from British waters. For this species it has been
demonstrated that the larvae require gentle water movement and more importantly the presence of
other newly settled larvae or other living or dead adults to induce settlement (Wilson 1968). All
sabellariids are filter feeders and need a constant food supply, high levels of dissolved oxygen, and
suspended sediments or shell fragments for tube building (Wilson 1929; Volvelle 1965). Specimens
usually occur in the surf zone in water depths less than 10 m, although a few species such as Gesaia
sp. and Phalacrostemma sp. are known from deep waters (Kirtley 1994). For most Sabellariids there
is minimal information relating to depth, temperature, salinity, distribution patterns, reproduction,
life stages, microhabitats, associated fauna, and associated habitat details. All published records for
I. cretus (Table 1) are descriptions of single tubes associated with coral reef environments (e.g.,
Costa Rica and Colombia) or rocky areas in low- to mid-shore or tide pools (e.g., Panama, Ecuador,
Galapagos); however, no sabellariid reefs have been recorded in any of these areas.
     The Panamanian TEP (see Fig. 1) is a very productive area due to the existence of upwelling
(D’Croz et al. 2003). This upwelling leads to shallow thermoclines and enrichment of the coastal and
nearshore waters. However, a remarkable characteristic of the TEP is that concentrations of surface
nutrients continuously remain high and appear never to be completely depleted despite the high
phytoplankton productivity (Agujetas-Medrano 2004). There is also high turbidity that results in low
biodiversity in some taxonomic groups like corals (Glynn & Mate 1997; D’Croz & Robertson 1997;


488   · Zoosymposia 2 © 2009 Magnolia Press                                                   BARRIOS ET AL.
Diaz et al. 2000) in contrast with the Tropical Western Pacific (Glynn 2001). The upwelling occurs
each year during the dry season that lasts from January to April (D’Croz et al. 2001), with the coldest
period in March (average 20ºC) and the warmest period (average 28ºC) between May and July
(D’Croz & Robertson 1997; D’Croz & O’Dea 2007).

TABLE 1. Distribution of Idanthyrsus cretus in the Tropical Eastern Pacific and main habitat details.

                                Original          Kirtley (1994)
 Locality                                                           Habitat details                  Reference
                                identification    identification
 Panama, Isla Taboguilla        I. cretus         I. cretus         1.8 m, coral.                    Chamberlain
                                (holotype)                                                           1919: 485
 Panama, Taboga Island          I. pennatus       I. cretus         Hotel Pier                       Monro 1933:
                                                                                                     1065
 Panama, Gorgona Island         I. pennatus       I. cretus         From coral at low tide and       Monro 1933:
                                                                    at 1 fth, in tubes or solitary   1065

 Panama, Gorgona Island,        I. pennatus       I. cretus         All low to mid shore.            Fauchald
 Taboga Island (Monro’s                                                                              1977: 54
 specimen)
 Panama, Pinas Bay, Secas       I. pennatus       I. cretus         3.6–7.3 m tubes                  Hartman 1944:
 Island, Coiba Island                                               overgrown with coral,            336
                                                                                                     RV Velero
 Panama, Pedro Gonzales         I. pennatus                                                          Kirtley 1994:
 Island, Islas Perlas                                                                                95
 Galapagos, Floreana, Tagos     Idanthyrsus sp?   I. cretus         Shore and tide pool              Kirtley 1994:
 Cove, Chatham Island,                                                                               95
 Sullivan Bay James Island

 Velero exp from Mexico to      I . pennatus      I. cretus         Shore to 6 m                     Hartman 1944:
 Ecuador                        I. armatus                                                           336, 131
 Colombia, Puerto Utria,        I. pennatus       I. cretus         Outer island, shore, on          Hartman 1944:
 reefs, Octavia Bay                                                 Pocillopora coral. All           336
                                                                    shallow to 10–11 m coarse        RV Velero
                                                                    sand and gravel
 Costa Rica, Playa Blanca,      I. pennatus       I. cretus         on Poronia coral                 Hartman 1944:
 Viradores Islands, Puerto                                                                           336
 Culebra                                                                                             RV Velero

 Ecuador, Punta Santa Elena,    I. pennatus       I. cretus         tide pool                        Hartman 1944:
 coll. Waldo Schmitt                                                                                 336
                                                                                                     RV Velero
 Galapagos, Gardner Bay         I. pennatus       I. cretus         shore                            Hartman 1944:
 Hood Is, Flamingo Bay                                                                               336
 Charles Island, Albemarle
 Sound, Duncan Island,                                                                               RV Velero
 Darwin Bay Tower Island,
 Sullivan Bay James Island

 Galapagos                      I. regalis        I. cretus         Chatham Island                   Chamberlain
                                 (holotype)                                                          1919: 487


DISTRIBUTION AND POPULATION ANALYSIS OF TEP SABELLARIIDS                 Zoosymposia 2 © 2009 Magnolia Press ·   489
The aim of the present study was to document distribution patterns for Idanthyrsus cretus in the
TEP in relation to physical data. The analysis of the population data of the Las Perlas colonies
included a molecular approach by using cluster analysis of Random Amplified Polymorphic DNA
with Polymerase Chain Reaction (PCR-RAPD) techniques to investigate possible genetic links and
geographic origins.


Materials and methods

Field survey (the polychaete reef environment). Las Perlas Archipelago is an area to the SE of
Panama Bay (8o14'00'' to 8o39'00'' N/ 78o50'00'' to 79o06'36'' W) and consists of one large, two or
three medium, and several small islands (Fig. 2). Basic ecological information (e.g., polychaete reef
distribution, associated fauna), collected between August 2004 and May 2005, was obtained from six
stations in 2–6 m water depth relative to low tide. Stations 60, 62, 63, 66, and 68 correspond to a
sand habitat and station 29 corresponds to a coral reef habitat (Benfield 2005; Barrios 2007). The six
stations were selected for detailed study based on data collected during several surveys in the area in
2003 and 2004 (Benfield 2005). Station 66, with the largest reef, was subdivided into seven stations,
resulting in a total of 12 stations.


FIGURE 2. Field site: Las Perlas Archipelago. Circles in yellow are the six stations where samples and data were
collected. Circles in orange are the stations for sediments (22, 23, 36, 61, 62, 77, 78). Courtesy of Sarah Benfield
database (Benfield 2005).

    At each station, at least 10 organisms were removed by cutting off a section of the tube aggregate
(blocks of sand tubes), except at station 29 where only two organisms were collected (they were
found individually as part of a reef environment and not as tube aggregates). The samples were fixed
in 10% formalin, preserved in 74% alcohol, identified, and deposited at the National Museums of
Scotland (Register Number NMSZ.2006.073). Samples fixed and preserved in 96% ethanol were
analyzed with molecular techniques to determine their population origin. All species associated with
the sections of polychaete reef removed from each station were identified to phylum level.


490   · Zoosymposia 2 © 2009 Magnolia Press                                                        BARRIOS ET AL.
Information on the density and dimensions of the polychaete reef (to identify polychaete reef
structure) and on the surrounding environment (sediment type, type of benthic community,
distribution of the species and percent cover in coral reef environments) was also collected by
conducting 30-minute visual surveys. At the largest reef (station 66, San Telmo), one length and
three width measurements were recorded. One single width and one single length were recorded in
smaller aggregates. Density was measured in the larger reef with 1-m2 quadrats (a total of six
quadrats) subdivided into squares of 10 x 10 cm. No measures of density were taken in the smaller
reefs as they appeared to have the same development pattern observed in the largest reef.
    Substrate information collected during the 2003 and 2004 surveys (Benfield 2005) related to
coral reefs (e.g., percent cover of benthic organisms, visibility, topography) was used to describe
habitats surrounding the polychaete reefs in San Telmo (station 66) and Isla del Rey (stations 60, 62,
63, 68), and as part of the environmental information for statistical analysis. Sea Surface
Temperature–SST and salinity records collected at the Smithsonian Tropical Research Institute–
STRI were used for comparison with the data collected during the field surveys. Sediment
information collected during the 2003 and 2004 surveys (Benfield 2005) related to percent sediment
composition (gravel, very coarse sand, coarse sand, medium sand, fine sand, very fine sand,
silt+clay) near the polychaete reef stations (see Fig. 2, stations 22, 23, 36, 61, 62, 77, 78) was used as
part of the environmental information for statistical analysis (Table 2).

TABLE 2. Type of sediments in areas around the stations (values for sediment particle sizes in percentage, %).
Grade limits ( m) in Wentworth grade classification: Gravel (4000–2000), Very Coarse Sand (2000–1000), Coarse
               μ
Sand (1000–500), Medium Sand (500–250), Fine Sand (250–125), Very Fine Sand (125–62), Silt+Clay (<62).

 Nearest           Station                         Very                                       Very
 polychaete        for         Sediment            Coarse    Coarse     Medium      Fine      Fine     Silt
 station           sediments   type       Gravel   Sand      Sand       Sand        Sand      Sand     +Clay
 66                22          sand       4.6      17.4      24.9       39.5        13.0      0.2      0.5
 68,60,62,63       23          sand +     1.3      1.1       1.0        4.2         58.4      22.6     11.5
                               shells
 68,60,62,63       36          mud +      4.1      1.6       1.3        1.7         13.0      60.5     17.8
                               sand
 29                61          mud        0.0      0.2       0.1        0.0         8.7       36.3     54.7
 29                62          mud        0.2      0.0       0.3        0.9         7.3       38.3     52.9
 29                77          mud        0.6      0.2       0.1        0.3         1.1       17.9     79.9
 29                78          mud        0.5      1.0       0.6        0.2         1.1       10.3     86.2


    Material examined for confirmation of the species. The holotypes of Idanthyrsus cretus
Chamberlain, 1919 from Taboguilla Island, Panama Bay (USNM 19716), I. regalis Chamberlain,
1919 collected 1 September 1905 from Galapagos Islands (USNM 19383), specimens identified as I.
pennatus by Monro (1933) from Taboga Island, Panama Bay (NHM.1933.7.10.192-196) and
Gorgona Island, Colombia (NHM. 1933.7.10.182-19), and five representative specimens from 50
complete polychaete collected August 2004 in San Telmo Island, Las Perlas Archipelago (NMSZ
2006.073) were examined.
    Molecular analysis. The molecular analysis was carried out at the Center for Marine
Biodiversity and Biotechnology, Heriot-Watt University. Samples of I. cretus were collected from all
12 stations, for a total of 46 samples, and prepared for DNA extraction (QIAGEN 2006). The final
solutions were kept in a freezer at -20°C.


DISTRIBUTION AND POPULATION ANALYSIS OF TEP SABELLARIIDS              Zoosymposia 2 © 2009 Magnolia Press ·   491
PCR-RAPD protocols, as described by Soosten et al. (1998) and Schmidt & Westheide (1999),
were used with minor modifications for DNA amplification of the 46 samples. From the original
protocols a total of 17 decamer primers OPB (www.mwg-biotech.com, Germany) with a GC-content
between 60 and 70% (Table 3) were applied. The reaction volume of 25 μl was composed of 12.5 μl
of 2 x biomix buffer (Bioline), 0.25 μl of mwg primer, 1 μl DNA, and 11.25 μl DH2O (MiliQ).
Controls were run changing the concentration of DNA for DH2O. During amplification, one main
thermocycler was used (BIORAD, Hercules, California). Forty-five cycles were employed (modified
from Soosten et al. 1998), each comprising:
    • Step 1: 94˚C/4 min (1 cycle)
    • Step 2: 94˚C/1 min for denaturation, 34˚C/1 min for annealing, and 72˚C/30 sec for elongation
      (fastest available transition between temperatures), (45 cycles)
    • Step 3: 72˚C/10 min (1 cycle),
    • Step 4: endless file at 4˚C/ ∞

TABLE 3. Decamer primers (www.mwg-biotech.com, Germany) and their Guanine-Cysteine (GC) content.


 PRIMER                       SEQUENCE 5 -3   ′   ′                  GC content (%)
 OPB-1                        GTTTCGCTCC                             60
 OPB-2                        TGATCCCTGG                             60
 OPB-3                        CATCCCCCTG                             70
 OPB-4                        GGACTGGAGT                             60
 OPB-5                        TGCGCCCTTC                             70
 OPB-6                        TGCTCTGCCC                             70
 OPB-7                        GGTGACGCAG                             70
 OPB-8                        GTCCACACGC                             70
 OPB-10                       CTGCTGGGAC                             70
 OPB-11                       GTAGACCCGT                             60
 OPB-12                       CCTTGACGCA                             60
 OPB-14                       TCCGCTCTGG                             70
 OPB-15                       GGAGGGTGTT                             60
 OPB-16                       TTTGCCCGGA                             60
 OPB-17                       AGGGAACGAG                             60
 OPB-18                       CCACAGCAGT                             60
 OPB-19                       ACCCCCGAAG                             70


    Amplified DNA fragments were separated with a gel loading dye (Fermentas Company) at 82
volts for 10 min followed by 90 volts at maximum 20–30 min (best running time for gels with eight
pools was 25 minutes, until samples reached the middle). The ethidium bromide stain was visualized
and documented under UV light. In order to optimize the best running time for the primer screening,
bigger gels (16 pools in one line, 1% agarose, SCIEPLAS Company, www.scieplas.co.uk) were run
for a maximum of 2.5 h (82 volts for 10 min, followed by 90 volts), with images recorded at 1.5 h,
2 h and 2.5 h (best running time for gels with 16 pools was 2 h). A set of 10,000BP, 1,000BP, and
100BP ladders (Fermentas Company) was used for length comparison during the whole procedure.
The results were run in a gel of 1% agarose (TAE 1X).

492   · Zoosymposia 2 © 2009 Magnolia Press                                            BARRIOS ET AL.
The reproducibility of the data was checked at regular intervals on different levels throughout
parallel experiment lines, including potential differences in the amplification patterns that might be
derived from the use of different thermocyclers (both thermocyclers were from the same company)
as recommended in Soosten et al. (1998) (i.e., use two different thermocyclers to analyze a group of
samples and their replicates, and use two different gels to run a same group of RAPD-PCR products
that have been processed in the same thermocycler).
    For the primer screening, and in order to have the entire spectrum of possibilities, a combination
of all 46 samples was used with the three primers, OPB-5, OPB-6, OPB-18, that gave the best results
in the Soosten et al. (1998) and Schmidt & Westheide (1999) analyses. Three samples with the
biggest polymorphism expression (largest number of bands) were then selected to compare with the
other 14 primers (see Table 2). In each series, one reaction was carried out with a blind sample
lacking DNA to check for contamination with foreign DNA.
    Statistical analysis. To identify the main environmental factors responsible for the I. cretus
distribution observed at the Las Perlas Archipelago (differences between stations), Principal
Component Analysis (PCA) was applied to the data using Minitab software (Wardlaw 2001). The
variables included were: depth (meters); percent sediment composition (gravel, very coarse sand,
coarse sand, medium sand, fine sand, very fine sand, silt+clay); wave exposure (1 = sheltered e.g.,
bay, 2 = low to moderate, 3 = moderate, 4 = moderate to high, 5 = high e.g., headland); visibility
(meters); percent coral cover with respect to total hard bottom area; topography (1 = no vertical or
very low vertical structure or complexity, 2 = low or with undulations from 0 to 0.5 m, 3 = moderate
or with 0.5 to 1 m outcrops, some boulders, crevices and overhangs, 4 = high or with 1.5 to >2 m
outcrops, many overhangs, crevices and boulders). Due to the fact that the variables were measured
on different scales, a standardization (Standard Deviation) was performed before the analysis
(correlation of the different variables).
    To identify possible genetic links between the organisms from each station and relate these links
to a possible common geographic origin, regression and cluster analyses were applied to the results
of the molecular analysis using specialized software. The detected amplification product patterns
collected from the gels were examined with the GEL-COMPARE software to determine the number
of stable bands in common or the number of monomorphic and polymorphic markers (Applied
Maths BVBA 1998). In this case, an identification group of the taxonomic unit was created from the
results of the gels, containing a collection of representative fingerprints, representing the variability
within the group. The software then counted the relative frequency of occurrence for each individual
band, assigning more weight to bands with a high occurrence frequency (typical bands). The main
regression in each gel (group of bands in a particular gel vs. group of bands in the identification
group) was based on the differences in concentration and distance of each band from the origin of the
gel. A secondary regression was based on the differences in morphology and/or staining of the band
groups vs. the identification group. Cluster analysis was carried out with UPGMA methods
(unweighted pair-group method using arithmetic averages), based on the band information provided
by the polymorphism analysis. For the analysis the recommended coefficients of similarity were
applied (Pearson correlation coefficient for clusters on single gels and averages from experiments for
clusters from combinations of gels).


Results

The polychaete reef environment
Twelve reefs or aggregates of I. cretus were found during the 2003–2004 surveys (Benfield 2005).


DISTRIBUTION AND POPULATION ANALYSIS OF TEP SABELLARIIDS           Zoosymposia 2 © 2009 Magnolia Press ·   493
They were southeast (SE) of the Las Perlas Archipelago, specifically SE of Isla del Rey and north of
San Telmo Island (see Fig. 2). During the 2004–2005 surveys it was evident that the area SE of Isla
del Rey is characterized by uncolonized rock surrounded by sand bottoms, while the northern part of
San Telmo Island is a coral community surrounded by sand bottoms.
    All reefs are exposed to strong currents and wave action from the SE Pacific (which is high in
energy and suspended particulates). Five of the polychaete reefs in San Telmo and Isla del Rey were
analyzed. Their depth range was 0–6 m and the top of the reef at San Telmo was exposed at low
spring tides. The approximate size of the largest I. cretus reef (station 66) was 56 m2 (3.5 m average
width x 16 m total length) and had an elongated shape parallel to the coast, but the other four reefs
had a rounded shape with sizes between 2 and 4.5 m2. No reefs had been recorded on this scale
before the survey done in 2003 and 2004 to collect information on the environments surrounding the
archipelago. The San Pedro samples (station 29, two organisms) were found amongst corals as single
tubes but did not form reefs.
    The average density of organisms in the largest I. cretus reef (station 66), was 72.2 organisms/10
cm , with a maximum of 116 and a minimum of 49/10 cm2. Observations from the field showed that
   2

each individual captures food and fragments of rock and shells continuously with the oral filaments;
these activities also appear to help in the production of the cylindrical tube. The species grows in
aggregates and seems to have sexual and asexual reproduction within the aggregates. Observations
of the aggregates, morphological descriptions of the external and internal parts of live and preserved
organisms (Figs. 3, 4), and comparisons of these descriptions with those reported previously for
another related species such as Sabellaria alveolata (Cazaux 1964; Volvelle 1965) indicated a sexual
dimorphism in I. cretus as there were big dark tubes which could correspond to females, surrounded
by smaller ivory tubes that could correspond to males (see Fig. 5). In the case of S. alveolata, the
sexual dimorphism is expressed in females by pinkish purple sides and in males by whitish sides.
    The reefs also provide a habitat for a diverse fauna of sponges, cnidarians, other polychaetes,
mollusks, crustaceans, echinoderms, and fish, with an average of seven different phyla per station
(Table 4).
    The PCA of 12 variables (depth, % gravel, % very coarse sand, % coarse sand, % medium sand,
% fine sand, % very fine sand, % silt+clay, wave exposure, visibility, coral cover, topography)
showed that two main components are responsible for 100% of the polychaete reef distribution in
Las Perlas Archipelago and the differences observed between the environments in which the
polychaetes were found. The first principal component, PC1, has a variance (eigen value) of 6.419
and explains 53.5% of the distribution of the aggregations in the area. The second component, PC2,
has a variance of 5.581 and explains the other 46.5% of the distribution. The results also demonstrate
that PC1 is a combination of % gravel, wave exposure, and topography (and % silt+clay but in a
smaller proportion and with a positive value), while PC2 is a combination of depth, fine and very
fine sand in the area (as well as visibility and coral cover but in less proportion and with negative
value) (Fig. 6).

Material examined for confirmation of the species
The holotype of Idanthyrsus cretus Chamberlain, 1919 from Taboguilla Island, Panama Bay (USNM
19716), measured 3 x 10 mm for 23 segments. The holotype of I. regalis Chamberlain, 1919 from
Galapagos Islands (USNM 19383), measured 5 x 40 mm for 27 segments. The specimens identified
as I. pennatus by Monro (1933) from Taboga Island, Panama Bay (NHM.1933.7.10.192-196) and
Gorgona Island, Colombia (NHM. 1933.7.10.182-19) were all incomplete with no tail region; the
specimen from Taboga measured 2 x 14 mm for 35 segments and the specimens from Gorgona 1 x
10 mm for 29 segments and 2 x 13 mm for 31 segments. From the 50 complete specimens collected
during the August 2004 survey in the Las Perlas Archipelago (NMSZ 2006.073), 42 were used

494   · Zoosymposia 2 © 2009 Magnolia Press                                            BARRIOS ET AL.
partially for molecular purposes and five specimens were used for taxonomic confirmation purposes
(see Figs. 3–4). The measurements for the five specimens were: 5 x 41 mm for 53 segments, 5 x 51
mm for 59 segments, 3 x 27 mm for 45 segments, 4 x 21 mm for 44 segments, and 4 x 23 mm for 45
segments.


FIGURE 3. Ventral view of Idanthyrsus cretus (NMSZ 2006.73) from San Telmo Island. Organism removed from
tube measured 41mm.


DISTRIBUTION AND POPULATION ANALYSIS OF TEP SABELLARIIDS          Zoosymposia 2 © 2009 Magnolia Press ·   495
FIGURE 4. Idanthyrsus cretus (NMSZ 2006.73)      FIGURE 5. I. cretus section of reef from station 66 in
 from San Telmo Island. Section of tube with      San Telmo Island. The arrows indicate the large female
 animal protruding.                               tubes surrounded by small male tubes.


FIGURE 6. Principal Component Analysis for the first two components, which explain 100% of the polychaete
distribution.


496   · Zoosymposia 2 © 2009 Magnolia Press                                               BARRIOS ET AL.
TABLE 4. Number of associated species/taxa (total organisms/taxa) in the Idanthyrsus cretus reef in San Telmo
Island. Average species/station = 6.55.

                                                                                             Total    Total
                                                                                             spp/     organisms/
 Groups/Station            66.1    66.2   66.3    66.4   66.5   66.6   66.7    66.8   66.9   taxon    taxon
 Porifera                                                                      1(1)          1        1
 Cnidaria              1(1)       1(1)                                                       2        2
 Polychaeta            1(1)                      1(1)    5(5)                                7        7
 Mollusca              1(2)       5(5)           1(1)                          3(3)          10       11
 Crustacea             7(14)      6(9)    1(1)   4(5)    3(4)          1(1)    3(9)   2(2)   27       45
 Echinodermata         2(4)       4(14)   1(2)   1(1)           1(2)   1(1)           1(2)   11       26
 Vertebrata                       1                                                          1        1
 Total spp./station    12         17      2      7       8      1      2       7      3


Molecular analysis
The primer screening with OPB-5, OPB-6, and OPB-18 (Fig. 7) demonstrated that Primer OPB-18
was more discriminating than OPB-6 and both revealed more bands or polymorphism than OPB-5.
Each station presented a different band pattern when compared with the same primer. Station 68 had
five bands with primer OPB-18, while station 66.1 had two bands and station 66.3 between six and
seven bands. However, the last two stations from San Telmo (66.1 and 66.3) illustrated only slight
variation in the bands. Samples 66.3.3 and 62.2, with the best polymorphism results (Table 5), were
selected to run the complete primer screen with all 17 primers, and to identify the best primer for this
species (Figs. 8–9).


FIGURE 7. Results of primer screening with decamer primers OPB-5, OPB-6, OPB-18. Gel 1 (top left) is station
68 from SE Isla del Rey. Bottom left Station 66.1 in San Telmo Island. Gel 2 (right): station 66.3 in San Telmo
Island.


TABLE 5. Samples with the largest number of bands (polymorphism) from the analysis with the first three
primers: OPB-5, OPB-6, OPB-18. NA: information not available.

 Station               Replicate                 No. bands OPB-5       No. bands OPB-6        No. bands OPB-18
 66.3                  3                         4                     6                      6-7
 62                    2                         NA                    3(+)                   7
 68                    3                         3                     2(+)                   5(+)
 66.8                  3                         1                     1                      6
 66.5                  3                         1(+)                  1                      3
 66.4                  4                         NA                    NA                     4
 60                    4                         NA                    NA                     4


DISTRIBUTION AND POPULATION ANALYSIS OF TEP SABELLARIIDS                   Zoosymposia 2 © 2009 Magnolia Press ·   497
FIGURE 8. Primer screen with the two selected samples (station 62, second replicate, station 66.3, third replicate).
Left: gel (1% agarose, SCIEPLAS) after 2 hours of electrophoresis. Right: same gel after 2.5 hours. Pools 1 to 16
correspond to analysis with sample 62.2. Pools 17 to 32 correspond to analysis with sample 66.3.3. 1:OPB-1,
2:OPB-2, 3: OPB-3, 4: OPB-4, 5: OPB-6, 6:OPB-7, 7: OPB-8, 8: OPB-10, 9: ladder, 10: OPB-11, 11: OPB-12, 12:
OPB-14, 13: OPB-15, 14: OPB-16, 15: OPB-17, 16: OPB-18, 17: OPB-19, 18: control, 19: OPB-1, 20: OPB-2, 21:
OPB-3, 22: OPB-4, 23: OPB-6, 24: OPB-7, 25: ladder, 26: OPB-8, 27: OPB-10, 28: OPB-11, 29: OPB-12, 30:
OPB-14, 31: OPB-15, 32:OPB-16. Circles highlight pools 6 and 7, 16, and 24 and 26 with the primers OPB-7,
OPB-8, and OPB-18 respectively.


FIGURE 9. Test of reproducibility. Analysis with all the primers and samples 66.3.3 and 62.2 confirm the results
on previous gel (Fig. 8) with the same samples. In this second case OPB-18 (pools 4 and 28), OPB-7 (pools 11 and
20) and OPB-8 (pools 12 and 21) give the best results in terms of bands (polymorphism) and definition. Pools 29 to
32 confirm reproducibility when using different thermocyclers. Samples from pools 29 to 31 are RAPD-PCR
products for OPB-18, the same primer and samples than in figure 8, but that were run in a second thermocycler.
Pools 1 to 16 are analyses with samples from station 66.3 (third replicate). Pools 17 to 28 are analyses with samples
from station 62 (second replicate). 1: control, 2: OPB-16, 3: OPB-17, 4: OPB-18, 5: OPB-19, 6: OPB-1, 7: OPB-3,
8: OPB-6, 9: ladder 100bp, 10: ladder 1kbp, 11: OPB-7, 12: OPB-8, 13: OPB-10, 14: OPB-11, 15: OPB-12, 16:
OPB-13, 17: OPB-1, 18: OPB-3, 19: OPB-6, 20: OPB-7, 21: OPB-8, 22: OPB-10, 23: OPB-11, 24: OPB-12, 25:
ladder 100bp, 26: ladder 1kbp, 27: OPB-17, 28: OPB-18, 29: St 68 with OPB-18, 30: St 66.3.3 with OPB-18, 31: St
66.1.3 with OPB-18, 32: St 66.9.2 with OPB-18.


498   · Zoosymposia 2 © 2009 Magnolia Press                                                         BARRIOS ET AL.
The results of the complete primer screen and test of reproducibility (see circles in Figs. 8–9)
showed that primers OPB-7, OPB-8, and OPB-18 gave the best polymorphism results and definition
or sharpness of the bands, and therefore are the most suitable primers to analyze for this species. The
analysis with all the primers and samples 66.3.3 and 62.2 (Fig. 9) confirmed the results on previous
gels (Fig. 8) with the same samples. In this second case (see Fig. 9) OPB-18 (pools 4 and 28), OPB-
7 (pools 11 and 20), and OPB-8 (pools 12 and 21) gave the best results in terms of bands
(polymorphism) and definition. Pools 29–32 were used to confirm reproducibility when using
different thermocyclers. In this case, samples from pools 29–31 were RAPD-PCR products for OPB-
18, the same primer and samples as in figure 8, but run in a second thermocycler from the same
company. Pools 1–16 were analyses with samples from station 66.3 (3rd replicate), while pools 17–28
were analyses with samples from station 62 (2nd replicate). Fifty (50) DNA fragments were detected
with primer OPB-18 and 55 with primer OPB-7 by using band-matching analysis (software
GELCOMPARE) for all the samples.
    The cluster analyses, run to identify levels of similarity between samples and between stations
based on the degree of polymorphism of the samples, showed that there were no statistically
significant differences between stations (Fig. 10). Higher similarity between samples belonging to
different stations is shown in gel 4 (see Fig. 10). Here, the second sample from the San Telmo station
66.5 (sample 66.5.2, SE of the archipelago) is more related to the first sample from San Pedro station
29 (sample 29.1, NE of Isla del Rey) than to the other sample from San Telmo (sample 66.5.1). In the
same way, sample 63.3 is more similar to sample 60.3 than to sample 63.4. The same pattern is
evident in gels 1 and 3 (see Fig. 10, arrow for sample 66.5.2 in gel 1 and clustering of samples from
station 66 in San Telmo).


FIGURE 10. Cluster analysis based on the degree of polymorphism of the samples (similarity based on Pearson
correlation coefficient and UPGMA dendrogram type for each gel) for samples run with primer OPB-7 (analysis
for 41 of a total of 46 samples). Each dendrogram presents in each node the error flags and the co-phenetic
correlations.


DISTRIBUTION AND POPULATION ANALYSIS OF TEP SABELLARIIDS            Zoosymposia 2 © 2009 Magnolia Press ·   499
Discussion

The average density value of Idanthyrsus cretus forming the largest reef in the Las Perlas
Archipelago (72.2 organisms/10 cm 2 ) was similar to that reported by Caline et al. (1988) for
Sabellaria alveolata. The fauna associated with the I. cretus reefs indicated that these polychaete
reefs provide, in the SE of Las Perlas Archipelago, a suitable habitat for a diverse fauna in a similar
way to that provided by coral reefs in the NW of the archipelago. These assumptions are supported
by general observations during the 2004–2005 surveys related to benthic composition in the
archipelago (e.g., SE of the archipelago is characterized by uncolonized rock surrounded by sand
bottoms while NW is mainly a coral community surrounded by sand bottoms) and by the results of
Mair et al. (2009) in which the authors describe a similar grouping for benthic communities in the
Las Perlas Archipelago, with a multiscale analysis that shows differences in the benthic communities
between SE and NW with respect to species composition and abundance. Hendrick & Foster-Smith
(2003), in a description of the Sabellaria spinulosa reefs in the UK, quote the official definition of
“reef” for the European Union Habitats Directive as follows: “reefs are submarine or exposed at low
tide, rocky substrates and biogenic concretions, which arise from the sea floor in the sublittoral zone
but may extend into the littoral zone where there is an uninterrupted zonation of plant and animal
communities. These reefs generally support a zonation of benthic communities of algae and animal
species including concretions, encrustations and corallogenic concretions.” An animal community
will use the physical and ecological habitat supplied by any type of reef in the area. In the case of Las
Perlas these are coral reefs in the north and west, and sabellariid reefs to the south and east of the
archipelago.
    Sea Surface Temperature (SST, Fig. 11) and salinity records (Fig. 12) collected by the Terrestrial
and Environmental Science Programme, Smithsonian Tropical Research Institute-STRI illustrated
the following:
    • An upwelling between January and April of each year that can be identified by a reduction in
       temperature and increase in salinity. The lowest temperatures are in March and the highest
       between May and July of each year.
    • The mean temperature for the last 15 years (1992–2005) was 26.63°C, but temperatures as low
       as 14.7°C (Saboga, 22/02/2001) and as high as 30°C (Saboga, 9/11/1997) have been recorded.
    • The mean salinity for the last 17 years (1990–2005) in Panama Bay was 30.18‰, but the
       records show salinities as low as 22‰ (21/10/1995) and as high as 44.8‰ (4/02/2005).


FIGURE 11. Sea Surface Temperatures for Las Perlas Archipelago (1992–2005). Data sets were provided by the
Smithsonian Tropical Research Institute (STRI 2008).


500   · Zoosymposia 2 © 2009 Magnolia Press                                               BARRIOS ET AL.
FIGURE 12. Salinity (in red) and temperature (blue and yellow) records for Panama Bay (1990–2005). Data sets
were provided by the Smithsonian Tropical Research Institute (www.stri.org).

    The evidence in the records of this upwelling is a more detailed description of the effect of the
Peru Current-PC and the South Equatorial Current-SEC in the area, and gives a better base to the
assumptions of a southern origin to the actual larval settlement of sabellariid reefs in Las Perlas
Archipelago. A particular aspect of the upwelling in Las Perlas Archipelago is that this phenomenon
helps to keep continuous high nutrient and phytoplankton levels in the area (Agujetas-Medrano
2004), creating a high turbidity that causes a low intra-ecosystemic biodiversity for some groups like
corals (Diaz et al. 2000). The combination of this low development of corals in the SE area of the
archipelago (leading to low competition for colonization space), and the abundance of sediments and
hydrodynamics may play a key role in the development of significantly-sized I. cretus reefs which
are recorded in this study for the first time in the Tropical Easter Pacific.
    The ecological information (reef environment and general oceanographic conditions) and the
PCA based on data from the five reefs in the SE of Las Perlas Archipelago, plus the two samples
collected from a coral reef environment (station 29), confirm that reef building and the distribution
of I. cretus reefs are dependent firstly on suitable topography, sediment particle size to produce
tubes, and wave exposure. In the case of the relationship between sediment particles and the
polychaete tubes, the ability to control abdominal growth is important so that the animal is not longer
than the tube and vulnerable to predation (Vovelle 1965). In other species (e.g., Sabellaria aveolata
from the NE Atlantic) there is a link between the size of the building organ, the diameter of the
anterior region, and the length of animal, which determines the size of particles used in tube building
(Gruet 1984). Coral cover, visibility, and depth are important for the polychaetes individually when
they have already settled in a reef environment as they are not able to create their own reef. This was
the case for station 29. Thus, the PCA showed two main environments where the sabellariids can be
found. The first type of environment is described by PC1 and corresponds mainly to the benthic
environments found in the SE of the archipelago (uncolonized rock surrounded by sand bottoms),
where the sabellariids are able to develop polychaete reefs due to the higher wave exposure. The
second type of environment is described by PC2 and corresponds to the benthic environments found
in the NW of the archipelago (coral community surrounded by sand bottoms), where the sabellariids
survive only as part of the coral reef community. Therefore, the sabellariids found in station 29 (San
Pedro Island, NE of Isla del Rey) may be part of the boundaries between these two environments.
    In the case of the molecular techniques, although the cluster analysis with the gels illustrated
some differences in the bands between stations, the differences were not statistically significant. In
order to identify differences between stations, samples within a particular station should show higher
similarity than with samples from other stations. However, the similarity for samples belonging to
different stations was of the same order as the similarity within the stations. Therefore no major


DISTRIBUTION AND POPULATION ANALYSIS OF TEP SABELLARIIDS             Zoosymposia 2 © 2009 Magnolia Press ·   501
differences could be detected in the Las Perlas Archipelago samples. One interpretation of these
results is that the different reefs have a similar origin or come from one population. Based on the
oceanographic information analyzed (that shows the effect of the Peru Current-PC and the South
Equatorial Current-SEC in the area), and the document by Glynn & Mate (1997) that indicates
transportation of waters from South America to Panama by these currents, it is feasible to suggest
that the original settlement in Las Perlas Archipelago occurred from the south, probably Colombia or
Ecuador. The population may have arrived first at San Telmo (the largest reef), where they found
good conditions for settlement and survival and, from there, the organisms colonized other sites in
Las Perlas.


Acknowledgements

We would like to thank the Darwin Initiative which is administered by the UK Department for Environment,
Food and Rural Affairs-DEFRA. (http://www.darwin.gov.uk/). We also thank Dr. Hector Guzman’s team
working at STRI (Carlos Guevara, Inez Cambell, Jose Miguel Guevara) and the crew of the STRI research
vessel “Urraca”.


References

Agujetas-Medrano, J. (2004) The Seasonal Upwelling and the Primary Production of the Panama Bight Estimated
    from Satellite Data: ENSO Implications. MSc thesis. School of Ocean Sciences, University of Wales, Bangor,
    98 pp.
Applied Maths BVBA. (1998) Applied maths: Software for lab-wide data-basing and analysis of biodata. Available
    from http://www.applied-maths.com/ (January 2007).
Barrios, L.M. (2007) Taxonomy and General Ecology of Marine Invertebrates from Las Perlas Archipelago,
    Panamanian trOpical Eastern Pacific. PhD thesis. Heriot-Watt University, Edinburgh, 218 pp.
Benfield, S.L. (2005) Mapping Coral Reefs and Associated Sublittoral Habitats: A Comparison of Optical Remote
    Sensors and Image Classifiers and a Study of the Community Structure of Reef-associated Fish. PhD thesis.
    Heriot-Watt University, Edinburgh, 395 pp.
Caline, B., Gruet, Y., Legendre, C., Le Rhun, J., L’Homer, A., Mathieu, R. & Zbinden, R. (1988) Les récifs á
    Annélides (Hermelles) en baie du Mont Saint-Michel: écologie, géomorphologie, sédimentologie et
    implications géologiques. Documents du Bureau de Recherches Géologiques et Minières, 156, 1–159.
Cazaux, C. (1964) Dévelopment larvaire de Sabellaria alveolata (Linné). Bulletin de L’Institut Océanographique
    Monaco, 62, 1–15.
Chamberlain, R.V. (1919) The Annelida Polychaeta of the Albatross Tropical Pacific Expeditions, 1891–1905.
    Memoirs of the Museum of Comparative Zoology, Harvard, 48, 1–514.
D´Croz, L. & Robertson, D.R. (1997) Coastal oceanographic conditions affecting coral reefs on both sides of the
    Isthmus of Panama. Proceedings of the 8th International Coral Reef Symposium, Panama, 5 pp.
D’Croz, L. & O’Dea, A. (2007) Variability in upwelling along the Pacific shelf of Panama and implications for the
    distribution of nutrients and chlorophyll. Estuarine, Coastal and Shelf Science, 73, 325–340.
D´Croz, L., Mate, J.L. & Oke, J.E. (2001) Responses to elevated sea water temperature and UV radiation in the
    coral Porites lobata from upwelling and non-upwelling environments on the Pacific coast of Panama. Bulletin
    of Marine Science, 69, 203–214.
D´Croz, L., Kwiecinski, B., Mate, J.L., Gomez, J.A. & Del Rosario, J.B. (2003) El afloramiento costero y el
    fenómeno del El Niño: implicaciones sobre los recursos biológicos del Pacifico de Panamá. Tecnociencia, 5,
    35–49.


502   · Zoosymposia 2 © 2009 Magnolia Press                                                     BARRIOS ET AL.
Díaz, J.M., Barrios, L.M., Cendales, M.H., Garzón-Ferreira, J., Geister, J., López-Victoria, M., Ospina, G., Parra-
    Velanda, F., Pinzón, J., Vargas-Angel, B., Zapata, F. & Zea, S. (2000) Áreas coralinas de Colombia.
    INVEMAR, Serie Publicaciones Especiales, No. 5, 1–176.
Fauchald, K. (1977) Polychaetes from intertidal areas of Panama, with a review of previous shallow water records.
    Smithsonian Contributions, Zoology, No. 221, 1–81.
Glynn, P.W. (2001) Eastern Pacific coral reef ecosystems. In: Seeliger, U. & Kjerfve, B. (Eds.), Coastal Marine
    Ecosystems of Latin America, Springer-Verlag Berlin Heidelberg, Ecological Studies, vol. 144, 281–305.
Glynn, P.W. & Mate, J.L. (1997) Field Guide to the Pacific Coral Reefs of Panama. Proceedings of the 8th
    International Coral Reef Symposium, Panama, 21 pp.
Gruet, Y. (1984) Granulometric evolution of the sand tube in relation to growth of the Polychaete Annelid
    Sabellaria alveolata (Linné) (Sabellariidae). Ophelia, 23, 181–193.
Hartman, O. (1940) The Polychaetous Annelids collected by the Presidential Cruise of 1938. Smithsonian
    Miscellaneous Collections, 98, 1–22.
Hartman, O. (1944) Polychaetous Annelids. Part VI. Paraonidae, Magelonidae, Longosomidae, Ctenodrilidae, and
    Sabellariidae. Allan Hancock Pacific Expeditions, 10, 311–390.
Hendrick, V.J. & Foster-Smith, L. (2003) Sabellaria spinulosa reef: An interpretation in the context of the Habitats
    Directive. European Commission DG Environment, 2003 (Annex), pp. 1–12.
Kirtley, D.W. (1994) A Review and Taxonomic Revision of the Family Sabellariidae Johnston, 1895 (Annelida,
    Polychaeta). Sabecon Press, Florida. 223 pp.
Macintyre, I.G., Glynn, P.W. & Cortés, J. (1992) Holocene reef history in the Eastern Pacific: mainland Costa Rica,
    Caño Island, Cocos Island, and Galápagos islands. Proceedings of the 7th International Coral Reef
    Symposium, Guam, 2, 1174–1184.
Mair, J.M., Sibaja-Cordero, J.A., Arroyo, M.F., Merino, D., Vargas, R., Guzman, H. & Benfield, S. (2009)
    Mapping benthic faunal communities in the shallow and deep sediments of Las Perlas Archipelago, Pacific
    Panama. Marine Pollution Bulletin, 58, 375–383 (doi:10.1016/j.marpolbul.2008.10.015).
Monro, C.C.A. (1933) The Polychaeta Sedentaria collected by Dr. C Crossland at Colon, in the Panama Region,
    and the Galapagos Islands during the expedition of the S Y “St George”. Proceedings of the Zoological Society
    of London, Part 2, 1039–1092.
QIAGEN (2006) DNeasy® blood and tissue handbook. QIAGEN, 62 pp. Available from: www.qiagen.com
    (October 2006).
REEF (2004) The Reef Environmental Education Foundation database. Available from: http://www.reef.org/data/
    database.htm (April 2009).
Schmidt, H. & Westheide, W. (1999) Genetic relationships (RAPD-PCR) between geographically separated
    populations of the “cosmopolitan” interstitial polychaete Hesionides gohari (Hesionidae) and the evolutionary
    origin of the freshwater species Hesionides riegerorum. Biological Bulletin, 196, 216–226.
Soosten, C., von Schmidt, H. & Westheide, W. (1998) Genetic variability and relationships among geographically
    widely separated populations of Petitia amphophthalma (Polychaeta: Syllidae). Results from RAPD-PCR
    investigations. Marine Biology, 3, 659–669.
STRI (2008) The Environmental Science Program (ESP): Remote sea temperature downloads. Available from
    http://striweb.si.edu/esp/physical_monitoring/download_orts.htm (August 2005).
Vovelle, (1965) Le tube de Sabellaria alveolata (L) Annélide polychaète et son ciment. Étude Écologique,
    expèrimental, histologique et histoquimique. Archives de Zoologie Expérimentale et Générale, 106, 1–187.
Wardlaw, A.C. (2001) Practical statistics for experimental biologist (2nd edition). John Wiley & Sons Ltd,
    Chichester, UK. 249 pp.
Wilson, D.P. (1929) The larvae of the British sabellarians. Journal of Marine Biological Association of the United
    Kingdom, 16, 221–269.
Wilson, D.P. (1968) The settlement behaviour of the larvae of Sabellaria alveolata (L). Journal of Marine
    Biological Association of the United Kingdom, 48, 387–435.


DISTRIBUTION AND POPULATION ANALYSIS OF TEP SABELLARIIDS                  Zoosymposia 2 © 2009 Magnolia Press ·   503

Contenu connexe

Similaire à Barrios et al 2009

Crab invasion 47507813
Crab invasion 47507813Crab invasion 47507813
Crab invasion 47507813Mickey Clayton
 
Amelia Earhart On Nikumaroro A Summary Of The Evidence
Amelia Earhart On Nikumaroro  A Summary Of The EvidenceAmelia Earhart On Nikumaroro  A Summary Of The Evidence
Amelia Earhart On Nikumaroro A Summary Of The EvidenceLeonard Goudy
 
THE PHOENIX ISLANDS: AN ANNOTATED CHRONOLOGY
THE PHOENIX ISLANDS: AN ANNOTATED CHRONOLOGYTHE PHOENIX ISLANDS: AN ANNOTATED CHRONOLOGY
THE PHOENIX ISLANDS: AN ANNOTATED CHRONOLOGYDr Ian Ellis-Jones
 
california-maritime-archaeology-a-san-clemente-island-perspective
 california-maritime-archaeology-a-san-clemente-island-perspective california-maritime-archaeology-a-san-clemente-island-perspective
california-maritime-archaeology-a-san-clemente-island-perspectiveJason Gardner
 
New Smyrna Sea Turtles 1986
New Smyrna Sea Turtles 1986New Smyrna Sea Turtles 1986
New Smyrna Sea Turtles 1986vzt00
 
Galapagos 12:10:14
 Galapagos 12:10:14 Galapagos 12:10:14
Galapagos 12:10:14DAN RIVERA
 
guía rápida de líquenes de las islas galapagos
guía rápida de líquenes de las islas galapagosguía rápida de líquenes de las islas galapagos
guía rápida de líquenes de las islas galapagoswilliam tito nina
 
The natural setting and it's people - Social Studies
The natural setting and it's people - Social StudiesThe natural setting and it's people - Social Studies
The natural setting and it's people - Social StudiesMarkhill Tiosan
 
Charo et al 2020 sbe meeting 2020 final2
Charo et al 2020   sbe meeting 2020 final2Charo et al 2020   sbe meeting 2020 final2
Charo et al 2020 sbe meeting 2020 final2MelisaCharo
 
Canary island and classical culture
Canary island and classical cultureCanary island and classical culture
Canary island and classical culturejpermarm
 
modern diving gear and outboard motors
modern diving gear and outboard motorsmodern diving gear and outboard motors
modern diving gear and outboard motorstrickynurse9685
 
Troubled waters
Troubled watersTroubled waters
Troubled waterstroubled3c
 
Fish scavenging behaviour in recently trawled areas
Fish scavenging behaviour in recently trawled areasFish scavenging behaviour in recently trawled areas
Fish scavenging behaviour in recently trawled areasratupura
 
Radiocarbon Dating 0
Radiocarbon  Dating 0Radiocarbon  Dating 0
Radiocarbon Dating 0lianadesoto
 
thenaturalsettinganditspeople-140831192642-phpapp01 (1).pdf
thenaturalsettinganditspeople-140831192642-phpapp01 (1).pdfthenaturalsettinganditspeople-140831192642-phpapp01 (1).pdf
thenaturalsettinganditspeople-140831192642-phpapp01 (1).pdfMiraCuevas2
 
Origin and distribution of breadfruit
Origin and distribution of breadfruitOrigin and distribution of breadfruit
Origin and distribution of breadfruitNawsheen Hosenally
 

Similaire à Barrios et al 2009 (20)

Crab invasion 47507813
Crab invasion 47507813Crab invasion 47507813
Crab invasion 47507813
 
Enchanted islands
Enchanted islandsEnchanted islands
Enchanted islands
 
Amelia Earhart On Nikumaroro A Summary Of The Evidence
Amelia Earhart On Nikumaroro  A Summary Of The EvidenceAmelia Earhart On Nikumaroro  A Summary Of The Evidence
Amelia Earhart On Nikumaroro A Summary Of The Evidence
 
THE PHOENIX ISLANDS: AN ANNOTATED CHRONOLOGY
THE PHOENIX ISLANDS: AN ANNOTATED CHRONOLOGYTHE PHOENIX ISLANDS: AN ANNOTATED CHRONOLOGY
THE PHOENIX ISLANDS: AN ANNOTATED CHRONOLOGY
 
Conch Poster
Conch Poster Conch Poster
Conch Poster
 
california-maritime-archaeology-a-san-clemente-island-perspective
 california-maritime-archaeology-a-san-clemente-island-perspective california-maritime-archaeology-a-san-clemente-island-perspective
california-maritime-archaeology-a-san-clemente-island-perspective
 
New Smyrna Sea Turtles 1986
New Smyrna Sea Turtles 1986New Smyrna Sea Turtles 1986
New Smyrna Sea Turtles 1986
 
Galapagos 12:10:14
 Galapagos 12:10:14 Galapagos 12:10:14
Galapagos 12:10:14
 
guía rápida de líquenes de las islas galapagos
guía rápida de líquenes de las islas galapagosguía rápida de líquenes de las islas galapagos
guía rápida de líquenes de las islas galapagos
 
The natural setting and it's people - Social Studies
The natural setting and it's people - Social StudiesThe natural setting and it's people - Social Studies
The natural setting and it's people - Social Studies
 
Charo et al 2020 sbe meeting 2020 final2
Charo et al 2020   sbe meeting 2020 final2Charo et al 2020   sbe meeting 2020 final2
Charo et al 2020 sbe meeting 2020 final2
 
Canary island and classical culture
Canary island and classical cultureCanary island and classical culture
Canary island and classical culture
 
modern diving gear and outboard motors
modern diving gear and outboard motorsmodern diving gear and outboard motors
modern diving gear and outboard motors
 
Troubled waters
Troubled watersTroubled waters
Troubled waters
 
Fish scavenging behaviour in recently trawled areas
Fish scavenging behaviour in recently trawled areasFish scavenging behaviour in recently trawled areas
Fish scavenging behaviour in recently trawled areas
 
3 history of oceanography
3 history of oceanography3 history of oceanography
3 history of oceanography
 
Radiocarbon Dating 0
Radiocarbon  Dating 0Radiocarbon  Dating 0
Radiocarbon Dating 0
 
thenaturalsettinganditspeople-140831192642-phpapp01 (1).pdf
thenaturalsettinganditspeople-140831192642-phpapp01 (1).pdfthenaturalsettinganditspeople-140831192642-phpapp01 (1).pdf
thenaturalsettinganditspeople-140831192642-phpapp01 (1).pdf
 
Origin and distribution of breadfruit
Origin and distribution of breadfruitOrigin and distribution of breadfruit
Origin and distribution of breadfruit
 
The Bahamas
The BahamasThe Bahamas
The Bahamas
 

Dernier

Benefits Of Flutter Compared To Other Frameworks
Benefits Of Flutter Compared To Other FrameworksBenefits Of Flutter Compared To Other Frameworks
Benefits Of Flutter Compared To Other FrameworksSoftradix Technologies
 
Tech-Forward - Achieving Business Readiness For Copilot in Microsoft 365
Tech-Forward - Achieving Business Readiness For Copilot in Microsoft 365Tech-Forward - Achieving Business Readiness For Copilot in Microsoft 365
Tech-Forward - Achieving Business Readiness For Copilot in Microsoft 3652toLead Limited
 
04-2024-HHUG-Sales-and-Marketing-Alignment.pptx
04-2024-HHUG-Sales-and-Marketing-Alignment.pptx04-2024-HHUG-Sales-and-Marketing-Alignment.pptx
04-2024-HHUG-Sales-and-Marketing-Alignment.pptxHampshireHUG
 
Beyond Boundaries: Leveraging No-Code Solutions for Industry Innovation
Beyond Boundaries: Leveraging No-Code Solutions for Industry InnovationBeyond Boundaries: Leveraging No-Code Solutions for Industry Innovation
Beyond Boundaries: Leveraging No-Code Solutions for Industry InnovationSafe Software
 
Scaling API-first – The story of a global engineering organization
Scaling API-first – The story of a global engineering organizationScaling API-first – The story of a global engineering organization
Scaling API-first – The story of a global engineering organizationRadu Cotescu
 
08448380779 Call Girls In Greater Kailash - I Women Seeking Men
08448380779 Call Girls In Greater Kailash - I Women Seeking Men08448380779 Call Girls In Greater Kailash - I Women Seeking Men
08448380779 Call Girls In Greater Kailash - I Women Seeking MenDelhi Call girls
 
Breaking the Kubernetes Kill Chain: Host Path Mount
Breaking the Kubernetes Kill Chain: Host Path MountBreaking the Kubernetes Kill Chain: Host Path Mount
Breaking the Kubernetes Kill Chain: Host Path MountPuma Security, LLC
 
WhatsApp 9892124323 ✓Call Girls In Kalyan ( Mumbai ) secure service
WhatsApp 9892124323 ✓Call Girls In Kalyan ( Mumbai ) secure serviceWhatsApp 9892124323 ✓Call Girls In Kalyan ( Mumbai ) secure service
WhatsApp 9892124323 ✓Call Girls In Kalyan ( Mumbai ) secure servicePooja Nehwal
 
Automating Business Process via MuleSoft Composer | Bangalore MuleSoft Meetup...
Automating Business Process via MuleSoft Composer | Bangalore MuleSoft Meetup...Automating Business Process via MuleSoft Composer | Bangalore MuleSoft Meetup...
Automating Business Process via MuleSoft Composer | Bangalore MuleSoft Meetup...shyamraj55
 
Slack Application Development 101 Slides
Slack Application Development 101 SlidesSlack Application Development 101 Slides
Slack Application Development 101 Slidespraypatel2
 
[2024]Digital Global Overview Report 2024 Meltwater.pdf
[2024]Digital Global Overview Report 2024 Meltwater.pdf[2024]Digital Global Overview Report 2024 Meltwater.pdf
[2024]Digital Global Overview Report 2024 Meltwater.pdfhans926745
 
The Codex of Business Writing Software for Real-World Solutions 2.pptx
The Codex of Business Writing Software for Real-World Solutions 2.pptxThe Codex of Business Writing Software for Real-World Solutions 2.pptx
The Codex of Business Writing Software for Real-World Solutions 2.pptxMalak Abu Hammad
 
GenCyber Cyber Security Day Presentation
GenCyber Cyber Security Day PresentationGenCyber Cyber Security Day Presentation
GenCyber Cyber Security Day PresentationMichael W. Hawkins
 
Pigging Solutions in Pet Food Manufacturing
Pigging Solutions in Pet Food ManufacturingPigging Solutions in Pet Food Manufacturing
Pigging Solutions in Pet Food ManufacturingPigging Solutions
 
My Hashitalk Indonesia April 2024 Presentation
My Hashitalk Indonesia April 2024 PresentationMy Hashitalk Indonesia April 2024 Presentation
My Hashitalk Indonesia April 2024 PresentationRidwan Fadjar
 
A Domino Admins Adventures (Engage 2024)
A Domino Admins Adventures (Engage 2024)A Domino Admins Adventures (Engage 2024)
A Domino Admins Adventures (Engage 2024)Gabriella Davis
 
AI as an Interface for Commercial Buildings
AI as an Interface for Commercial BuildingsAI as an Interface for Commercial Buildings
AI as an Interface for Commercial BuildingsMemoori
 
Understanding the Laravel MVC Architecture
Understanding the Laravel MVC ArchitectureUnderstanding the Laravel MVC Architecture
Understanding the Laravel MVC ArchitecturePixlogix Infotech
 
The 7 Things I Know About Cyber Security After 25 Years | April 2024
The 7 Things I Know About Cyber Security After 25 Years | April 2024The 7 Things I Know About Cyber Security After 25 Years | April 2024
The 7 Things I Know About Cyber Security After 25 Years | April 2024Rafal Los
 
Factors to Consider When Choosing Accounts Payable Services Providers.pptx
Factors to Consider When Choosing Accounts Payable Services Providers.pptxFactors to Consider When Choosing Accounts Payable Services Providers.pptx
Factors to Consider When Choosing Accounts Payable Services Providers.pptxKatpro Technologies
 

Dernier (20)

Benefits Of Flutter Compared To Other Frameworks
Benefits Of Flutter Compared To Other FrameworksBenefits Of Flutter Compared To Other Frameworks
Benefits Of Flutter Compared To Other Frameworks
 
Tech-Forward - Achieving Business Readiness For Copilot in Microsoft 365
Tech-Forward - Achieving Business Readiness For Copilot in Microsoft 365Tech-Forward - Achieving Business Readiness For Copilot in Microsoft 365
Tech-Forward - Achieving Business Readiness For Copilot in Microsoft 365
 
04-2024-HHUG-Sales-and-Marketing-Alignment.pptx
04-2024-HHUG-Sales-and-Marketing-Alignment.pptx04-2024-HHUG-Sales-and-Marketing-Alignment.pptx
04-2024-HHUG-Sales-and-Marketing-Alignment.pptx
 
Beyond Boundaries: Leveraging No-Code Solutions for Industry Innovation
Beyond Boundaries: Leveraging No-Code Solutions for Industry InnovationBeyond Boundaries: Leveraging No-Code Solutions for Industry Innovation
Beyond Boundaries: Leveraging No-Code Solutions for Industry Innovation
 
Scaling API-first – The story of a global engineering organization
Scaling API-first – The story of a global engineering organizationScaling API-first – The story of a global engineering organization
Scaling API-first – The story of a global engineering organization
 
08448380779 Call Girls In Greater Kailash - I Women Seeking Men
08448380779 Call Girls In Greater Kailash - I Women Seeking Men08448380779 Call Girls In Greater Kailash - I Women Seeking Men
08448380779 Call Girls In Greater Kailash - I Women Seeking Men
 
Breaking the Kubernetes Kill Chain: Host Path Mount
Breaking the Kubernetes Kill Chain: Host Path MountBreaking the Kubernetes Kill Chain: Host Path Mount
Breaking the Kubernetes Kill Chain: Host Path Mount
 
WhatsApp 9892124323 ✓Call Girls In Kalyan ( Mumbai ) secure service
WhatsApp 9892124323 ✓Call Girls In Kalyan ( Mumbai ) secure serviceWhatsApp 9892124323 ✓Call Girls In Kalyan ( Mumbai ) secure service
WhatsApp 9892124323 ✓Call Girls In Kalyan ( Mumbai ) secure service
 
Automating Business Process via MuleSoft Composer | Bangalore MuleSoft Meetup...
Automating Business Process via MuleSoft Composer | Bangalore MuleSoft Meetup...Automating Business Process via MuleSoft Composer | Bangalore MuleSoft Meetup...
Automating Business Process via MuleSoft Composer | Bangalore MuleSoft Meetup...
 
Slack Application Development 101 Slides
Slack Application Development 101 SlidesSlack Application Development 101 Slides
Slack Application Development 101 Slides
 
[2024]Digital Global Overview Report 2024 Meltwater.pdf
[2024]Digital Global Overview Report 2024 Meltwater.pdf[2024]Digital Global Overview Report 2024 Meltwater.pdf
[2024]Digital Global Overview Report 2024 Meltwater.pdf
 
The Codex of Business Writing Software for Real-World Solutions 2.pptx
The Codex of Business Writing Software for Real-World Solutions 2.pptxThe Codex of Business Writing Software for Real-World Solutions 2.pptx
The Codex of Business Writing Software for Real-World Solutions 2.pptx
 
GenCyber Cyber Security Day Presentation
GenCyber Cyber Security Day PresentationGenCyber Cyber Security Day Presentation
GenCyber Cyber Security Day Presentation
 
Pigging Solutions in Pet Food Manufacturing
Pigging Solutions in Pet Food ManufacturingPigging Solutions in Pet Food Manufacturing
Pigging Solutions in Pet Food Manufacturing
 
My Hashitalk Indonesia April 2024 Presentation
My Hashitalk Indonesia April 2024 PresentationMy Hashitalk Indonesia April 2024 Presentation
My Hashitalk Indonesia April 2024 Presentation
 
A Domino Admins Adventures (Engage 2024)
A Domino Admins Adventures (Engage 2024)A Domino Admins Adventures (Engage 2024)
A Domino Admins Adventures (Engage 2024)
 
AI as an Interface for Commercial Buildings
AI as an Interface for Commercial BuildingsAI as an Interface for Commercial Buildings
AI as an Interface for Commercial Buildings
 
Understanding the Laravel MVC Architecture
Understanding the Laravel MVC ArchitectureUnderstanding the Laravel MVC Architecture
Understanding the Laravel MVC Architecture
 
The 7 Things I Know About Cyber Security After 25 Years | April 2024
The 7 Things I Know About Cyber Security After 25 Years | April 2024The 7 Things I Know About Cyber Security After 25 Years | April 2024
The 7 Things I Know About Cyber Security After 25 Years | April 2024
 
Factors to Consider When Choosing Accounts Payable Services Providers.pptx
Factors to Consider When Choosing Accounts Payable Services Providers.pptxFactors to Consider When Choosing Accounts Payable Services Providers.pptx
Factors to Consider When Choosing Accounts Payable Services Providers.pptx
 

Barrios et al 2009

  • 1. Zoosymposia 2: 487–503 (2009) ISSN 1178-9905 (print edition) www.mapress.com / zoosymposia / ZOOSYMPOSIA Copyright © 2009 · Magnolia Press ISSN 1178-9913 (online edition) Distribution of Idanthyrsus cretus (Polychaeta: Sabellariidae) in the Tropical Eastern Pacific and application of PCR-RAPD for population analysis L. M. BARRIOS1,4, S. J. CHAMBERS2, N. ISMAIL1, H.M. GUZMAN3 & J. M. MAIR1 1 School of Life Sciences, Centre for Marine Biodiversity and Biotechnology, Heriot-Watt University, Edinburgh, EH14 4AS, UK. E-mail: j.m.mair@hw.ac.uk 2 National Museums of Scotland, Edinburgh, EH1 1JF, UK. E-mail s.chambers@nms.ac.uk 3 Smithsonian Tropical Research Institute, PO Box 0843-03092, Balboa, Ancon, Republic of Panama. E-mail: guzmanh@si.edu 4 Corresponding author Abstract Sabellariid polychaetes, commonly known as honeycomb worms, are capable of forming large reef-like aggregations. One species, Idanthyrsus cretus, has recently been found in several localities during surveys of Las Perlas Archipelago, Pacific Panama. Large reefs of this species have not been recorded elsewhere in the Tropical Eastern Pacific. The reef distribution patterns were examined and mapped with the aid of Geographical Information Systems. Principal Component Analysis showed that the distribution of polychaete reefs in Las Perlas Archipelago and the reef building itself seem to be mainly dependent on depth, suitable substrate, and topography, the potential particle size for tube building, and wave exposure. Cluster analysis of Random Amplified Polymorphic DNA with Polymerase Chain Reaction molecular techniques demonstrated that the polychaete reefs in Las Perlas Archipelago may be derived from one population. Key words: Polychaeta, Sabellariidae, distribution patterns, Tropical Eastern Pacific, population analysis, molecular techniques Introduction Sabellariid polychaetes, commonly known as honeycomb worms, form large reef-like aggregations in many parts of the world, including the Tropical Eastern Pacific (TEP). Since the first records in 1904 (Chamberlain 1919), many specimens of Idanthyrsus cretus have been collected from the Pacific coast of Colombia (Hartman 1940), Costa Rica (Hartman 1944), the Galapagos Islands (Hartman 1944; Kirtley 1994), Ecuador (Hartman 1944), and other localities in Panama (Monro 1933; Fauchald 1977; Kirtley 1994). These sites are all in the surf zone (Fig. 1) where the cool (18º– 22ºC) Peru Current (PC) initially joins the warmer South Equatorial Current (SEC), and then moves westward toward the equator. The PC and the trade winds from the NE produce a coastal upwelling that brings nutrient-rich sea water (Glynn & Mate 1997). The turbidity is caused, therefore, by high nutrient waters that promote the phytoplankton blooms during the dry season (upwelling) and by the sediments released (siltation) with freshwater discharges from rivers due to erosion of adjacent land masses during the wet season (Macintyre et al. 1992, D´Croz & Robertson 1997). Accepted by N. Maciolek: 2 May 2009; published: 31 Aug. 2009 487
  • 2. FIGURE 1. The Tropical Eastern Pacific and the study area, the Las Perlas Archipelago. CC: California Current, NEC: North Equatorial Current, NECC: North Equatorial countercurrent, SEC: South Equatorial Current, PC: Peru Current. Modified from Glynn and Mate (1997) and REEF (2004). Nearly all previously recorded sabellariids from the TEP were incorrectly identified as Idanthyrsus pennatus Peters, 1854 or Idanthyrsus armatus Kinberg, 1867. Idanthyrsus cretus Chamberlain, 1919 was first described from Taboguilla Island (Pacific coast of Panama) and also recorded as Idanthyrsus regalis Chamberlain, 1919 from the Galapagos Islands. The two species were synonymized by Kirtley (1994) as I. cretus. In that revision of the Sabellariidae, many records were reidentified and described as new species (Kirtley 1994). Sabellariid distribution is constrained by the availability of stable substrates for the settlement of immature stages and sedentary adult stages (Kirtley 1994). There has been extensive work on Sabellaria alveolata Linnaeus, 1767 larvae from British waters. For this species it has been demonstrated that the larvae require gentle water movement and more importantly the presence of other newly settled larvae or other living or dead adults to induce settlement (Wilson 1968). All sabellariids are filter feeders and need a constant food supply, high levels of dissolved oxygen, and suspended sediments or shell fragments for tube building (Wilson 1929; Volvelle 1965). Specimens usually occur in the surf zone in water depths less than 10 m, although a few species such as Gesaia sp. and Phalacrostemma sp. are known from deep waters (Kirtley 1994). For most Sabellariids there is minimal information relating to depth, temperature, salinity, distribution patterns, reproduction, life stages, microhabitats, associated fauna, and associated habitat details. All published records for I. cretus (Table 1) are descriptions of single tubes associated with coral reef environments (e.g., Costa Rica and Colombia) or rocky areas in low- to mid-shore or tide pools (e.g., Panama, Ecuador, Galapagos); however, no sabellariid reefs have been recorded in any of these areas. The Panamanian TEP (see Fig. 1) is a very productive area due to the existence of upwelling (D’Croz et al. 2003). This upwelling leads to shallow thermoclines and enrichment of the coastal and nearshore waters. However, a remarkable characteristic of the TEP is that concentrations of surface nutrients continuously remain high and appear never to be completely depleted despite the high phytoplankton productivity (Agujetas-Medrano 2004). There is also high turbidity that results in low biodiversity in some taxonomic groups like corals (Glynn & Mate 1997; D’Croz & Robertson 1997; 488 · Zoosymposia 2 © 2009 Magnolia Press BARRIOS ET AL.
  • 3. Diaz et al. 2000) in contrast with the Tropical Western Pacific (Glynn 2001). The upwelling occurs each year during the dry season that lasts from January to April (D’Croz et al. 2001), with the coldest period in March (average 20ºC) and the warmest period (average 28ºC) between May and July (D’Croz & Robertson 1997; D’Croz & O’Dea 2007). TABLE 1. Distribution of Idanthyrsus cretus in the Tropical Eastern Pacific and main habitat details. Original Kirtley (1994) Locality Habitat details Reference identification identification Panama, Isla Taboguilla I. cretus I. cretus 1.8 m, coral. Chamberlain (holotype) 1919: 485 Panama, Taboga Island I. pennatus I. cretus Hotel Pier Monro 1933: 1065 Panama, Gorgona Island I. pennatus I. cretus From coral at low tide and Monro 1933: at 1 fth, in tubes or solitary 1065 Panama, Gorgona Island, I. pennatus I. cretus All low to mid shore. Fauchald Taboga Island (Monro’s 1977: 54 specimen) Panama, Pinas Bay, Secas I. pennatus I. cretus 3.6–7.3 m tubes Hartman 1944: Island, Coiba Island overgrown with coral, 336 RV Velero Panama, Pedro Gonzales I. pennatus Kirtley 1994: Island, Islas Perlas 95 Galapagos, Floreana, Tagos Idanthyrsus sp? I. cretus Shore and tide pool Kirtley 1994: Cove, Chatham Island, 95 Sullivan Bay James Island Velero exp from Mexico to I . pennatus I. cretus Shore to 6 m Hartman 1944: Ecuador I. armatus 336, 131 Colombia, Puerto Utria, I. pennatus I. cretus Outer island, shore, on Hartman 1944: reefs, Octavia Bay Pocillopora coral. All 336 shallow to 10–11 m coarse RV Velero sand and gravel Costa Rica, Playa Blanca, I. pennatus I. cretus on Poronia coral Hartman 1944: Viradores Islands, Puerto 336 Culebra RV Velero Ecuador, Punta Santa Elena, I. pennatus I. cretus tide pool Hartman 1944: coll. Waldo Schmitt 336 RV Velero Galapagos, Gardner Bay I. pennatus I. cretus shore Hartman 1944: Hood Is, Flamingo Bay 336 Charles Island, Albemarle Sound, Duncan Island, RV Velero Darwin Bay Tower Island, Sullivan Bay James Island Galapagos I. regalis I. cretus Chatham Island Chamberlain (holotype) 1919: 487 DISTRIBUTION AND POPULATION ANALYSIS OF TEP SABELLARIIDS Zoosymposia 2 © 2009 Magnolia Press · 489
  • 4. The aim of the present study was to document distribution patterns for Idanthyrsus cretus in the TEP in relation to physical data. The analysis of the population data of the Las Perlas colonies included a molecular approach by using cluster analysis of Random Amplified Polymorphic DNA with Polymerase Chain Reaction (PCR-RAPD) techniques to investigate possible genetic links and geographic origins. Materials and methods Field survey (the polychaete reef environment). Las Perlas Archipelago is an area to the SE of Panama Bay (8o14'00'' to 8o39'00'' N/ 78o50'00'' to 79o06'36'' W) and consists of one large, two or three medium, and several small islands (Fig. 2). Basic ecological information (e.g., polychaete reef distribution, associated fauna), collected between August 2004 and May 2005, was obtained from six stations in 2–6 m water depth relative to low tide. Stations 60, 62, 63, 66, and 68 correspond to a sand habitat and station 29 corresponds to a coral reef habitat (Benfield 2005; Barrios 2007). The six stations were selected for detailed study based on data collected during several surveys in the area in 2003 and 2004 (Benfield 2005). Station 66, with the largest reef, was subdivided into seven stations, resulting in a total of 12 stations. FIGURE 2. Field site: Las Perlas Archipelago. Circles in yellow are the six stations where samples and data were collected. Circles in orange are the stations for sediments (22, 23, 36, 61, 62, 77, 78). Courtesy of Sarah Benfield database (Benfield 2005). At each station, at least 10 organisms were removed by cutting off a section of the tube aggregate (blocks of sand tubes), except at station 29 where only two organisms were collected (they were found individually as part of a reef environment and not as tube aggregates). The samples were fixed in 10% formalin, preserved in 74% alcohol, identified, and deposited at the National Museums of Scotland (Register Number NMSZ.2006.073). Samples fixed and preserved in 96% ethanol were analyzed with molecular techniques to determine their population origin. All species associated with the sections of polychaete reef removed from each station were identified to phylum level. 490 · Zoosymposia 2 © 2009 Magnolia Press BARRIOS ET AL.
  • 5. Information on the density and dimensions of the polychaete reef (to identify polychaete reef structure) and on the surrounding environment (sediment type, type of benthic community, distribution of the species and percent cover in coral reef environments) was also collected by conducting 30-minute visual surveys. At the largest reef (station 66, San Telmo), one length and three width measurements were recorded. One single width and one single length were recorded in smaller aggregates. Density was measured in the larger reef with 1-m2 quadrats (a total of six quadrats) subdivided into squares of 10 x 10 cm. No measures of density were taken in the smaller reefs as they appeared to have the same development pattern observed in the largest reef. Substrate information collected during the 2003 and 2004 surveys (Benfield 2005) related to coral reefs (e.g., percent cover of benthic organisms, visibility, topography) was used to describe habitats surrounding the polychaete reefs in San Telmo (station 66) and Isla del Rey (stations 60, 62, 63, 68), and as part of the environmental information for statistical analysis. Sea Surface Temperature–SST and salinity records collected at the Smithsonian Tropical Research Institute– STRI were used for comparison with the data collected during the field surveys. Sediment information collected during the 2003 and 2004 surveys (Benfield 2005) related to percent sediment composition (gravel, very coarse sand, coarse sand, medium sand, fine sand, very fine sand, silt+clay) near the polychaete reef stations (see Fig. 2, stations 22, 23, 36, 61, 62, 77, 78) was used as part of the environmental information for statistical analysis (Table 2). TABLE 2. Type of sediments in areas around the stations (values for sediment particle sizes in percentage, %). Grade limits ( m) in Wentworth grade classification: Gravel (4000–2000), Very Coarse Sand (2000–1000), Coarse μ Sand (1000–500), Medium Sand (500–250), Fine Sand (250–125), Very Fine Sand (125–62), Silt+Clay (<62). Nearest Station Very Very polychaete for Sediment Coarse Coarse Medium Fine Fine Silt station sediments type Gravel Sand Sand Sand Sand Sand +Clay 66 22 sand 4.6 17.4 24.9 39.5 13.0 0.2 0.5 68,60,62,63 23 sand + 1.3 1.1 1.0 4.2 58.4 22.6 11.5 shells 68,60,62,63 36 mud + 4.1 1.6 1.3 1.7 13.0 60.5 17.8 sand 29 61 mud 0.0 0.2 0.1 0.0 8.7 36.3 54.7 29 62 mud 0.2 0.0 0.3 0.9 7.3 38.3 52.9 29 77 mud 0.6 0.2 0.1 0.3 1.1 17.9 79.9 29 78 mud 0.5 1.0 0.6 0.2 1.1 10.3 86.2 Material examined for confirmation of the species. The holotypes of Idanthyrsus cretus Chamberlain, 1919 from Taboguilla Island, Panama Bay (USNM 19716), I. regalis Chamberlain, 1919 collected 1 September 1905 from Galapagos Islands (USNM 19383), specimens identified as I. pennatus by Monro (1933) from Taboga Island, Panama Bay (NHM.1933.7.10.192-196) and Gorgona Island, Colombia (NHM. 1933.7.10.182-19), and five representative specimens from 50 complete polychaete collected August 2004 in San Telmo Island, Las Perlas Archipelago (NMSZ 2006.073) were examined. Molecular analysis. The molecular analysis was carried out at the Center for Marine Biodiversity and Biotechnology, Heriot-Watt University. Samples of I. cretus were collected from all 12 stations, for a total of 46 samples, and prepared for DNA extraction (QIAGEN 2006). The final solutions were kept in a freezer at -20°C. DISTRIBUTION AND POPULATION ANALYSIS OF TEP SABELLARIIDS Zoosymposia 2 © 2009 Magnolia Press · 491
  • 6. PCR-RAPD protocols, as described by Soosten et al. (1998) and Schmidt & Westheide (1999), were used with minor modifications for DNA amplification of the 46 samples. From the original protocols a total of 17 decamer primers OPB (www.mwg-biotech.com, Germany) with a GC-content between 60 and 70% (Table 3) were applied. The reaction volume of 25 μl was composed of 12.5 μl of 2 x biomix buffer (Bioline), 0.25 μl of mwg primer, 1 μl DNA, and 11.25 μl DH2O (MiliQ). Controls were run changing the concentration of DNA for DH2O. During amplification, one main thermocycler was used (BIORAD, Hercules, California). Forty-five cycles were employed (modified from Soosten et al. 1998), each comprising: • Step 1: 94˚C/4 min (1 cycle) • Step 2: 94˚C/1 min for denaturation, 34˚C/1 min for annealing, and 72˚C/30 sec for elongation (fastest available transition between temperatures), (45 cycles) • Step 3: 72˚C/10 min (1 cycle), • Step 4: endless file at 4˚C/ ∞ TABLE 3. Decamer primers (www.mwg-biotech.com, Germany) and their Guanine-Cysteine (GC) content. PRIMER SEQUENCE 5 -3 ′ ′ GC content (%) OPB-1 GTTTCGCTCC 60 OPB-2 TGATCCCTGG 60 OPB-3 CATCCCCCTG 70 OPB-4 GGACTGGAGT 60 OPB-5 TGCGCCCTTC 70 OPB-6 TGCTCTGCCC 70 OPB-7 GGTGACGCAG 70 OPB-8 GTCCACACGC 70 OPB-10 CTGCTGGGAC 70 OPB-11 GTAGACCCGT 60 OPB-12 CCTTGACGCA 60 OPB-14 TCCGCTCTGG 70 OPB-15 GGAGGGTGTT 60 OPB-16 TTTGCCCGGA 60 OPB-17 AGGGAACGAG 60 OPB-18 CCACAGCAGT 60 OPB-19 ACCCCCGAAG 70 Amplified DNA fragments were separated with a gel loading dye (Fermentas Company) at 82 volts for 10 min followed by 90 volts at maximum 20–30 min (best running time for gels with eight pools was 25 minutes, until samples reached the middle). The ethidium bromide stain was visualized and documented under UV light. In order to optimize the best running time for the primer screening, bigger gels (16 pools in one line, 1% agarose, SCIEPLAS Company, www.scieplas.co.uk) were run for a maximum of 2.5 h (82 volts for 10 min, followed by 90 volts), with images recorded at 1.5 h, 2 h and 2.5 h (best running time for gels with 16 pools was 2 h). A set of 10,000BP, 1,000BP, and 100BP ladders (Fermentas Company) was used for length comparison during the whole procedure. The results were run in a gel of 1% agarose (TAE 1X). 492 · Zoosymposia 2 © 2009 Magnolia Press BARRIOS ET AL.
  • 7. The reproducibility of the data was checked at regular intervals on different levels throughout parallel experiment lines, including potential differences in the amplification patterns that might be derived from the use of different thermocyclers (both thermocyclers were from the same company) as recommended in Soosten et al. (1998) (i.e., use two different thermocyclers to analyze a group of samples and their replicates, and use two different gels to run a same group of RAPD-PCR products that have been processed in the same thermocycler). For the primer screening, and in order to have the entire spectrum of possibilities, a combination of all 46 samples was used with the three primers, OPB-5, OPB-6, OPB-18, that gave the best results in the Soosten et al. (1998) and Schmidt & Westheide (1999) analyses. Three samples with the biggest polymorphism expression (largest number of bands) were then selected to compare with the other 14 primers (see Table 2). In each series, one reaction was carried out with a blind sample lacking DNA to check for contamination with foreign DNA. Statistical analysis. To identify the main environmental factors responsible for the I. cretus distribution observed at the Las Perlas Archipelago (differences between stations), Principal Component Analysis (PCA) was applied to the data using Minitab software (Wardlaw 2001). The variables included were: depth (meters); percent sediment composition (gravel, very coarse sand, coarse sand, medium sand, fine sand, very fine sand, silt+clay); wave exposure (1 = sheltered e.g., bay, 2 = low to moderate, 3 = moderate, 4 = moderate to high, 5 = high e.g., headland); visibility (meters); percent coral cover with respect to total hard bottom area; topography (1 = no vertical or very low vertical structure or complexity, 2 = low or with undulations from 0 to 0.5 m, 3 = moderate or with 0.5 to 1 m outcrops, some boulders, crevices and overhangs, 4 = high or with 1.5 to >2 m outcrops, many overhangs, crevices and boulders). Due to the fact that the variables were measured on different scales, a standardization (Standard Deviation) was performed before the analysis (correlation of the different variables). To identify possible genetic links between the organisms from each station and relate these links to a possible common geographic origin, regression and cluster analyses were applied to the results of the molecular analysis using specialized software. The detected amplification product patterns collected from the gels were examined with the GEL-COMPARE software to determine the number of stable bands in common or the number of monomorphic and polymorphic markers (Applied Maths BVBA 1998). In this case, an identification group of the taxonomic unit was created from the results of the gels, containing a collection of representative fingerprints, representing the variability within the group. The software then counted the relative frequency of occurrence for each individual band, assigning more weight to bands with a high occurrence frequency (typical bands). The main regression in each gel (group of bands in a particular gel vs. group of bands in the identification group) was based on the differences in concentration and distance of each band from the origin of the gel. A secondary regression was based on the differences in morphology and/or staining of the band groups vs. the identification group. Cluster analysis was carried out with UPGMA methods (unweighted pair-group method using arithmetic averages), based on the band information provided by the polymorphism analysis. For the analysis the recommended coefficients of similarity were applied (Pearson correlation coefficient for clusters on single gels and averages from experiments for clusters from combinations of gels). Results The polychaete reef environment Twelve reefs or aggregates of I. cretus were found during the 2003–2004 surveys (Benfield 2005). DISTRIBUTION AND POPULATION ANALYSIS OF TEP SABELLARIIDS Zoosymposia 2 © 2009 Magnolia Press · 493
  • 8. They were southeast (SE) of the Las Perlas Archipelago, specifically SE of Isla del Rey and north of San Telmo Island (see Fig. 2). During the 2004–2005 surveys it was evident that the area SE of Isla del Rey is characterized by uncolonized rock surrounded by sand bottoms, while the northern part of San Telmo Island is a coral community surrounded by sand bottoms. All reefs are exposed to strong currents and wave action from the SE Pacific (which is high in energy and suspended particulates). Five of the polychaete reefs in San Telmo and Isla del Rey were analyzed. Their depth range was 0–6 m and the top of the reef at San Telmo was exposed at low spring tides. The approximate size of the largest I. cretus reef (station 66) was 56 m2 (3.5 m average width x 16 m total length) and had an elongated shape parallel to the coast, but the other four reefs had a rounded shape with sizes between 2 and 4.5 m2. No reefs had been recorded on this scale before the survey done in 2003 and 2004 to collect information on the environments surrounding the archipelago. The San Pedro samples (station 29, two organisms) were found amongst corals as single tubes but did not form reefs. The average density of organisms in the largest I. cretus reef (station 66), was 72.2 organisms/10 cm , with a maximum of 116 and a minimum of 49/10 cm2. Observations from the field showed that 2 each individual captures food and fragments of rock and shells continuously with the oral filaments; these activities also appear to help in the production of the cylindrical tube. The species grows in aggregates and seems to have sexual and asexual reproduction within the aggregates. Observations of the aggregates, morphological descriptions of the external and internal parts of live and preserved organisms (Figs. 3, 4), and comparisons of these descriptions with those reported previously for another related species such as Sabellaria alveolata (Cazaux 1964; Volvelle 1965) indicated a sexual dimorphism in I. cretus as there were big dark tubes which could correspond to females, surrounded by smaller ivory tubes that could correspond to males (see Fig. 5). In the case of S. alveolata, the sexual dimorphism is expressed in females by pinkish purple sides and in males by whitish sides. The reefs also provide a habitat for a diverse fauna of sponges, cnidarians, other polychaetes, mollusks, crustaceans, echinoderms, and fish, with an average of seven different phyla per station (Table 4). The PCA of 12 variables (depth, % gravel, % very coarse sand, % coarse sand, % medium sand, % fine sand, % very fine sand, % silt+clay, wave exposure, visibility, coral cover, topography) showed that two main components are responsible for 100% of the polychaete reef distribution in Las Perlas Archipelago and the differences observed between the environments in which the polychaetes were found. The first principal component, PC1, has a variance (eigen value) of 6.419 and explains 53.5% of the distribution of the aggregations in the area. The second component, PC2, has a variance of 5.581 and explains the other 46.5% of the distribution. The results also demonstrate that PC1 is a combination of % gravel, wave exposure, and topography (and % silt+clay but in a smaller proportion and with a positive value), while PC2 is a combination of depth, fine and very fine sand in the area (as well as visibility and coral cover but in less proportion and with negative value) (Fig. 6). Material examined for confirmation of the species The holotype of Idanthyrsus cretus Chamberlain, 1919 from Taboguilla Island, Panama Bay (USNM 19716), measured 3 x 10 mm for 23 segments. The holotype of I. regalis Chamberlain, 1919 from Galapagos Islands (USNM 19383), measured 5 x 40 mm for 27 segments. The specimens identified as I. pennatus by Monro (1933) from Taboga Island, Panama Bay (NHM.1933.7.10.192-196) and Gorgona Island, Colombia (NHM. 1933.7.10.182-19) were all incomplete with no tail region; the specimen from Taboga measured 2 x 14 mm for 35 segments and the specimens from Gorgona 1 x 10 mm for 29 segments and 2 x 13 mm for 31 segments. From the 50 complete specimens collected during the August 2004 survey in the Las Perlas Archipelago (NMSZ 2006.073), 42 were used 494 · Zoosymposia 2 © 2009 Magnolia Press BARRIOS ET AL.
  • 9. partially for molecular purposes and five specimens were used for taxonomic confirmation purposes (see Figs. 3–4). The measurements for the five specimens were: 5 x 41 mm for 53 segments, 5 x 51 mm for 59 segments, 3 x 27 mm for 45 segments, 4 x 21 mm for 44 segments, and 4 x 23 mm for 45 segments. FIGURE 3. Ventral view of Idanthyrsus cretus (NMSZ 2006.73) from San Telmo Island. Organism removed from tube measured 41mm. DISTRIBUTION AND POPULATION ANALYSIS OF TEP SABELLARIIDS Zoosymposia 2 © 2009 Magnolia Press · 495
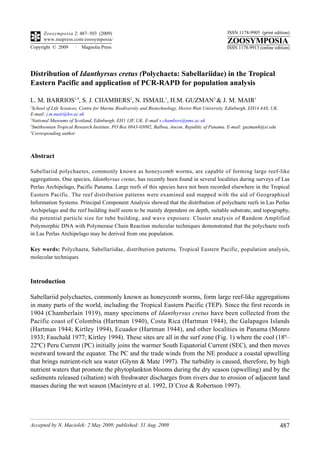
  • 10. FIGURE 4. Idanthyrsus cretus (NMSZ 2006.73) FIGURE 5. I. cretus section of reef from station 66 in from San Telmo Island. Section of tube with San Telmo Island. The arrows indicate the large female animal protruding. tubes surrounded by small male tubes. FIGURE 6. Principal Component Analysis for the first two components, which explain 100% of the polychaete distribution. 496 · Zoosymposia 2 © 2009 Magnolia Press BARRIOS ET AL.
  • 11. TABLE 4. Number of associated species/taxa (total organisms/taxa) in the Idanthyrsus cretus reef in San Telmo Island. Average species/station = 6.55. Total Total spp/ organisms/ Groups/Station 66.1 66.2 66.3 66.4 66.5 66.6 66.7 66.8 66.9 taxon taxon Porifera 1(1) 1 1 Cnidaria 1(1) 1(1) 2 2 Polychaeta 1(1) 1(1) 5(5) 7 7 Mollusca 1(2) 5(5) 1(1) 3(3) 10 11 Crustacea 7(14) 6(9) 1(1) 4(5) 3(4) 1(1) 3(9) 2(2) 27 45 Echinodermata 2(4) 4(14) 1(2) 1(1) 1(2) 1(1) 1(2) 11 26 Vertebrata 1 1 1 Total spp./station 12 17 2 7 8 1 2 7 3 Molecular analysis The primer screening with OPB-5, OPB-6, and OPB-18 (Fig. 7) demonstrated that Primer OPB-18 was more discriminating than OPB-6 and both revealed more bands or polymorphism than OPB-5. Each station presented a different band pattern when compared with the same primer. Station 68 had five bands with primer OPB-18, while station 66.1 had two bands and station 66.3 between six and seven bands. However, the last two stations from San Telmo (66.1 and 66.3) illustrated only slight variation in the bands. Samples 66.3.3 and 62.2, with the best polymorphism results (Table 5), were selected to run the complete primer screen with all 17 primers, and to identify the best primer for this species (Figs. 8–9). FIGURE 7. Results of primer screening with decamer primers OPB-5, OPB-6, OPB-18. Gel 1 (top left) is station 68 from SE Isla del Rey. Bottom left Station 66.1 in San Telmo Island. Gel 2 (right): station 66.3 in San Telmo Island. TABLE 5. Samples with the largest number of bands (polymorphism) from the analysis with the first three primers: OPB-5, OPB-6, OPB-18. NA: information not available. Station Replicate No. bands OPB-5 No. bands OPB-6 No. bands OPB-18 66.3 3 4 6 6-7 62 2 NA 3(+) 7 68 3 3 2(+) 5(+) 66.8 3 1 1 6 66.5 3 1(+) 1 3 66.4 4 NA NA 4 60 4 NA NA 4 DISTRIBUTION AND POPULATION ANALYSIS OF TEP SABELLARIIDS Zoosymposia 2 © 2009 Magnolia Press · 497
  • 12. FIGURE 8. Primer screen with the two selected samples (station 62, second replicate, station 66.3, third replicate). Left: gel (1% agarose, SCIEPLAS) after 2 hours of electrophoresis. Right: same gel after 2.5 hours. Pools 1 to 16 correspond to analysis with sample 62.2. Pools 17 to 32 correspond to analysis with sample 66.3.3. 1:OPB-1, 2:OPB-2, 3: OPB-3, 4: OPB-4, 5: OPB-6, 6:OPB-7, 7: OPB-8, 8: OPB-10, 9: ladder, 10: OPB-11, 11: OPB-12, 12: OPB-14, 13: OPB-15, 14: OPB-16, 15: OPB-17, 16: OPB-18, 17: OPB-19, 18: control, 19: OPB-1, 20: OPB-2, 21: OPB-3, 22: OPB-4, 23: OPB-6, 24: OPB-7, 25: ladder, 26: OPB-8, 27: OPB-10, 28: OPB-11, 29: OPB-12, 30: OPB-14, 31: OPB-15, 32:OPB-16. Circles highlight pools 6 and 7, 16, and 24 and 26 with the primers OPB-7, OPB-8, and OPB-18 respectively. FIGURE 9. Test of reproducibility. Analysis with all the primers and samples 66.3.3 and 62.2 confirm the results on previous gel (Fig. 8) with the same samples. In this second case OPB-18 (pools 4 and 28), OPB-7 (pools 11 and 20) and OPB-8 (pools 12 and 21) give the best results in terms of bands (polymorphism) and definition. Pools 29 to 32 confirm reproducibility when using different thermocyclers. Samples from pools 29 to 31 are RAPD-PCR products for OPB-18, the same primer and samples than in figure 8, but that were run in a second thermocycler. Pools 1 to 16 are analyses with samples from station 66.3 (third replicate). Pools 17 to 28 are analyses with samples from station 62 (second replicate). 1: control, 2: OPB-16, 3: OPB-17, 4: OPB-18, 5: OPB-19, 6: OPB-1, 7: OPB-3, 8: OPB-6, 9: ladder 100bp, 10: ladder 1kbp, 11: OPB-7, 12: OPB-8, 13: OPB-10, 14: OPB-11, 15: OPB-12, 16: OPB-13, 17: OPB-1, 18: OPB-3, 19: OPB-6, 20: OPB-7, 21: OPB-8, 22: OPB-10, 23: OPB-11, 24: OPB-12, 25: ladder 100bp, 26: ladder 1kbp, 27: OPB-17, 28: OPB-18, 29: St 68 with OPB-18, 30: St 66.3.3 with OPB-18, 31: St 66.1.3 with OPB-18, 32: St 66.9.2 with OPB-18. 498 · Zoosymposia 2 © 2009 Magnolia Press BARRIOS ET AL.
  • 13. The results of the complete primer screen and test of reproducibility (see circles in Figs. 8–9) showed that primers OPB-7, OPB-8, and OPB-18 gave the best polymorphism results and definition or sharpness of the bands, and therefore are the most suitable primers to analyze for this species. The analysis with all the primers and samples 66.3.3 and 62.2 (Fig. 9) confirmed the results on previous gels (Fig. 8) with the same samples. In this second case (see Fig. 9) OPB-18 (pools 4 and 28), OPB- 7 (pools 11 and 20), and OPB-8 (pools 12 and 21) gave the best results in terms of bands (polymorphism) and definition. Pools 29–32 were used to confirm reproducibility when using different thermocyclers. In this case, samples from pools 29–31 were RAPD-PCR products for OPB- 18, the same primer and samples as in figure 8, but run in a second thermocycler from the same company. Pools 1–16 were analyses with samples from station 66.3 (3rd replicate), while pools 17–28 were analyses with samples from station 62 (2nd replicate). Fifty (50) DNA fragments were detected with primer OPB-18 and 55 with primer OPB-7 by using band-matching analysis (software GELCOMPARE) for all the samples. The cluster analyses, run to identify levels of similarity between samples and between stations based on the degree of polymorphism of the samples, showed that there were no statistically significant differences between stations (Fig. 10). Higher similarity between samples belonging to different stations is shown in gel 4 (see Fig. 10). Here, the second sample from the San Telmo station 66.5 (sample 66.5.2, SE of the archipelago) is more related to the first sample from San Pedro station 29 (sample 29.1, NE of Isla del Rey) than to the other sample from San Telmo (sample 66.5.1). In the same way, sample 63.3 is more similar to sample 60.3 than to sample 63.4. The same pattern is evident in gels 1 and 3 (see Fig. 10, arrow for sample 66.5.2 in gel 1 and clustering of samples from station 66 in San Telmo). FIGURE 10. Cluster analysis based on the degree of polymorphism of the samples (similarity based on Pearson correlation coefficient and UPGMA dendrogram type for each gel) for samples run with primer OPB-7 (analysis for 41 of a total of 46 samples). Each dendrogram presents in each node the error flags and the co-phenetic correlations. DISTRIBUTION AND POPULATION ANALYSIS OF TEP SABELLARIIDS Zoosymposia 2 © 2009 Magnolia Press · 499
  • 14. Discussion The average density value of Idanthyrsus cretus forming the largest reef in the Las Perlas Archipelago (72.2 organisms/10 cm 2 ) was similar to that reported by Caline et al. (1988) for Sabellaria alveolata. The fauna associated with the I. cretus reefs indicated that these polychaete reefs provide, in the SE of Las Perlas Archipelago, a suitable habitat for a diverse fauna in a similar way to that provided by coral reefs in the NW of the archipelago. These assumptions are supported by general observations during the 2004–2005 surveys related to benthic composition in the archipelago (e.g., SE of the archipelago is characterized by uncolonized rock surrounded by sand bottoms while NW is mainly a coral community surrounded by sand bottoms) and by the results of Mair et al. (2009) in which the authors describe a similar grouping for benthic communities in the Las Perlas Archipelago, with a multiscale analysis that shows differences in the benthic communities between SE and NW with respect to species composition and abundance. Hendrick & Foster-Smith (2003), in a description of the Sabellaria spinulosa reefs in the UK, quote the official definition of “reef” for the European Union Habitats Directive as follows: “reefs are submarine or exposed at low tide, rocky substrates and biogenic concretions, which arise from the sea floor in the sublittoral zone but may extend into the littoral zone where there is an uninterrupted zonation of plant and animal communities. These reefs generally support a zonation of benthic communities of algae and animal species including concretions, encrustations and corallogenic concretions.” An animal community will use the physical and ecological habitat supplied by any type of reef in the area. In the case of Las Perlas these are coral reefs in the north and west, and sabellariid reefs to the south and east of the archipelago. Sea Surface Temperature (SST, Fig. 11) and salinity records (Fig. 12) collected by the Terrestrial and Environmental Science Programme, Smithsonian Tropical Research Institute-STRI illustrated the following: • An upwelling between January and April of each year that can be identified by a reduction in temperature and increase in salinity. The lowest temperatures are in March and the highest between May and July of each year. • The mean temperature for the last 15 years (1992–2005) was 26.63°C, but temperatures as low as 14.7°C (Saboga, 22/02/2001) and as high as 30°C (Saboga, 9/11/1997) have been recorded. • The mean salinity for the last 17 years (1990–2005) in Panama Bay was 30.18‰, but the records show salinities as low as 22‰ (21/10/1995) and as high as 44.8‰ (4/02/2005). FIGURE 11. Sea Surface Temperatures for Las Perlas Archipelago (1992–2005). Data sets were provided by the Smithsonian Tropical Research Institute (STRI 2008). 500 · Zoosymposia 2 © 2009 Magnolia Press BARRIOS ET AL.
  • 15. FIGURE 12. Salinity (in red) and temperature (blue and yellow) records for Panama Bay (1990–2005). Data sets were provided by the Smithsonian Tropical Research Institute (www.stri.org). The evidence in the records of this upwelling is a more detailed description of the effect of the Peru Current-PC and the South Equatorial Current-SEC in the area, and gives a better base to the assumptions of a southern origin to the actual larval settlement of sabellariid reefs in Las Perlas Archipelago. A particular aspect of the upwelling in Las Perlas Archipelago is that this phenomenon helps to keep continuous high nutrient and phytoplankton levels in the area (Agujetas-Medrano 2004), creating a high turbidity that causes a low intra-ecosystemic biodiversity for some groups like corals (Diaz et al. 2000). The combination of this low development of corals in the SE area of the archipelago (leading to low competition for colonization space), and the abundance of sediments and hydrodynamics may play a key role in the development of significantly-sized I. cretus reefs which are recorded in this study for the first time in the Tropical Easter Pacific. The ecological information (reef environment and general oceanographic conditions) and the PCA based on data from the five reefs in the SE of Las Perlas Archipelago, plus the two samples collected from a coral reef environment (station 29), confirm that reef building and the distribution of I. cretus reefs are dependent firstly on suitable topography, sediment particle size to produce tubes, and wave exposure. In the case of the relationship between sediment particles and the polychaete tubes, the ability to control abdominal growth is important so that the animal is not longer than the tube and vulnerable to predation (Vovelle 1965). In other species (e.g., Sabellaria aveolata from the NE Atlantic) there is a link between the size of the building organ, the diameter of the anterior region, and the length of animal, which determines the size of particles used in tube building (Gruet 1984). Coral cover, visibility, and depth are important for the polychaetes individually when they have already settled in a reef environment as they are not able to create their own reef. This was the case for station 29. Thus, the PCA showed two main environments where the sabellariids can be found. The first type of environment is described by PC1 and corresponds mainly to the benthic environments found in the SE of the archipelago (uncolonized rock surrounded by sand bottoms), where the sabellariids are able to develop polychaete reefs due to the higher wave exposure. The second type of environment is described by PC2 and corresponds to the benthic environments found in the NW of the archipelago (coral community surrounded by sand bottoms), where the sabellariids survive only as part of the coral reef community. Therefore, the sabellariids found in station 29 (San Pedro Island, NE of Isla del Rey) may be part of the boundaries between these two environments. In the case of the molecular techniques, although the cluster analysis with the gels illustrated some differences in the bands between stations, the differences were not statistically significant. In order to identify differences between stations, samples within a particular station should show higher similarity than with samples from other stations. However, the similarity for samples belonging to different stations was of the same order as the similarity within the stations. Therefore no major DISTRIBUTION AND POPULATION ANALYSIS OF TEP SABELLARIIDS Zoosymposia 2 © 2009 Magnolia Press · 501
  • 16. differences could be detected in the Las Perlas Archipelago samples. One interpretation of these results is that the different reefs have a similar origin or come from one population. Based on the oceanographic information analyzed (that shows the effect of the Peru Current-PC and the South Equatorial Current-SEC in the area), and the document by Glynn & Mate (1997) that indicates transportation of waters from South America to Panama by these currents, it is feasible to suggest that the original settlement in Las Perlas Archipelago occurred from the south, probably Colombia or Ecuador. The population may have arrived first at San Telmo (the largest reef), where they found good conditions for settlement and survival and, from there, the organisms colonized other sites in Las Perlas. Acknowledgements We would like to thank the Darwin Initiative which is administered by the UK Department for Environment, Food and Rural Affairs-DEFRA. (http://www.darwin.gov.uk/). We also thank Dr. Hector Guzman’s team working at STRI (Carlos Guevara, Inez Cambell, Jose Miguel Guevara) and the crew of the STRI research vessel “Urraca”. References Agujetas-Medrano, J. (2004) The Seasonal Upwelling and the Primary Production of the Panama Bight Estimated from Satellite Data: ENSO Implications. MSc thesis. School of Ocean Sciences, University of Wales, Bangor, 98 pp. Applied Maths BVBA. (1998) Applied maths: Software for lab-wide data-basing and analysis of biodata. Available from http://www.applied-maths.com/ (January 2007). Barrios, L.M. (2007) Taxonomy and General Ecology of Marine Invertebrates from Las Perlas Archipelago, Panamanian trOpical Eastern Pacific. PhD thesis. Heriot-Watt University, Edinburgh, 218 pp. Benfield, S.L. (2005) Mapping Coral Reefs and Associated Sublittoral Habitats: A Comparison of Optical Remote Sensors and Image Classifiers and a Study of the Community Structure of Reef-associated Fish. PhD thesis. Heriot-Watt University, Edinburgh, 395 pp. Caline, B., Gruet, Y., Legendre, C., Le Rhun, J., L’Homer, A., Mathieu, R. & Zbinden, R. (1988) Les récifs á Annélides (Hermelles) en baie du Mont Saint-Michel: écologie, géomorphologie, sédimentologie et implications géologiques. Documents du Bureau de Recherches Géologiques et Minières, 156, 1–159. Cazaux, C. (1964) Dévelopment larvaire de Sabellaria alveolata (Linné). Bulletin de L’Institut Océanographique Monaco, 62, 1–15. Chamberlain, R.V. (1919) The Annelida Polychaeta of the Albatross Tropical Pacific Expeditions, 1891–1905. Memoirs of the Museum of Comparative Zoology, Harvard, 48, 1–514. D´Croz, L. & Robertson, D.R. (1997) Coastal oceanographic conditions affecting coral reefs on both sides of the Isthmus of Panama. Proceedings of the 8th International Coral Reef Symposium, Panama, 5 pp. D’Croz, L. & O’Dea, A. (2007) Variability in upwelling along the Pacific shelf of Panama and implications for the distribution of nutrients and chlorophyll. Estuarine, Coastal and Shelf Science, 73, 325–340. D´Croz, L., Mate, J.L. & Oke, J.E. (2001) Responses to elevated sea water temperature and UV radiation in the coral Porites lobata from upwelling and non-upwelling environments on the Pacific coast of Panama. Bulletin of Marine Science, 69, 203–214. D´Croz, L., Kwiecinski, B., Mate, J.L., Gomez, J.A. & Del Rosario, J.B. (2003) El afloramiento costero y el fenómeno del El Niño: implicaciones sobre los recursos biológicos del Pacifico de Panamá. Tecnociencia, 5, 35–49. 502 · Zoosymposia 2 © 2009 Magnolia Press BARRIOS ET AL.
  • 17. Díaz, J.M., Barrios, L.M., Cendales, M.H., Garzón-Ferreira, J., Geister, J., López-Victoria, M., Ospina, G., Parra- Velanda, F., Pinzón, J., Vargas-Angel, B., Zapata, F. & Zea, S. (2000) Áreas coralinas de Colombia. INVEMAR, Serie Publicaciones Especiales, No. 5, 1–176. Fauchald, K. (1977) Polychaetes from intertidal areas of Panama, with a review of previous shallow water records. Smithsonian Contributions, Zoology, No. 221, 1–81. Glynn, P.W. (2001) Eastern Pacific coral reef ecosystems. In: Seeliger, U. & Kjerfve, B. (Eds.), Coastal Marine Ecosystems of Latin America, Springer-Verlag Berlin Heidelberg, Ecological Studies, vol. 144, 281–305. Glynn, P.W. & Mate, J.L. (1997) Field Guide to the Pacific Coral Reefs of Panama. Proceedings of the 8th International Coral Reef Symposium, Panama, 21 pp. Gruet, Y. (1984) Granulometric evolution of the sand tube in relation to growth of the Polychaete Annelid Sabellaria alveolata (Linné) (Sabellariidae). Ophelia, 23, 181–193. Hartman, O. (1940) The Polychaetous Annelids collected by the Presidential Cruise of 1938. Smithsonian Miscellaneous Collections, 98, 1–22. Hartman, O. (1944) Polychaetous Annelids. Part VI. Paraonidae, Magelonidae, Longosomidae, Ctenodrilidae, and Sabellariidae. Allan Hancock Pacific Expeditions, 10, 311–390. Hendrick, V.J. & Foster-Smith, L. (2003) Sabellaria spinulosa reef: An interpretation in the context of the Habitats Directive. European Commission DG Environment, 2003 (Annex), pp. 1–12. Kirtley, D.W. (1994) A Review and Taxonomic Revision of the Family Sabellariidae Johnston, 1895 (Annelida, Polychaeta). Sabecon Press, Florida. 223 pp. Macintyre, I.G., Glynn, P.W. & Cortés, J. (1992) Holocene reef history in the Eastern Pacific: mainland Costa Rica, Caño Island, Cocos Island, and Galápagos islands. Proceedings of the 7th International Coral Reef Symposium, Guam, 2, 1174–1184. Mair, J.M., Sibaja-Cordero, J.A., Arroyo, M.F., Merino, D., Vargas, R., Guzman, H. & Benfield, S. (2009) Mapping benthic faunal communities in the shallow and deep sediments of Las Perlas Archipelago, Pacific Panama. Marine Pollution Bulletin, 58, 375–383 (doi:10.1016/j.marpolbul.2008.10.015). Monro, C.C.A. (1933) The Polychaeta Sedentaria collected by Dr. C Crossland at Colon, in the Panama Region, and the Galapagos Islands during the expedition of the S Y “St George”. Proceedings of the Zoological Society of London, Part 2, 1039–1092. QIAGEN (2006) DNeasy® blood and tissue handbook. QIAGEN, 62 pp. Available from: www.qiagen.com (October 2006). REEF (2004) The Reef Environmental Education Foundation database. Available from: http://www.reef.org/data/ database.htm (April 2009). Schmidt, H. & Westheide, W. (1999) Genetic relationships (RAPD-PCR) between geographically separated populations of the “cosmopolitan” interstitial polychaete Hesionides gohari (Hesionidae) and the evolutionary origin of the freshwater species Hesionides riegerorum. Biological Bulletin, 196, 216–226. Soosten, C., von Schmidt, H. & Westheide, W. (1998) Genetic variability and relationships among geographically widely separated populations of Petitia amphophthalma (Polychaeta: Syllidae). Results from RAPD-PCR investigations. Marine Biology, 3, 659–669. STRI (2008) The Environmental Science Program (ESP): Remote sea temperature downloads. Available from http://striweb.si.edu/esp/physical_monitoring/download_orts.htm (August 2005). Vovelle, (1965) Le tube de Sabellaria alveolata (L) Annélide polychaète et son ciment. Étude Écologique, expèrimental, histologique et histoquimique. Archives de Zoologie Expérimentale et Générale, 106, 1–187. Wardlaw, A.C. (2001) Practical statistics for experimental biologist (2nd edition). John Wiley & Sons Ltd, Chichester, UK. 249 pp. Wilson, D.P. (1929) The larvae of the British sabellarians. Journal of Marine Biological Association of the United Kingdom, 16, 221–269. Wilson, D.P. (1968) The settlement behaviour of the larvae of Sabellaria alveolata (L). Journal of Marine Biological Association of the United Kingdom, 48, 387–435. DISTRIBUTION AND POPULATION ANALYSIS OF TEP SABELLARIIDS Zoosymposia 2 © 2009 Magnolia Press · 503