Apidays Singapore 2024 - Building Digital Trust in a Digital Economy by Veron...
IGNOU PERT CPM
1. UNIT 12 PERTICPM-
Structure
12.1 Introduction
Objectives
12.2 Network Analysis
12.3 Guidelines,,,. for ConstructingNetwork Diagrams
12.4 ~eterrnink~c.. . =me Estimates
12.5 Developing a Project Network
12.6 Project Duration and Critical Path
12.7 Forward Pass (EarliestExpected Time)
12.8 Backward Pass (Latest AllowableTime)
12.9 Float
12.10 Probabilistic rime Estimates
12.11 Probability of Project Completionby a Target Date
12.12 Summary
12.13 Key Words
12.14 Answers to SAQs
12.1 INTRODUCTION-- - - - - - - -
Program Evaluation and Review Technique (PERT) and Critical Path Method (CPM) are
two of the most widely used techniques in project management. The objectives of project
management can be described in terms of a successful completionof project on time within
the budgeted cost and adhering to technical specifications which satisfythe end users. A
project is any human undertaking with a clear beginning and a clearending. Planning,
scheduling and controlling the work during any worth-while project is the main task for a
project manager. Project planning calls for detailing the project into activities,estimating
resource requirements and time for each activity and describing activity inter-relationships.
Schedulingrequires the details of starting and completion dates for each activity.Control
requires not only current status informationbut also insight into possible trade-offswhen
difficulties arise. Normally, for any project, we may be interested in answering questions,
such as (i) when do we expect the project to be completed; (ii) if any activity is delayed,
what effect will this have on the overall completiontime of the project; (iii) if there are
additionalfunds available to reduce the time to perform certain activities,how should they
be spent, and (iv) what is the probability of completing the project by the scheduled date.
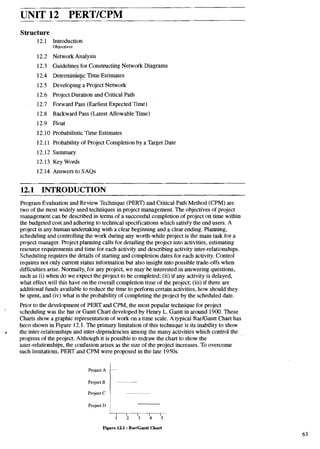
Prior to the development of PERT and CPM, the most popular technique for project
schedulingwas the bar or Gantt Chart developedby Henry L. Gantt in around 1900.These
Charts show a graphic representation of work on a time scale. A typical BarIGantt Chart has
been shown in Figure 12.1.The primary limitationof this technique is its inability to show
, the inter-relationships and inter-dependencies among the many activities which control the
progress of the project. Although it is possible to redraw the chart to show the
inter-relationships,the confusion arises as the size of the project increases. To overcome
such limitations, PERT and CPM were proposed in the late 1950s.
Project A
IProject B --
Project c 1
project D ~
Figure 121 :BarIGantt Chart
2. Historically speaking, PERTand CPM developedindependently out of research studies
conductedby the U. S. Navy and DuPont company. While PERTwas an outgrowth of the
U. S. Navy's Polaris submarine-missileprogramme,CPM was developed for planning the
construction of chemicalplants.
THe differencebetween PERT and CPM arose primarily because of the originaljob for
which each technique was developed. Initially the PERT technique was appliedto research
and developmentprojects while the CPM was used in constructionprojects. Both of them
share the notion of a criticalpath and are based on the network analysis that determines the
most critical activities to be controlled so as to meet completion dates. However,since the
use of either technique is based on individual characteristics,the main difference is that
PERT is particularly useful fornon-repetitive and complexprojects in which time estimates
are uncertain. CPM is best utilised for repetitiveand non-complex projectswhen time
estimatescan be made with some measure of certainty. The selection of the technique
depends on the degree of uncertainty associated with time estimates and the cost of
non-accomplishingtime estimates. Actually, PERTrestricts its attentionto the time variable
whereas CPM includes time cost trade-offs. For our purpose, we will not differentiate
between the two techniquesbut we can further definePERT and CPM as the process of
employingnetwork techniques to optirnise the use of scarceproject resources.
Objectives
After studying this unit, you shouldbe able to
appreciateproblems involved in planning, schedulingand controllingof
projects,
list and discussthe special terms developed for this unit, namely activity,
event,dummy activity, criticalactivity,slack,criticalpath and float,
develop simplenetwork diagramswith activitiesand events,
identify criticalpath through the calculation of the earliest expected time and
the latest allowable time,
compute slack and float, and
estimatethe probability of completing a project by a certain target date.
12.2 NETWORK ANALYSIS
Afundamental ingredient inboth PERTand CPM is the use of network systemsas a means
of graphically depicting the current problems or proposed project. Because of its importance
to a basic understanding of both PERTand CPM, the network conceptwill be examined.
When a network is being constructed,certain conventions are followedto represent a
project graphically.In a network diagram, it is essentialthat the relationshipbetween
activitiesa@ events are correctly depicted. Before illustratingthe network representation, it
is necessary to definesome of the key concepts,
Activity
All projects may be viewed as being composed of operationsor tasks called activities
which require the expenditureof time and resources for their accomplishment. An •
activity is depicted by a single arrow ( -,) on the project network. The activity
arrowsare calledarcs.The activityarrow isnot scaled; the length of the activity
time is only a matterof convenience and clarity, and doesnot represent the
importance of time. The head of the arrow shows the sequenceor flow of activities.
An activityc ot begin until the completion of its preceding activities.It is
"("important tha activitiesshouldbe well-defined so that beginning and endof each
activitycanbe identified clearly.
Event
An event representsaspecificaccomplishment in the project and takes place at a
particularinstantof time, and does not,therefore,consume time or resources.An
event in a network is a time-oriented reference point that signifies the end of one
activityand the beginning of another. Events are usually represented in the project
network by circles(0).The eventcircles are callednodes. Therefore,the major
differencebetween activitiesand eventsis that activitiesrepresentthe passage of
3. time whereas events are points in time. All activity arrows must begin and end with
eventnodes as shown in Figure 12.2.
First Activity
Event
I figure12.2 :Event-ActivityRepresentation
1 PredecessorActivity
Activitiesthat must be completedimmediatelyprior to the startof anotheractivity
are calledpredecessor activities.
SuccessorActivity
Activitiesthat cannotbe starteduntil one or more of the other activitiesare
completed,but immediatelysucceed them are calledsuccessor activities.
Cor~currentActivity
Activities which can be accomplishedconcurrently are known as concurrent
activities. It may be pointed out that an activity can be a predecessor or a successor to
an event or it may be concurrent with one or more of the other activities.
Dummy Activity
In most projects many activitiescan be performed concurrently or simultaneousiy. It
is possible that two activitiescould be drawnby the samebeginning andendevents.
In situations where two or more activities can be performed concurrently, Ule concept
of dummy activity is introduced to resolve this problem. Thereforethere will be only
one activity between two events.As a result of using the dummy activity, other
activities can be identified by unique end events. Dummy activities consumeno time
orresources. By convention, dummy activities arerepresented by a dashed arrow on
the project network. In Figure 12.3,both activities Aand B have the samebeginning
and end events.
Thenetwork diagramgiven in Figure 12.3is incorrectbecause it breaks the rule of
assigning unique numbers to each activity for the purpose of identification.Vie
network diagramshownin Figure 12.3 demonstratesthe principle of using a dummy
activity for overcomingthe problem of parallel activities with identical start and
finishevents.
figure 124:Use &Dummy Activities
Therefore,a dummy activity is created to make activities with common startingand
finishingeventsdistinguishableand alsoto identifyand maintain the proper
precedence relationshipbetween activities.
4. OptiaizPtioaTechoiqmea-LI
12.3 GUIDELINESFOR CONSTRUCTING
NETWORK DIAGRAMS
(1) Each activity is representedby one and only one arrow in the network.
Therefore, no single activity can be represented twice in the network.
(2) No two activitiescan be identified by the samebeginning and cnd events. In
such cases, a dummy activity is introduced to resolve the problem.
(3) Two events arenumbered in such a way that the event of highernumber can
happen only after the event of a lower number is completed.
(4) Dangling must be avoided in anetwork diagram. This happens when
precedence and inter-relationshipsof the activities arenot properly identified.
(5) To ensure the correct logical sequenceand inter-relationships,one has to
answerthe followingquestions satisfactorily.
(i) Which activitiesprecede this activity?That is, what other activities must be
completed before this activity can be started ?
(ii) Which activities follow this activity ? Or, what activities cannot be started
until this activity iscompleted ?
(iii) Which activities can take place concurrently with this activity ? Or, what
activities can be worked on at the same time when this activity is being
performed?
12.4 DETERMINISTIC TIME ESTIMATES
The main determinantof the way PERTand CPM networks are analysed and interpretedis
whether activity time estimates are deterministicor probabilistic. If time estimates can be
made with a high degree of confidence so that actual time will not differ significantly from
estimated time, we say, the time estimates are deterministic.On the other hand, if estimated
times are subject to variation, we say the time estimates are probabilistic.First, we shall
describe the analysisof network with deterministic time estimatesand at a later stagewith
probabilistic time estimates.
12.5 DEVELOPING A PROJECT NETWORK
Networks of PERTICPMconsistof two basic elements : activitiesand events. Thenetwork
clearlyshows the sequence and inter-relationshipsof all activitiesin the project.To
illustratehow a project network can be developed,let us consider an example where a
project involvesseveral activities which are listed in Table 12.1alongwiththeir predecessor
activities.
Table 12.1
All the activities associated with the project can be combined into an integrated network of
events and activities as shown in the network diagram in Figure 12.5.
Activity
A
B
C
D
E
F
G
Thenetwork diagram in Figure 12.5gives the completedescriptionofthe project. For
example, activities A and B have no predecessoractivities,they can begin immediatelyand
are showncomingout at the startevent 1.You may 0 b s e ~ ethat activity G has two
predecessor activities D and E. Similarly other relationships are also satisfied.
PredecessorActivity
-
-
A
A
B
C
D, E
5. Figure 125 t NetworkDiagram
t
SAQ 1
A car manufacturingcompany has decided to redesign its fuel pump for their new car
model. This project involvesseveral activitieswhich are listed in Table 12.2. First
activity is that the engineeringdepartment must evolve the design of fuel pump.
Second,the marketing departmentmust develop the marketing strategy for its
promotion. Third, a new manufacturing process must be designed. Fourth,
advertisingmedia must be selected. Fifth, an initial productionrun must be
completed.Finally, the pump must be released to the market.
Table 123
- -- -
Activity Description of Activity Predecessor Time Estimate
Activity (Weeks)
A Evolve the design of fuel pump - 5
B Develop marketing strategy A 4
C Design manufacturing process A 7
D Select advertising media B 8
E Initial production run . C 9
I F Release fuel pump to market D, E 4 I
Draw a network diagram for the given project.
12.6 PROJECT DURATION AND CRITICALPATH
The longest path in the network is called the criticalpath. ldentifying the criticalpath is of
great importanceas it determines the duration of the entire project. If any activity on the
criticalpath is delayed, then the entire project will be delayed. Every network has a critical
path. It is possible to have multiple critical paths if there are ties among the longest paths.
For finding the project duration and critical path, let us consider the examplediscussed
earlier (Table 12.1). For this example,the time estimates (in weeks) for each activity are as
shown in Table 12.3.
Table 123
Activity
G
PredecessorActivity . 1 TimeEsthates (Weeks)
6. In the network diagram given in Figure 12.6,the time estimates (weeks)are specified inside
the bracket alongwiththe activity.
There are three possible paths for this network. For this simplenetwork, the critical path is
foundby enumeratingall of the possible paths to the completion time. Thesepaths are listed
in Table 12.4.
Table 12.4
(a) A-+C+F 4+2+4 = 10 weeks
(b) A + D + G 4 + 7 + 2 = 13 weeks
(c) B + E + G 3+6+2 = 11 weeks
The second path ( A 3 D -+G ) is the critical path because it requires the longestperiod of
time, i.e. 13weeks for completionof the project. For this network, the project duration time
to completethe project is 13weeks. The activities on the criticalpath are calledcritical
activities because a delay in any of these activities results in a delay of the entire project. In
other words, there is no slack time in the activities on the criticalpath. Slack time is defined
as the latest time an activity can be completedwithout delaying the project minus the
earliest time ~e activity can be completed.Therefore, slack time is the amountof time an
activity can be delayedwithout delaying the entire project.
For this small network, it is a simpleprocess to identify the criticalpath by comparingall
possible paths. As the number of activities increases, it may become very difficult and time
consuming to find the critical path by completeenumerationor inspection. Therefore,we
need to develop an algorithm (a systematicapproach)to determine the critical path. The
critical path calculations proceed in two phases. The first phase or forwardpass begins from
left to right through the network. The calculationbegins at the startevent and moves
towards the end eventof the project network. The secondphase or backward pass begins
fromright to leftthrough the network. In this phase, the calculation begins fromthe end
event and moves backward to the start event.
-- - - - - - -
12.7 FORWARD PASS (EARLIESTEXPECTED TIME) .
In forward pass, we computethe earliest time an eventcan be expectedto occur which in
turn dependsupon the latest completiontime of an activity terminating at that point. Thus,
the longestpath, in terms of duration times, is the earliest expected time for that event to
occur. During the forwardcalculations, we need to computethe earliest expectedtime (ET)
for each of the eventswhich can be calculatedas follows :
where,
ETj = the earliest expectedtime of eventj
ETi = the earliest expected time that an activity can be started leading to eventj
dij = duration time of an activityfrom event i to eventj
Max = Maximum (of)
7. Let us use this computational procedure to determine the earliestexpected time for eqch
event for the network diagram shown in Figure 12.6.The use of this procedure suggeststhat
the earliest expected time for a given event is primarily a function of the previous events
plus the activity times of all prior activities. Applying this procedure, we get,
ETl = 0 ( starting event set at zero )
ET2 = ETi+diz= 0 + 4 = 4
ET3 = ETi+dls = 0 + 3 = 3
= Max[11,9] = 11
ET6 = Max[ET4+&6,ETs+ds6] = Max[6+4,11+2]
= Max [ 10,13 1 = 13
Note that the end event 6 occurs at the end of 13weeks.
12.8 BACKWARD PASS (LATEST ALLOWABLE TIME)
In backward pass, we compute the latest allowable time (LT). The LT for an event is the
latest time that the event can be delayed without delaying the completion of the entire
project. The procedure we use in computing LT is to start from the end event of the network
and proceeding backward to the starting event.The latest allowable completion time (LT)
for a given event is calculatedby subtractingthe duration times of all activities coming into
the event. In cases, where two or more activities start from an event, we must select the
smaller of LT values. The LT value for an event in a network can be calculated as follows :
LTi = Min ( LTj- dij)
where,
LTi = the latest allowable time of event i
LTj = the latest allowable time of eventj towards which activity ( i,j ) is headed
dij = duration time of an activity from event i to eventj.
Min = Minimum (of)
Let us use this procedure to determinethe LT value for each event in the network shown in
Figure 12.6.To find LT values we begin at the end event of the network. The expected
completion time for the project is 13weeks.
In our example, since event 6 is project completion,it must occur no later than 13weeks or
else the project will be completed later than expected. Therefore,for the end event,
ET = LT = 13weeks. The computation of other LT values are shown below :
LT6 = 13
LT5 = LT6-d56 =13-2 = 11
LT2 = Min [ LT4 -d u , LT5 -d25 ]
= M i n [ 9 - 2 , l l - 7 1 = Min[7,4] = 4
LTi = Min [ LT2 -,d12, LT3 -dl3 ]
= Min[4-4,5-31 = Min[0,2] = 0
It shouldbe noted here that, by definition, at the beginning point of the network, i.e.
event 1,we must have ET1 = LT1 = 0.
Once the values of ET and LT for all the events are determined,we can easily identify the
critical path. These values of ET and LT are listed around each event in Figure 12.7.If the
values of ET and LT of an event are equal,then such an event is referred to as the critical
event. If the values of ET and LT of an event are not equal, then such an event is referred to
as noncritical events.
8. Figure 12.7
Critical activities can alsobe identified from the project network diagram. Acritical activity
is an activity whichjoins two criticalevents and has a durationwhich equals the difference
between the times of these criticalevents. Acritical path consistsonly of such critical
activities.It may be pointed out againthat critical activities are important because if they
exceed their estimateddurations,the whole project will be delayed to that extent.
An event that isnot critical is said to have slack.Slack is the calculated time span within
which the event must occur. The term slack is used only for referring to events.
As you would expect, every event on the criticalpath has no slack time. The critical path is
shownby thj& lines in Figure 12.7.The importance of identifying the critical path is that it
points out those activitiesand events which are critical and as such, mustbe carefully
monitored and controlled.
SAQ 2
Consider the data of SAQ 1.Computethe earliestexpectedtime and latest allowable
time for the events in the given project, Also determinethe critical path and slack
time. Interpret your slack time values.
12.9 FLOAT
The conceptof float is of great importancefor a project manager. It is the time available for
an activity in addition to its duration time. Sinceboth start and end events of an activity
have earliestand latest times, an activity has four associatedtimes. Thus, there are four
possible types of floatbut in practice only three of these areused.
Total Float
This is the time by which an activity may be delayed or extended without affectingthe total
project duration.This is computedas follows :
where,
TFij = total float for actidy ( i,j ),
LTj = latest allowable time for eventj ,
ETi = earliestexpected time for eyent i, and
dij = the time duration for activity ( i,j ).
Free Float
This is the time by which an'activity may be delayed or extended without delaying the start
of any succeedingactivity.This is calculated as follows:
FFij = ETj-ETi -dij
9. where,
1 FFl, = free float for activity ( i,j ),
I ETj = the earliest expected time for eventj ,
ETl = the earliest expected time for eventi,and
diJ = the time duration for activity ( i,j ) .
IndependentFloat
This is the time by which an activity may be delayed or extended without affecting the
preceding or succeeding activities in any way. This is obtained as follows:
I F I j = ETj - LTI - dq
where,
i FFiJ = Independent float for activity ( i,j ),
ET, = the earliest expected time for eventj,
LTl = the latest allowable time for event i,and
dij = the time duration for activity ( i,j ).
SAQ 3
Compute total float, free float and independentfloat from the results you obtained
SAQ 2.
12.10 PROBABILISTICTIME ESTIMATES
Uptil now, we have discussed cases where the activity duration times were known with
certainty.It is obvious that for most projects these activity times are random variables.
PERT is more effective in handling cases in which activity duration times are uncertain. The
PERT technique makes the followingbasic assumptions:
(1) Activity times are statisticallyindependentand usually associated with a 'beta'
distribution.
(2) There are enough activitiesinvolved in the network that the totals of activity
times based on their means and variances will be 'normally' distributed.
(3) The three estimates of the activity-durationcan be obtainedfor each activity.
The three time estimatesare referred to as
(i) Optimistic time estimatedenotedby a
. (ii) Most likely time estimatedenoted by m
(iii) Pessimistic time estimatedenotedby b
The useful property of the beta distributionis that if we know the three time estimates(a, m
and b) for an activity,we can compute mean or expected duration time ( t,) and the
variance of duration ( o:, ) as follows :
a + 4 m + b
te =
6 and ot = [y)
The shapeof the beta distributionis skewed.It can either be skewed left or skewed right. The
Figure 12.8depicts a beta distribution which is skewed to the right.
To demonstrate the use of PERT, let us continue with the same example. Instead of activity
times to be known with certainty,let the three time estimates beas shown in Table 12.5.
10. Probability
t
Optimistic Most likely tc
-
Activity time
Figure12.8 :BetaDistribution Curve
Table 12.5
1 I I Time Estimates (weeks) I
In order to find the critical path, we need to determine the mean or expected duration for
each activity. Once this is done, the procedures you have already learnt can be applied to
find critical path. The expected time (b),is shown in Table 12.6.
Activity
Table 12.6
Predecessor
Activity
Nste that the expected time ( t,) for each activity turned out to be the same as the single
time estimate used earlier in this example. Obviously, no coincidence, this was intentiona
done for the sake of simplicity.The calculations for standard deviation and variance are
shown in Table 12.7.
Table 12.7
Optimistic
a + 4 m + b
t, =
6
4
3
2
7
6
4
2
Activity
A
B
C
D
E
F
G
Activity Expected (mean) Standard Deviation Variance
Time ( t, )
Most likely
Predecessor
Activity
-
-
A
A
B
C
D,E
Pessimistic
a I m
E
F
(i*
b
Time (weeks)
a
2
2
1
4
4
3
1
*Critical activity
6
4
2
m
3
3
2
6
5
4
1
8/6 = 4/3
2/6 = 1 4
6/6 = 1
b
10
4
3
14
12
5
7 '
16/9
1/9
1
11. The distributionof each activity completion time is 'normally' distributed. Thus, the
expected activity times for critical activities are also normally distributed. The following
! table shows the critical activities along with expectedtime (k),standard deviation (otJand
2
variance (ate).
I
Table 12.8
12.11 PROBABILITY OF PROJECT COMPLETION
BY A TARGET DATE
Critical
Activity
A
D
G
Sometimes,the management would also like to know the probability of completing the
project by a particulardate. Let us assume that in our example, we are required to complete
the project within 11weeks.
We know that the expected activity times for critical activities are also normally distributed
(central limit theorem).
Expected
Time (04)
4
7
2
ot, = 13
Therefore,in order to find the probability of project completion by a targetdate, we can use
the following formula :
where
Standard
Deviation (otJ
4/3
5/3
1
x = target project completion time,
Variance
( ol)
16/9
25/9
1
E02 =' 50/9
te = expected project comgletion time, and
ot,= standard deviation of activities on the critical path
In our example expected activity times follow a normal distribution with mean time
ate= 13weeks and standard deviation t, = 2.357 weeks. The target due date is 11weeks.
Using the formula,we get
Now, we can find the probabilityto any value of Z fromthe standard normal distributiontable.
The probability for the value of Z = - 0.85 is 0.8023. Since Z = - 0.85, we must subtract
- 0.8023 from 1.0.Thus,we obtain 1- 0.8023 = 0.1977. Thereforethe requiredprobabilityof
completing the project within 11weeks is 0.1977or 19.77percent.
Supposenow we are interested in finding the probability of completing the project in
16weeks. Again using the formula,we get
The probability for the value of Z = 1.27is 0.8980 from the standard normal distribution
table. Thus, the probability of completing the project in 16 weeks is 0.8980or 89.8percent.
SAQ 4
Consider a project having activitiesand their associated time estimates as given in
Table 12.9.
(a) Draw the project network diagram.
(b) Identify the criticalpath md computethe expected project completiontime.
12. 0pthnbrti00 T ~ ~ M ~ I I W - I I (c) What is the probabilitythat the project will be completed on or before 55 days?
(d) What is the probabilitythat the project will be completed after 70 days ?
Table 12.9
12.12 SUMMARY
Activity
A
B
C
D
E
F
G
H
PERT/CPM is a network techniquethat is very useful to a project manager throughout all
phases of a project. An understanding of events and activities and an appreciationof the
inter-relationshipsbetween them are necessary before a network for the project can be
constructed. Anetwork can provide information such as earliest expected time, latest
allowable time, slack and criticalpath. Activity times may be deterministic or probabilistic
in nature. PERT introducesprobabilisticaspects to the project network. It uses three time
estimates :Optimistic,most likely, and pessimistic. llle random characteristicsof activity
times are considered to follow beta distribution.The use of normal distribution assists the
manager in determiningthe probability of project completion within a certain specified time
period.
12.13 KEY WORDS
Predecessor
Activity
-
A
A
B
B, C
E
D
F, G
Activity : A clearly definable portion of a project that requires for its
completion, the consumption of resources and time in
particular.
Time (days)
CriticalActivity : An activity becomes critical, if delay in its estimated time
duration delays the whole project to that extent.
Optimistic
2
8
14
4
6
6
18
8
Critical Path : The longestpath through the network, consisting of critical
activities.The length of the critical path is the shortest time
allowablefor project completion.
Dummy Activity : Dummy activity is an activity which does not consume any
resource or time. It is used in network to show logical links
between other real activities.
Most likely
4
12
16
10
12
8
18
14
Event
Pessimistic
6
16
30
16
18
22
30
32
: An event represents a specific accomplishment in the project
and takes place at a particular instant of time and therefore
does not consume resourcesor time.
Earliest Expected : The earliest time that an event can occur is on the latest
Time completionof an activity.
Float : It is the amountof time available for an activity in addition to
its duration time. Float is computed in relation to activity.
13. LatestAllowable Time : The latesttime that theeventcanbe delayedwithout delaying
the completionof theentireproject.
Slack : The amount of time by which the startof an activitymay be
delayedwithoutaffectingtheoveralldurationof the project.
Slack is computedin relation toevents.
12.14 ANSWERS TO SAQs
SAQ 1
PleasereferSection 12.5.
SAQ 2
Please referSections 12.7and 12.8.
48 SAQ3
Please refer Section 12.9.
14. I
~ T c Q d q U a - I I
FURTHER READING
(1) Buffa,E. S., 1990,ModernProduction/OperationManagement, Wiley Eastern
Limited.
(2) Everen E. Adam, Jr and RonaldJ. Ebert, 1986,Productions and Operations
Management:.Concepts, Modelsand Behaviour, PrenticeHal1International.
(3) Hadley, G. and Whitin, T. M., 1963,Analysisof InventorySystem,PrenticeHall,
New Jersy, USA.
(4) Levin, R. and Kirkpatrik,C. A., 1978,QuantitativeApproachesto Management,
McGraw Hill, Kogakusha Ltd., International StudentsEdition.
(5) Mustafi, C. K, 1988,OperationsResearch, MethodsandPractice,Wiley Eastern
Limited.
(6) PetersonR. and Silver, E. A., 1979,DecisionSystemfor InventoryMunugementand
Production Planning, Wiley, New York, USA.
(7) Taha, H. A., 1976,OperationsResearch :An Introduction, MaCMillanPublishingCo.
inc., New York.
(8) Rao, S. S., 1984,Optimizarion 'IlreoryandApplications,Wiley Eastern Ltd.,
New Delhi.
(9) Saaty, T.L., 1961,Elements of Queueing Theorywith Applications, McGraw
Hill, New Yo*.
(10) Gupta,M. P. and J. K. Sharma, 1987,OperationsResearchfor Management,National
Publishing House, New Delhi.