Richmond Metropolitan Area Market Conditions Report
•
0 j'aime•214 vues

- The median home sale price in the Richmond metropolitan area was $195,500 in September 2013, an increase of 9% from September 2012. Total home sales were up 13% from the previous September while active inventory decreased by 4%. The supply of homes available relative to demand was 6.3 months, down from 7.3 months the prior year.

Recommandé
Recommandé
Contenu connexe
Tendances
Tendances (17)
Similaire à Richmond Metropolitan Area Market Conditions Report
Similaire à Richmond Metropolitan Area Market Conditions Report (20)
Dernier
Dernier (20)
Richmond Metropolitan Area Market Conditions Report
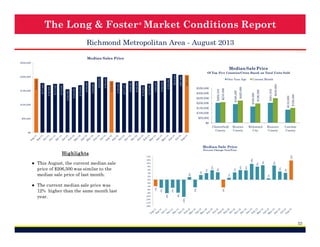
- 1. The Long & Foster ® Market Conditions Report Richmond Metropolitan Area - September 2013 Median Sales Price $250,000 Median Sale Price $240,000 $221,500 $262,975 $222,750 $189,750 $200,000 $100,000 Current Month $165,500 $250,000 $189,950 $300,000 $193,000 $350,000 $213,000 One Year Ago $183,750 $195,500 $208,000 $207,250 $210,000 $195,750 $187,000 $185,000 $175,500 $170,000 $185,000 $185,000 $177,457 $180,000 $185,000 $198,625 $180,000 $185,000 $170,000 $162,500 $155,000 $175,000 $174,700 $177,900 $150,000 $169,900 $200,000 $200,000 Of Top Five Counties/Cities Based on Total Units Sold $150,000 $100,000 $50,000 $50,000 $0 Chesterfield County $0 Henrico County Richmond City Hanover County Powhatan County Median Sale Price 12% 4% 9% 9% 5% 6% 4% 6% 1% 2% 1% 4% 6% 6% 4% 8% 5% 10% 9% 12% 8% 10% 14% 3% ● This September, the median sale price was $195,500, an increase of 9% compared to last year. Percent Change Year/Year 2% Highlights 0% -14% -5% -8% -10% -12% -5% -8% -10% -8% -6% -5% -4% -5% ● The current median sale price was 6% lower than in August. -2% -16% 22
- 2. The Long & Foster ® Market Conditions Report Richmond Metropolitan Area - September 2013 Total Units Sold 1,800 One Year Ago 1,511 36 26 100 400 118 86 200 160 159 300 341 313 349 1,181 400 290 1,632 1,589 1,316 Current Month 500 896 834 Of Top Five Counties/Cities Based on Total Units Sold 600 1,086 1,089 1,118 1,094 1,340 1,352 1,047 1,173 862 1,039 1,065 768 600 932 800 879 1,000 999 1,200 1,501 1,424 1,400 1,604 Total Units Sold 1,600 0 Chesterfield County 200 Henrico County Richmond City Hanover County Powhatan County 0 Total Units Sold Percent Change Year/Year 30% ● This month's total units sold was higher than at this time last year, an increase of 13% versus September 2012. 20% 13% 9% 12% 12% 5% 4% 9% 2% 5% 4% 12% 20% 20% 13% 19% 9% 13% 13% 17% 20% 19% 14% 15% 10% 0% -1% ● There was a decrease of 22% in total units sold in September compared to August. 24% Highlights -10% 23
- 3. The Long & Foster ® Market Conditions Report Richmond Metropolitan Area - September 2013 Total Units Sold by Type Total Units Sold by Type Detached Attached Current Month Condo Detached 1,800 Attached Condo 1,600 1,400 55 98 5% 8% 1,200 1,000 800 600 400 200 1,028 87% 0 Total Units Sold by Price Range Total Units Sold by Price Range < 150K 800 150K to < 300K 300K to < 450K 450K to < 600K Current Month 600K and up < 150K 450K to < 600K 700 300K to < 450K 57 44 5% 4% 600 500 150K to < 300K 600K and up 355 30% 198 17% 400 300 200 100 0 527 44% 24
- 4. The Long & Foster ® Market Conditions Report Richmond Metropolitan Area - September 2013 Total Active Inventory 10,000 Total Active Inventory 249 500 3,000 224 1,000 4,000 633 621 1,140 1,500 Current Month 1,051 1,596 2,000 5,000 1,462 1,982 2,500 1,942 7,396 7,460 7,549 7,509 7,531 7,306 6,933 6,810 6,652 6,814 7,240 6,000 7,414 7,669 One Year Ago 7,645 7,813 7,951 8,007 7,945 7,678 7,547 7,478 7,473 8,155 7,000 Of Top Five Counties/Cities Based on Total Units Sold 8,560 8,000 8,845 9,000 0 Chesterfield County 2,000 Henrico County Richmond City Hanover County Powhatan County 1,000 0 Total Active Inventory Percent Change Year/Year Highlights -18% -2% -4% -3% -6% -6% -8% -10% -10% -11% -18% -19% -19% -20% -20% -21% -21% -25% -22% -20% -21% -15% -13% -13% -9% -10% -11% -5% -20% ● Versus September 2012, the total number of homes available was lower by 273 units or 4%. 0% -21% ● This month's supply of available inventory remained relatively stable compared to last month. -30% 25
- 5. The Long & Foster ® Market Conditions Report Richmond Metropolitan Area - September 2013 Total Active Inventory by Type Total Active Inventory by Type Detached Attached Condo Current Month Detached 10,000 Attached Condo 9,000 300 667 4% 9% 8,000 7,000 6,000 5,000 4,000 3,000 6,429 87% 2,000 1,000 0 Total Active Inventory by Price Range < 150K 150K to < 300K 300K to < 450K 450K to < 600K 600K and up Total Active Inventory by Price Range Current Month 10,000 9,000 < 150K 450K to < 600K 150K to < 300K 600K and up 300K to < 450K 8,000 7,000 6,000 5,000 4,000 446 429 6% 6% 1,065 14% 2,119 29% 3,000 2,000 1,000 0 3,337 45% 26
- 6. The Long & Foster ® Market Conditions Report Richmond Metropolitan Area - September 2013 Sale Price as % of List Price Average Sale Price as a Percent of List Price 98.5% 96.4% 98.8% 97.5% 95.2% 96.0% 96.8% 98.4% 98.0% Current Month 98.2% One Year Ago 99.2% 100.0% 98.2% 98.2% 98.0% 98.2% 98.0% 97.9% 97.8% 97.4% 97.2% 97.7% 97.2% 97.3% 97.4% 96.9% 96.9% 96.8% 96.7% 96.6% Of Top Five Counties/Cities Based on Total Units Sold 94.0% 95.5% 95.0% 92.0% 95.5% 95.7% 96.0% 96.4% 96.5% 96.6% 97.0% 97.5% 97.4% 97.5% 97.5% 98.0% 98.0% 98.5% Chesterfield County Henrico County Richmond City Hanover County Powhatan County 94.5% Days on Market Current One Year Month Ago 94.0% 59 Avg Sale Price as % of List Price Current One Year Month Ago 71 Down -17% Vs. Year Ago 83 85 80 80 75 85 102% 81 60 55 50 < 150K 150K to < 300K 300K to < 450K 450K to < 600K 600K and up 100% 76 73 71 71 73 72 73 75 76 98% 96% 68 70 65 Up 0.7% Vs. Year Ago by Price Range 84 79 97.5% Average Sale Price as a Percent of List Price Days on Market 90 98.2% 63 94% 65 65 92% 62 58 57 53 59 59 90% 88% 86% 84% 27
- 7. The Long & Foster ® Market Conditions Report Richmond Metropolitan Area - September 2013 Total Dollar Volume Sold Highlights In Thousands $450,000 ● Total volume sold this September was 25% greater than the same month one year ago. $50,000 $369,988 $394,135 $399,598 $369,879 $280,337 $292,353 $230,198 $191,735 $176,827 $244,327 $249,257 $241,661 $225,108 $299,414 $246,390 $207,087 $167,847 $224,532 $141,904 $100,000 $195,678 $150,000 $174,274 $200,000 $214,834 $250,000 $321,401 $300,000 $306,881 $350,000 $358,403 $400,000 ● In September, there was 6.3 months of supply available, compared to 7.3 in September 2012. That was a decrease of 14% versus a year ago. $0 Total Dollar Volume Sold Current One Year Month Ago Months of Supply Current Month's Active Inventory/Current Month's Unit Sales 12 $280,337,079 $225,107,857 Up 25% Vs. Year Ago 2 4.9 4.7 4.6 5.6 6.3 6.4 8.0 6.3 6.5 6.8 7.3 5.7 5.8 7.6 4.7 4 5.3 5.6 6.8 7.4 8.8 9.7 7.0 6 8.8 8 8.9 9.7 10 Months of Supply Current One Year Month Ago 6.3 7.3 Down -14% Vs. Year Ago 0 28
- 8. The Long & Foster ® Market Conditions Report Richmond Metropolitan Area - September 2013 New Listings New Listings & New Contracts 2,183 Henrico County Richmond City 59 51 163 Powhatan County 25 32 86 89 157 190 Current Month 346 272 400 406 600 321 1,378 1,265 1,388 1,482 1,727 1,674 1,479 1,233 1,239 1,088 One Year Ago 800 200 0 Chesterfield County New Listings Current One Year Month Ago 1,846 Up 11% Vs. Year Ago New Contracts Current One Year Month Ago 1,265 Hanover County Of Top Five Counties/Cities Based on Total Units Sold 0 2,053 137 290 485 437 591 544 Chesterfield County 2,053 2,333 2,159 2,576 2,303 2,010 2,016 800 600 400 200 0 Current Month New Contracts 823 1,533 923 1,807 1,112 1,846 1,060 2,020 1,241 2,066 1,137 2,096 2,316 1,419 1,336 2,313 1,436 2,421 1,489 1,000 500 822 1,033 925 938 1,000 1,138 1,500 1,270 1,909 1,548 1,789 2,000 2,002 2,217 3,000 2,500 One Year Ago 325 New Contracts (Under Active Contract Status) 2,685 New Listings Of Top Five Counties/Cities Based on Total Units Sold Richmond City Hanover County Powhatan County Supply/Demand Ratio Highlights ● Based on this month's amount of new listings and new contracts, the ratio of home supply (new listings) to current home demand (new contracts) was 1.6, a decrease of 7% from September 2012. Henrico County Number of New Listings to New Contracts 2.5 2.2 2.0 1.9 1.8 1.7 1.5 1.8 1.5 1.8 1.6 1.6 1.6 1.6 1.6 1.7 1.9 1.6 1.7 1.5 1.6 1.6 1.6 1.7 1.5 1.5 1.6 1.6 1.0 1,060 0.5 Up 19% Vs. Year Ago 0.0 29