SlideShare une entreprise Scribd logo
1  sur  13
Télécharger pour lire hors ligne
Supporting ‘Green’ electricity: 
            Lessons learned from the Spanish Feed‐in tariff system 
                                                     
Lara Pérez Dueñas 
Gnera Energía y Tecnología. Energy Consultant and Energy & Environment Engineer 
lpd@gnera.es 
 
ABSTRACT 
The Spanish economic support system for electricity from renewable energy sources 
has had a good reputation due to its good results in terms of number of new plants, 
installed megawatts, industrial development, etc. Nevertheless, in the last years we 
have assisted to major and sudden legislative changes motivated by different events 
that  have  put  under  discussion  the  system  sustainability.  After  describing  the  main 
green electricity support systems available and the benefits of introducing renewable 
energies in  the electricity market, this paper analyses the  causes of the “boom and 
burst” of the Spanish support mechanisms and the main lessons learned. 
 
JEL code: Q4 
 
Key‐words:  electricity  market,  renewable  energy,  feed‐in  tariff,  renewable  energy 
support instruments 


    I.        GREEN ELECTRICITY SUPPORT INSTRUMENTS 
 
Costs and benefits of renewables in the electricity market 
 
A  sustained  development  of  renewable  energy  (RE)  is  nowadays  still  not  possible 
without    the support of dedicated policy instruments. Much debate has been made to 
argue  if  renewable  energies  are  ‘too  expensive’  or  not,  leading  to  even  emotional 
debates.  Actually,  the  use  of  electricity  from  renewable  energy  sources  has  several 
direct  and  indirect  effects  on  energy  costs,  as  well  on  economics  and  social  issues. 
Their quantification can allow us to have a more global vision of the incentives paid to 
renewable  electricity  producers.  Let  us  briefly  describe  some  of  these  positive  and 
negative effects: 
    - Environmental externalities: Actual energy costs do not include environmental 
         externalities:    health  issues,  energy  dependency,  energy  resources  depletion, 
         supply and public security, accidents, climate change, global justice… 
 
    - Economic  and  social  benefits:  Deloitte  (2009)  in  its  study  on  the 
         macroeconomic impact of wind energy, compares the direct cost of incentives 
         for  wind  power  in  Spain  to  other  quantified  benefits  such  as  CO2  emissions, 
         fewer fossil fuels import and other indirect economic and social benefits such 
         as new job creation, direct and indirect increase in PIB, R&D… Morthorst (2010) 
         also  states  that  “if  both  the  direct  and  indirect  cost  savings  from  renewable 
         energy  generation  were  taken  into  consideration,  the  net  effect  of  the  RES 
support  scheme  would  be  negative,  that  is,  the  consumer  would  pay  lower 
        prices.” 
 
    -   Merit  order  effect:  The  introduction  of  renewable  energy  in  an  electricity 
        market  where  price  setting  is  based  on  merit  order  can  result  in  lower 
        electricity  spot  prices  for  consumers  and  eventually  (but  not  necessarily)  in 
        lower retail prices, as will be further discussed. 
 
    -   Opportunity cost due to additional operating reserve: Most renewable energies 
        are said to be “not administrable”, i.e. we cannot regulate their production on 
        demand  as  it  depends  mainly  on  weather  conditions  (wind,  sunlightning  or 
        rain) or on the lack of flexibility of the plant –which is also the case for nuclear 
        power. Thus, we need to grant an additional operating reserve that will ensure 
        the electricity supply on peak hours. Combined cycles are a valuable technology 
        for  operating  reserve  because  of  its  high  flexibility.  Spain  has  bet  on  this 
        technology and has greatly increased the installed capacity of combined cycles 
        in few years. These plants, with a high marginal cost, are used increasingly as 
        operational  reserve  due  to  the  development  of  non  administrable  energies, 
        causing them to be shut down most of the time, thus reducing its efficiency and 
        its profitability. 
 
 
‘Green electricity’ support instruments 
 
The  theoretical  start  point  of  renewable  energy  economic  support  in  the  electricity 
market context is the existence of externalities for environmental, security and health 
associated costs in conventional energy plants (Finon et al, 2004).  
 
Putting it into other terms, the goal is to ensure the development of the technologies 
until  grid  parity  is  reached.  Grid  parity  is  defined  as  the  point  where  renewable 
electricity is equal or cheaper than the reference cost for grid power. This point could 
be  achieved  by  2016  for  Spanish  PV,  and  will  differ  for  different  technologies  and 
countries.  Nevertheless  the  achievement  of  grid  parity  does  not  have  to  mean  the 
removal of incentive regimes (KPMG, 2009). 
 
To overcome this “market failure”, the first idea that comes into mind is to introduce a 
direct pollution tax to make producers pay for actual environmental costs, for example 
a  CO2  emissions  tax.  Other  instruments  have  been  developed  that  differ  from  a 
genuine  “green  tax”,  but  which  pursue  the  same  objective,  in  environmental  and 
economical terms, such as: 
    - voluntary market based on a certification for renewables, which consumers will 
         buy with an extra cost (“origin guaranties”) 
    - granted costs for every renewable kWh 
    - tendering systems 
    - quota exchange systems 
 
In  Europe,  Member  States  are  required  by  different  Directives  to  support  electricity 
from  renewable  energy  sources.  Countries  are  given  freedom  to  choose  their 
preferred  support  scheme.  Given  different  national  priorities  and  segmentation  in 
electricity  market  (despite  the  market  opening  since  early  2000’s),  the  support 
schemes differ in each country and we can state that the 27 Member States operate 
27 different support schemes. No harmonisation is foreseen at the short‐middle term, 
and a coordinated approach is preferred (European Commission, 2008).  
 
Implemented  policy  tools  in  Europe  and  worldwide  can  be  divided  into  two  main 
categories:  price‐based  instruments  and  quantity‐based  instruments.  Price‐based 
instruments  (as  Feed‐in  Tariffs  or  Premiums,  as  developed  in  Germany,  France  or 
Spain)  will  fix  a  price  for  electricity,  and  the  quantity  will  be  determined  by  industry 
development and market evolution. Quantity‐based instruments, on the contrary, will 
fix  an  established  volume  of  energy  or  power  for  the  country,  communities  or 
companies, and the price will be set by the competition between operators. Examples 
for  quantity‐based  instruments  are  green  certificates  (UK,  Belgium,  Italy,  Sweden)  or 
tendering systems (Ireland, France). 
 
FIT and premiums 
In a Feed‐in Tariffs (FIT) scheme, producers are granted an amount of money for every 
kWh generated. This can be a fixed tariff or a premium paid on top of the electricity 
market  price.  The  utility  is  obliged  to  purchase  all  electricity  generated,  or  to  give  it 
preference,  with  the  generator  obliged  to  sell  all  electricity  generated  to  the  utility. 
The tariff or premium is granted for a long period of time, typically 15‐20 years. This 
provides a long term degree of certainty, thus lowering the market risk.  Rates can be 
differentiated based on RE source, technology type, capacity size, the date the system 
becomes operational, or location of the project. Tariff adjustments can be made in the 
future, based on inflation or on installed capacity or generation costs (Burgie, 2009). 
 
Quota Obligations 
Under a quota obligation, governments impose an obligation on consumers, suppliers 
or producers to source a certain percentage of their electricity from renewable energy. 
This  obligation  is  usually  facilitated  by  tradable  green  certificates.  Accordingly, 
renewable electricity producers sell the electricity at the market price, but can also sell 
green certificates, which prove the renewable source of the electricity. Suppliers prove 
that  they  reach  their  obligation  by  buying  these  green  certificates,  or  they  pay  a 
penalty to the government (European Commission, 2008). 
 
Theoretically, this system could have great advantages that have led to a keen interest 
for  green  certificates  in  the  last  years:  it  is  in  the  line  of  electricity  market  and  is 
financed directly and equally by the operators.  
 
Nevertheless, it results on high transaction costs and high risk associated costs, which 
have been poorly taken into account in the past. Moreover, quota obligations benefits 
the  lower  cost  technologies,  already  mature,  but  doesn’t  support  emerging 
technologies with a great potential. 
 
Tendering 
In a tendering system, the Government sets an objective for the energy mix and tries 
to reach it trough a succession of tenders. As a result, the producer will get a long term 
contract at the price set in its bid, with a buying obligation for Utilities. The proposals 
are ranked from low to high until the auction is reached. 

Theoretically, tendering would allow a better control of quantities that have to be paid 
to  renewables,  would  limit  global  costs  as  they  support  in  the  first  place  the  lower 
costs  technologies  and  would  stimulate  innovation.  In  practice,  nevertheless,  the 
experiences have not been so positive.  
 
Other systems 
Other instruments, such as voluntary agreements, CO2 taxes, investment incentives or 
Fiscal  incentives  (tax  exemptions  or  reductions),  obligations  on  fuel  suppliers,  public 
procurement policy, research and development... are mainly used as a complement, in 
addition to the main support scheme.  
 
Comparison between support instruments 
The  European  Commission  (2008)  has  measured  the  success  of  a  policy  with  its 
effectiveness  in  increasing  renewable  electricity  generation  and  by  the  level  of 
payment  received  by  generators  in  comparison  to  the  level  they  require  for 
profitability. 
 
As a general rule, the criteria for evaluating the support system quality can be summed 
up as: 1‐a reasonable cost for community, 2‐system stability, 3‐avoiding administrative 
barriers and 4‐ensuring grid access. 
 
As  we  will  further  discuss,  although  the  Spanish  system  was  well  rated  in  the  2008 
European  Commission's  study,  in  practise  some  of  these  criteria  have  not  been  met, 
resulting in most of the problems attributed to Spanish FIT. 
 
Today, FIT is the most prevalent renewable energy policy in the world. In Europe, with 
the  recent  shift  of  the  United  Kingdom  towards  a  combination  of  ROC  (renewable 
obligation  certificates)  and  FIT,  70%  of  member  states  have  implemented  a  feed‐in 
tariffs policy. Worldwide, forty‐five countries had adopted this kind of system in 2008 
and  even  in  North  America,  traditionally  reluctant  to  tariff  systems,  FIT  policies  have 
been  implemented  in  some  US  states  and  in  a  Canadian  province  (Ontario)  and  are 
being carefully considered in a number of other US states (Burgie, 2009). 
 
The  European  Commission  has  been  very  favourable  in  the  past  to  green certificates 
instruments,  but  has  evolved  in  its  lasts  reports:  “Comparing  the  two  main  types  of 
support  schemes,  namely  quota  obligations  and  feed‐in  tariffs,  historic  observations 
from EU Member States suggest that feed‐in tariffs achieve greater renewable energy 
penetration, and do so at lower costs for consumers.” (European Commission, 2008) 
Tendering  was  in  place  in  the  UK  at  the  time  where  Germany  and  Denmark  started 
their  wind  development  through  a  feed‐in  tariffs  system.  The  comparison  between 
wind industry developments in all three countries is clearly in favour of FIT (Finon et al, 
2004).  Nowadays,  it  is  generally  considered  that  tendering  is  not  a  well  adapted 
instrument  to  build  a  renewable  energy  support  policy  except  as  a  complement  for 
other  instruments  (Hadjsaïd,  2009).  In  Denmark,  for  instance,  tendering  is  used  as  a 
stimulus for the development of a particular technology –off‐shore wind.  
 
    II.     THE SPANISH FEED‐IN TARIFFS SYSTEM 
 
Spain  has  bet  on  Feed‐In  tariffs  since  early  90's,  following  Germany  and  becoming  a 
world pioneer and leader in this kind of policy. 

The  basis  for  the  current  FIT  system  was  established  in  1994  for  small  capacity 
facilities,  obliging  utilities  to  buy  the  renewable  electricity  surplus  at  a  price  that 
depended  on  retail  price.  With  the  opening  of  the  market,  developed  with  Royal 
Decree (RD) 2818/1998, the producers could sell their energy directly in the market or 
at  a  fixed  tariff.  Later,  RD  436/2004  introduced  the  obligation  of  forecasting  when 
penalizing  deviations  between  energy  prediction  and  real  production,  and  gave  the 
possibility of choosing between a fixed tariff or the market price plus a fixed premium. 
RD  661/2007  separates  finally  the  support  from  the  reference  electricity  price  (the 
tariff or premium is not a % of the electricity price any more). It also introduces a cap 
and  floor  for  some  technologies  to  avoid  a  too  high  or  too  low  retribution  due  to 
possible strong fluctuations of spot market price. In 2008, RD 1578/2008 introduced a 
quota  and  registry  for  solar  plants,  which  was  also  applied  for  the  rest  of  the 
technologies included in the “Special Regime” (i.e.: all renewables and CHP plants with 
less than 50MW) in 2009. In 2010 a new Royal Decree is expected to come. 
 
Next, will be described the most relevant differentiating characteristics of Spanish FIT 
and its evolution. 
 
     • Electricity market agents 
Since  the  liberalisation  of  the  market,  the  different  agents  have  to  be  juridically 
separated  to  avoid  vertical  integration.  The  following  agents  participate  in  the 
generation market: 
     - Producer 
     - Independent System Operator (REE): is in charge of the technical management 
          of the system and of the security of supply 
     - Independent Market Operator (OMEL) 
     - Independent  regulatory  body  (CNE):  regulates  the  system  and  centralises  all 
          the information 
     - Utilities: own the lines and distribute the electricity 
     - Representative  agent:  acts  as  the  speaker  between  producers  and  other 
          agents. 
 
It is interesting to note that the representative agent is given the possibility to have a 
so‐called  “portfolio  effect”,  i.e.  to  send  predictions  of  many  plants  in  the  same 
programme unit (like a virtual plant), thus consolidating its deviations. This leads to an 
easier management of supply for the System Operator, as well as reduced deviations 
costs for generators. 

    • Choosing between tariff or market 
A big particularity of Spanish FIT system is that producers can opt for either getting a 
fixed tariff per kWh produced or being paid a premium on top of market price.  
 
Premium  FITs  have  the  advantage  of  introducing  competition  between  producers  in 
the  electricity  market  and  helping  to  give  an  incentive  to  renewable  electricity 
production during peak periods. To avoid excessive costs when prices rise or too low 
income for producers when prices sink, Spain has introduced in 2007 a cap and floor 
system  which  “restrains”  the  final  price.  Today,  cap  and  floor  exists  for  wind  power, 
small hydropower, biomass and biogas, whereas photovoltaic can opt only for a fixed 
tariff.  
 
                                                Caso de Tarifa Regulada b.7.1
                                                                                                                                                                                                      Caso de la opción Mercado + Prima
Precio Horario Electricidad (€/MWh)
                                                                                                                                                  140
90

80
                                                                                                                                                  120

70
                                                                                                                                                  100
60
                                                                                                                                                                                                                                                                 Prima opción Mercado (€/MWh)
50                                                                                                               Prima Equivalente                80                                                                                                             Precio horario Mercado (€/MWh)
                                                                                                                 Precio horario Mercado (€/MWh)
40                                                                                                                                                                                                                                                                      Techo
                                                                                                                                                  60
30
                                                                                                                                                                                                                                                                        Suelo

20                                                                                                                                                40


10
                                                                                                                                                  20

    0
        H1   H2   H3   H4   H5   H6   H7   H8   H9 H10 H11 H12 H13 H14 H15 H16 H17 H18 H19 H20 H21 H22 H23 H24                                     0
                                                            Horas                                                                                       H1   H2   H3   H4   H5   H6   H7   H8   H9 H10 H11 H12 H13 H14 H15 H16 H17 H18 H19 H20 H21 H22 H23 H24


Figure 1: Illustration of the two market options: fixed tariff and premium on top of spot price with cap 
         and  floor.  For  tariff  option,  the  (variable)  difference  between  tariff  and  spot  price  is  called 
         “equivalent premium” 
 
    • Forecasts 
Few  countries  require  RE  generators  to  forecast  their  output  and  to  provide  this 
information  to  grid  operators  (Spain,  Slovenia,  Estonia):  since  November,  2009, 
Spanish generators over 450kW are required to forecast their generation 24 hours in 
advance,  or  through  the  intraday  market  (until  that  date,  forecasting  was  requested 
only for plants bigger than 1MW). 
 
However, only Spain charges generators if their actual electricity output deviates from 
their predictions. A deviation may incur in a penalty if this deviation goes against the 
regulating  system.  That  means  that  if  a  generator  has  produced  more  energy  than 
forecasted,  and  that  the  global  system  has  less  energy  than  predicted,  then  the 
deviations of this particular generator will have no cost, and vice‐versa. 
 
    • Daily markets 
To allow better adjustments of forecasting and actual production, and to sharpen the 
System Operator regulation, several markets have been established: 
 
The day‐ahead market (spot market) is a physical market in which prices and amounts 
are  based  on  supply  and  demand.  It  takes  place  in  one  daily  session  and  fixes  the 
trading for the 24 hours of the next day.  
 
The  intraday  market  has  been  established  in  order  to  introduce  adjustments  to  the 
day‐ahead  market.  This  way,  the  operators  can  adjust  the  forecasts  to  the  real 
production,  resulting  in  a  better  regulation  of  power  market  and  reducing  the 
deviations.  It  is  developed  in  six  different  intraday  sessions,  and  the  new  bids  or 
adjustments to the spot market can be introduced three to four hours before the next 
session. 
 
In  addition  to  these,  technical  restrictions  and  deviations  from  predictions  are 
regulated  through  a  regulating  power  market  and  a  balancing  market,  with  different 
prices. 
 
    • Differentiated support levels 
Tariff levels have been set to get a rate of return of 7% after tax (Kema, 2009). Both 
the  tariff  and  premium  option  are  differentiated  by  technology  and  by  size  ‐through 
capacity thresholds‐ to take into account economies of scale in larger plants. Capacity 
thresholds, however, instead of linear capacity progression can lead RE developers to 
size  to  the  limit  of  the  highest  rate,  focusing  on  capacity  rather  than  actual  output 
(Burgie,  2009).  Note  that  Spain  was  the  first  country  to  introduce  a  FIT  for  solar 
thermal technology. 

Whenever  the  fixed  tariff  option  has  been  chosen,  generators  can  receive 
differentiated FITs for peak or off‐peak hours.  CHP (incl. biomass CHP) in peak hours 
will receive a bonus of +37% of the tariff and a penalisation of ‐36% in off‐peak (small 
hydro and biomass can have a more limited bonus and penalisation). 
 
Moreover,  to  discourage  speculative  queuing  grid  access  deposits  are  required: 
500€/kW for photovoltaic and 20€/kW for the rest of the special regime. 

Note  that  biomass  pricing  has  been  difficult.  At  first,  market  for  biomass  did  not 
respond to FIT comparably to solar or wind, as happened as well in Germany (Kema, 
2009). This technology, with slower reaction times and very particular challenges (fuel 
supply logistics, feed stocks, diversity of technologies, etc.), needed a higher support 
level  and  longer  to  be  pushed  up.  Now  in  Spain  we  assist  to  an  incipient  but 
generalised development in the whole country of biogas and waste biomass plants. 
 
In case of voltage dips (short drops in voltage in a system), a decoupling from the grid 
is  required  for  security  reasons.  This  can  lead  however  to  the  decoupling  of  a  whole 
wind  farm,  which  can  totally  destabilise  the  electric  system.  There  has  been  a  great 
effort  made  in  Spain  (although  not  yet  implemented  in  Portugal,  which  affects  the 
Iberian electric system) to make wind power farms able to ride through these electric 
faults. Wind installations capable for short drop in voltage may perceive an economic 
incentive. Thus, according to Red Eléctrica de España, in 2009 the biggest wind power 
loss due to voltage dips has been 700MW despite having a total installed capacity of 
19.000MW. This complement may be introduced also for photovoltaic in the future. 
 
     • FIT adjustment and revision 
In Spain, the tariffs and premiums are fixed for the entire life of the plant. The level of 
support  decreases  however  for  some  technologies:  after  15  years  for  biomass  and 
biogas, and after 25 years for photovoltaic. 
 
These  tariffs  are  planned  to  be  inflation  adjusted  yearly  according  to  the  consumer 
price  index  (CPI)  and  fuel  prices.  This  is  a  way  to  protect  investors,  which  are 
committed to renewable energy project for as much as forty years (Burgie, 2009).  
 
Revision  is  a  broader  process  in  which  the  FIT  may  be  substantively  altered.  RD 
661/2007  established  that,  as  85%  of  capacity  cap  for  2010  would  be  covered,  they 
would be given at least 12 months to receive the same tariff, which happened for solar 
already in 2007. Table 1 shows the rate of fulfillment of these caps in April 2010, and 
shows that the 85% capacity cap has been exceeded for solar and for wind. 
 
                                           Installed      Capacity  cap  Rate         of 
                                           capacity (MW)  (MW)           fulfilment (%) 
CHP                                        6.312            9.215          68% 
Solar PV                                   3.472            1.331          261% 
Solar termal                               136              500            27% 
Wind                                       18.401           20.155         91% 
Wind (repowering)                          0                2.000          0% 

                                           1.405            2.400          59% 
Small hydro =< 10MW 
Biomass                                    510               1.317         39% 
Biogas and manure                          180               250           72% 
Solid waste                                279               350           80% 
Table 1: Capacity caps and rate of fulfilment in April 2010 (CNE, 2010) 

    •    RE Quotas 

After  the  unexpected  boom  of  PV  in  2008,  the  government  decided  to  set  a  solar 
quota,  not  only  through  a  new  cap  for  2009,  2010,  and  so  on,  but  also  with  the 
addition of a registry that will keep record of each new project. If the quota is reached, 
the actual tariff decreases each year 10%, starting in 2009 with 32 c€/kWh. 

This  quotas  and  registry  system  was  extended  to  the  rest  of  the  Special  Regime  in 
2009, to break down an incipient “bubble” in solar thermal technology. 
 
Analysis of the Spanish case and lessons learned 
If we analyse the development of renewable electricity in Spain with its FIT system in 
terms  of  its  effectiveness  in  increasing  installed  capacity  and  energy  generation,  the 
results  are  quite  spectacular  (Figure  2).  Nevertheless  since  2007  we  have  assisted  to 
several sudden changes in regulation that show the difficulties of the system adopted. 
Let us analyse this turbulent evolution and other critics raised to Spanish FITs. 
 
    1. The evolution of RE installation and of changing legislation 
35.000

  30.000

                                                                            TRAT.RESIDUOS
  25.000
                                                                            RESIDUOS
  20.000                                                                    BIOMASA
                                                                            HIDRÁULICA
  15.000                                                                    EÓLICA
                                                                            SOLAR
  10.000
                                                                            COGENERACIÓN

   5.000

       0
        90

               92

                      94

                             96

                                    98

                                           00

                                                  02

                                                         04

                                                                06

                                                                       08
      19

             19

                    19

                           19

                                  19

                                         20

                                                20

                                                       20

                                                              20

                                                                     20
                                           MW
                                                                                             
Figure 2: Evolution of installed capacity of technologies in Special Regime in Spain (CNE, 2010). 
 
Despite  a  relatively  stable  policy  in  theory  (Spain  is  the  only  country  to  date  where 
tariffs are granted during the whole lifetime of the installation), investor certainty has 
not been provided.  
 
If we look at the boom and burst of solar PV in Spain, we see that in august 2007 the 
85%  of  the  2010  capacity  cap  set  for  solar  had  already  been  reached.  A  revision  of 
tariffs  was  expected  for  September  2008,  but  the  new  tariff  was  not  known  before. 
This led to a great uncertainty among project developers, who rushed to complete PV 
projects on time for fear of getting a lower tariff (which could have even lead to fraud 
in  some  cases).    This  caused  a  spectacular  increase  in  PV  capacity  in  2008  (Figure  2) 
and  caused  the  developers  rush  installing  new  plants  which  could  lead  to  an 
overdevelopment and lock‐in of inferior technologies at the best resource sites. As he 
himself  claimed,  the  government  had  relied  on  the  forecasts  of  industry  associations 
and  could  not  keep  track  of  the  actual  projects  that  were  being  installed.  The  2008 
result was therefore a surprise for them. Actually, in 2010 the 2010 capacity cap has been 
exceeded by a 261% (Table 1).  After this, the government decided to create a registry 
for  new  projects  (first  for  photovoltaic,  and  then  for  the  rest  of  technologies),  as 
described before, and a degressive tariff after the reach of a quota. 
 
The  uncertainty  goes  on  today:  a  global  revision  of  retributive  system  seems  to  be 
currently  on  the  table,  but  no  official  draft  has  been  released  yet.  In  2010  after 
denunciation in press of possible frauds in PV, rumors have been circulating on radical 
tariff  cuts  and  even  on  the  possibility  of  being  retroactive,  which  have  lead  to  a 
collapse  on  the  stock  exchange  for  renewables  industry  and  to  the  halting  of  new 
investments.  In  2010  is  also  expected  a  new  “Renewable  Energy  Plan”  (former  plan 
was in force 2005‐2010) and the revision of the Special Regime Royal Decree.  

On the other hand, the tariff set for PV has been criticised for being set too high from 
the outset (similar tariffs than in Germany with much more sunshine). A balance has to 
be found between a sufficient FIT that will allow the development of a yet unmature 
technology  and  a  too  high  tariff  that  incentivise  a  technology  still  inefficient, 
uneconomic or even speculative.  
 
 
    2. Cost for the community 
 
Despite a rise on fuel prices and therefore on generation costs and electricity prices, the 
consumer tariffs where not correspondingly increased by the government. This decoupling 
between  the  electricity  tariff  and  the  actual  cost  was  made  possible  with  the  RD 
1432/2002 and has created the so‐called “energy deficit”: difference between the amount 
collected from consumers through the tariff set by the Government and the actual costs of 
generation, transportation, distribution, etc. The different items included in this cost and 
their  distribution  in  volume  are  detailed  in  Figure  3.  This  deficit  will  be  amortized  in  the 
next  years,  therefore  it  is  a  debt  to  be  paid  for  future  consumers  although  created  by 
current consumption. 
 
Special  Regime  FITs  were  included  into  this  consumer’s  tariff,  representing  37%  of  2010 
total  costs.  Even  if  the  rise  in  renewables  and  CHP  retribution  cannot  be  considered  the 
sole  cause  of  the  energy  deficit,  the  exponential  increase  of  solar  in  2008  with  its  high 
retribution  had  a  relevant  impact  on  the  actual  costs  and  therefore  on  the  deficit.  Thus, 
the  Government  himself  stated  in  the  decree  1578/2008,  despite  his  declared 
commitment  towards  renewables,  that  "Energy  sources  under  this  special  regime 
constitute a risk for the system's sustainability because of their effects on power prices." 
This  suggests  that  RE  were  blamed  for  the energy  deficit,  as the  tariff has  not  risen  that 
much. 

The total payment for renewables and CHP amounted in April 2010 €660 million, from 
which  FV  and  wind  power  were  both  paid  about  €210  million.  For  2009  tariffs  and 
premiums paid for RE amounted for 5.000 million (CNE, 2010). 

The energy deficit, however, is not circumstantial but really structural, as it has been used 
by  the  government  as  a  strategy  to  fix  a  consumption  tariff  whose  maximum  rise  was 
determined in advance: electricity rates were kept artificially low.  

                              Otros costes
          Servicio gestión        3%
         interrumpibilida
                  d
                                         Transporte
                 3%
                                             9%


          Primas Régimen                                Distribución
              Especial                                      31%
                37%


                              Déficit tarifario
               Moratoria           11%                Compensación 
                Nuclear                               extrapeninsular
                  0%                                        6%
                                                                         
Figure 3: Distribution of the different costs in the access toll of consumption electricity tariff (BOE, 2009) 
 
 
3. Impact on prices: reaching zero spot prices 
 
Figure 4 describes the price fixation based on merit order, while crossing demand and 
supply  curves.  The  demand  curve  is  inelastic;  therefore  minor  changes  in  the  supply 
can  result  in  major  price  changes.  As  renewable  power,  like  wind  or  solar,  has  a  low 
marginal  cost  due  to  zero  fuel  costs,  their  bids  enter  the  supply  curve  at  the  lowest 
level. This shifts the supply curve to the right, resulting in a lower power price.  This 
‘merit  order  effect’  can  range,  according  to  various  studies,  3‐23€/MWh  for  wind 
power  (Morthost,  2010).  The  total  amount  of  savings  made  due  to  the  wind  power 
penetration has been evaluated within a range of €1.3‐5 billion per year in Germany or 
€0.1 billion for 2006 in Denmark. 


Figure 4:  Demand and supply curve for price fixation (www.omel.es) 
 
In Spain, GELABERT et al. (2009) have concluded that an increase in the generation of 
renewable  energy  sources  under  the  Special  Regime  by  1  GWh  would  result  in  a 
decrease on electricity prices by around 2.5 Euros on average, or around 5%. However, 
the decrease of electricity price (pool) will not directly affect consumers, as price is set 
by tendering.  
 
It  is  nevertheless  important  to  note  that  this  effect  can  be  just  temporary  because 
“when this decrease in electricity prices takes place, the signal for investment is also 
reduced  and  thus  future  investments  are  reduced,  bringing  about  a  subsequent 
increase  in  electricity  prices.  In  addition,  when  market  power  exists,  traditional 
producers may bid higher in order to keep the price level as before” (GELABERT et al, 
2009).  
 
The merit order effect can eventually result in zero spot prices, part of which can be 
attributed  to  renewable  power  generation.  Low  or  zero  spot  price  results  in  lower 
incomes for generators, but also in a lower cost for the general system. Nevertheless, 
Spanish government and energy producers consider this as a failure of the system and 
ways of avoiding it are being discussed. The whole electricity system could be revised 
and Special Regime could be taken off the spot market. 
 
During  the  first  four  months  of  2010,  Spanish  market  has  experienced  293  hours  of 
zero  spot  prices  (CNE,  2010),  i.e.  10%  of  the  total  amount  of  hours.  This  can  be 
attributed to the high production of wind and hydro power and a lower demand. 
 
To finish, we can note that the Spanish system “special regime” has not been thought 
for  broad  distributed  generation.  This  makes  Spanish  goals  different  from  Germany 
(where one third of Germany’s wind power is owned by 200.000 local landowners) or 
Denmark (where 150.000 families own 80% of installed turbines) (WFC, 2009). This is 
not necessarily a planning error, but makes it more difficult to implement a distributed 
generation system where renewable energies supply local demand and go beyond the 
problems created by a centralised regime. 
 
 
      III.     FINAL REMARKS 
 
Spain has embraced more than 15 years ago a green electricity support policy which 
has since then proven to be one of the most efficient tools for promoting renewable 
energies  in  the  electricity  market.  This  pioneer  position  can  explain  some  of  the 
difficulties  experienced  by  the  successive  governments  which  have  lead  to  a  major 
discussion on the sustainability of the system. 
 
Anyway, difficulties should not make us forget the innovative and interesting solutions 
implemented  in  Spanish  market  to  ensure  a  great  and  high  quality  integration  of 
electricity from renewable energy sources: ‘Green’ electricity represented almost 40% 
of the electricity generation in April 2010. 
 
The  main  difficulty  is  perhaps  the  lack  of  a  consistent,  clearly  defined,  long‐term 
strategy,  which  leads  therefore  to  a  great  uncertainty  for  investors  and  project 
developers. 
 
It  is  certain  that  it  is  difficult  to  adjust  a  tariff  from  the  outset  for  a  new,  immature 
technology as was the photovoltaic; but effectively the tariff seemed to have been set 
to high, without a good capacity cap control, encouraging uncontrolled development 
and  promoting  quantitative  capacity  increase  at  the  expense  of  quality  and  with  an 
exponential  costs  escalation.  A  well  defined  revision  mechanism  and  a  degressive 
tariff, among other measures, could have helped. 
 
An  additional  problem  was  the  decoupling  between  actual  generation  costs  and 
consumers  tariff  due  to  a  political  decision  to  contain  the  tariff  rise.  As  the  amount 
paid to FIT system grows, the debt for future consumers due to energy deficit has to be 
kept, entering a vicious circle.  
 
Again, the numerous and sudden legislative adjustments to try to solve the detected 
problems have contributed to investors uncertainty. 2010 might be a key year to solve 
this uncertainty and design a new, re‐adapted system. 
 
 
REFERENCES 
 
  BOE (2009): Orden ITC/3519/2009, de 28 de diciembre, por la que se revisan los peajes 
  de  acceso  a  partir  de  1  de  enero  de  2010  y  las  tarifas  y  primas  de  las  instalaciones  de 
  régimen especial 
  BURGIE,  B.  and  CRANDALL,  K.  (2009):    The  Application  of  Feed‐in  Tariffs  and  Other 
  incentives  to  Promote  Renewable  Energy  in  Colorado,  Colorado  Public  Utilities 
  Commission, Denver 
  CNE (2010): “Informe mensual de ventas de energía del régimen especial”, 10/04/2010 
  COMISIÓN  EUROPEA  (2008):  The  support  of  electricity  from  renewable  energy  sources, 
  SEC(2008)57. 
  COMISIÓN EUROPEA (2009): The renewable energy progress report, SEC(2009) 503 final. 
  DECC (2010) : Feed in Tariffs. Government’s response to the Summer 2009 consultation, 
  Department of Energy & Climate Change, London. 
  DEL RÍO, P. (2009): “La Promoción de la electricidad renovable en España en el contexto 
  europeo”, ICE nº 847 
  DELOITTE (2009): Estudio macroeconómico del impacto del sector eólico en España 
  FINON, D. and MENANTEAU, P. (2004): “La promotion des énergies renouvelables dans 
  les  nouveaux  marchés  électriques  concurrentiels »,  Anales  des  Mines‐Réalités 
  Industrielles 
  FRONDEL D., RITTER, N. and VANCE, C. (2009): Economic impacts from the promotion of 
  renewable energies: the German experience, RWI 
  GELABERT, L., LINARES, P. and LABANDEIRA, X. (2009) 'Renewable Energy and Electricity 
  Prices in Spain', Working Paper AEEE 09‐2009 
  HADJSAÏD,  N.(2010):  La  distribution  d’énergie  électrique  en  présence  de  production 
  décentralisée, Lavoisier. 
  KEMA(2009): California Feed‐In Tariff design and policy options, Oakland 
  KPMG (2009): Informe estratégico para el sector fotovoltaico en España: acercándonos a 
  la paridad de red 
  MITYC  (2010):  “Energías  renovables:  situación  y  objetivos”,  Ministerio  de  Industria, 
  Turismo y Comercio. April 2010, Madrid. 
  MORTHOST, P. E. et. Al  (2010): Wind energy and electricity prices. Exploring the ‘merit 
  order effect’, Pöyry.  
  WFC(2009): FITness testing: Exploring the myths and misconceptions about feed‐in tariff 
  policies, World Future Council, Washington 

Contenu connexe

Tendances

Future Electricity Markets: key pillars with high shares of wind and PV
Future Electricity Markets: key pillars with high shares of wind and PVFuture Electricity Markets: key pillars with high shares of wind and PV
Future Electricity Markets: key pillars with high shares of wind and PVLeonardo ENERGY
 
Recent IEA analyses on behind-the-meter energy system trends
Recent IEA analyses on behind-the-meter energy system trendsRecent IEA analyses on behind-the-meter energy system trends
Recent IEA analyses on behind-the-meter energy system trendsLeonardo ENERGY
 
How to reach the hard-to-reach (energy users)?
How to reach the hard-to-reach (energy users)?How to reach the hard-to-reach (energy users)?
How to reach the hard-to-reach (energy users)?Leonardo ENERGY
 
Electrification in the energy transition: towards net-zero emissions by 2050
Electrification in the energy transition: towards net-zero emissions by 2050Electrification in the energy transition: towards net-zero emissions by 2050
Electrification in the energy transition: towards net-zero emissions by 2050Leonardo ENERGY
 
Christophe Dromacque, VaasaETT: Overview of European residential markets - Fo...
Christophe Dromacque, VaasaETT: Overview of European residential markets - Fo...Christophe Dromacque, VaasaETT: Overview of European residential markets - Fo...
Christophe Dromacque, VaasaETT: Overview of European residential markets - Fo...VaasaETT
 
IRJET- Demand Response Optimization using Genetic Algorithm and Particle Swar...
IRJET- Demand Response Optimization using Genetic Algorithm and Particle Swar...IRJET- Demand Response Optimization using Genetic Algorithm and Particle Swar...
IRJET- Demand Response Optimization using Genetic Algorithm and Particle Swar...IRJET Journal
 
Lessons from renewable energy laws - how do countries legislate to support re...
Lessons from renewable energy laws - how do countries legislate to support re...Lessons from renewable energy laws - how do countries legislate to support re...
Lessons from renewable energy laws - how do countries legislate to support re...Leonardo ENERGY
 
Energy Sufficiency Indicators and Policies (Lea Gynther, Motiva)
Energy Sufficiency Indicators and Policies (Lea Gynther, Motiva)Energy Sufficiency Indicators and Policies (Lea Gynther, Motiva)
Energy Sufficiency Indicators and Policies (Lea Gynther, Motiva)Leonardo ENERGY
 
Japan power sector liberalization
Japan power sector liberalization Japan power sector liberalization
Japan power sector liberalization Rohit vijay
 
Energy-intensive industries – energy efficiency policies and evaluations
Energy-intensive industries – energy efficiency policies and evaluationsEnergy-intensive industries – energy efficiency policies and evaluations
Energy-intensive industries – energy efficiency policies and evaluationsLeonardo ENERGY
 
European Power Quality Survey Report
European Power Quality Survey ReportEuropean Power Quality Survey Report
European Power Quality Survey ReportLeonardo ENERGY
 
Kathmandu | Apr-15 | Interactions Between Productive Use of Energy and Access...
Kathmandu | Apr-15 | Interactions Between Productive Use of Energy and Access...Kathmandu | Apr-15 | Interactions Between Productive Use of Energy and Access...
Kathmandu | Apr-15 | Interactions Between Productive Use of Energy and Access...Smart Villages
 
A Path Towards Energy Efficient India-Unnat Jyoti by Affordable LEDs for All ...
A Path Towards Energy Efficient India-Unnat Jyoti by Affordable LEDs for All ...A Path Towards Energy Efficient India-Unnat Jyoti by Affordable LEDs for All ...
A Path Towards Energy Efficient India-Unnat Jyoti by Affordable LEDs for All ...Rohit vijay
 
Christophe Dromacque, VaasaETT: Ademe & WEC Energy Efficiency Policies 2013 -...
Christophe Dromacque, VaasaETT: Ademe & WEC Energy Efficiency Policies 2013 -...Christophe Dromacque, VaasaETT: Ademe & WEC Energy Efficiency Policies 2013 -...
Christophe Dromacque, VaasaETT: Ademe & WEC Energy Efficiency Policies 2013 -...VaasaETT
 
Christophe Dromacque, VaasaETT: Empower Demand
Christophe Dromacque, VaasaETT: Empower DemandChristophe Dromacque, VaasaETT: Empower Demand
Christophe Dromacque, VaasaETT: Empower DemandVaasaETT
 
White certificates and other incentives for energy efficiency and renewables ...
White certificates and other incentives for energy efficiency and renewables ...White certificates and other incentives for energy efficiency and renewables ...
White certificates and other incentives for energy efficiency and renewables ...Dario Di Santo
 
Q24133141
Q24133141Q24133141
Q24133141aijbm
 

Tendances (20)

Future Electricity Markets: key pillars with high shares of wind and PV
Future Electricity Markets: key pillars with high shares of wind and PVFuture Electricity Markets: key pillars with high shares of wind and PV
Future Electricity Markets: key pillars with high shares of wind and PV
 
Recent IEA analyses on behind-the-meter energy system trends
Recent IEA analyses on behind-the-meter energy system trendsRecent IEA analyses on behind-the-meter energy system trends
Recent IEA analyses on behind-the-meter energy system trends
 
How to reach the hard-to-reach (energy users)?
How to reach the hard-to-reach (energy users)?How to reach the hard-to-reach (energy users)?
How to reach the hard-to-reach (energy users)?
 
Electrification in the energy transition: towards net-zero emissions by 2050
Electrification in the energy transition: towards net-zero emissions by 2050Electrification in the energy transition: towards net-zero emissions by 2050
Electrification in the energy transition: towards net-zero emissions by 2050
 
How scenarios can facilitate local energy planning in cities
How scenarios can facilitate local energy planning in citiesHow scenarios can facilitate local energy planning in cities
How scenarios can facilitate local energy planning in cities
 
Christophe Dromacque, VaasaETT: Overview of European residential markets - Fo...
Christophe Dromacque, VaasaETT: Overview of European residential markets - Fo...Christophe Dromacque, VaasaETT: Overview of European residential markets - Fo...
Christophe Dromacque, VaasaETT: Overview of European residential markets - Fo...
 
Beebryte - Community Solar Self-Consumption (White Paper)
Beebryte - Community Solar Self-Consumption (White Paper)Beebryte - Community Solar Self-Consumption (White Paper)
Beebryte - Community Solar Self-Consumption (White Paper)
 
IRJET- Demand Response Optimization using Genetic Algorithm and Particle Swar...
IRJET- Demand Response Optimization using Genetic Algorithm and Particle Swar...IRJET- Demand Response Optimization using Genetic Algorithm and Particle Swar...
IRJET- Demand Response Optimization using Genetic Algorithm and Particle Swar...
 
Lessons from renewable energy laws - how do countries legislate to support re...
Lessons from renewable energy laws - how do countries legislate to support re...Lessons from renewable energy laws - how do countries legislate to support re...
Lessons from renewable energy laws - how do countries legislate to support re...
 
Energy Sufficiency Indicators and Policies (Lea Gynther, Motiva)
Energy Sufficiency Indicators and Policies (Lea Gynther, Motiva)Energy Sufficiency Indicators and Policies (Lea Gynther, Motiva)
Energy Sufficiency Indicators and Policies (Lea Gynther, Motiva)
 
Japan power sector liberalization
Japan power sector liberalization Japan power sector liberalization
Japan power sector liberalization
 
Photovoltaic solar self-consumption
Photovoltaic solar self-consumptionPhotovoltaic solar self-consumption
Photovoltaic solar self-consumption
 
Energy-intensive industries – energy efficiency policies and evaluations
Energy-intensive industries – energy efficiency policies and evaluationsEnergy-intensive industries – energy efficiency policies and evaluations
Energy-intensive industries – energy efficiency policies and evaluations
 
European Power Quality Survey Report
European Power Quality Survey ReportEuropean Power Quality Survey Report
European Power Quality Survey Report
 
Kathmandu | Apr-15 | Interactions Between Productive Use of Energy and Access...
Kathmandu | Apr-15 | Interactions Between Productive Use of Energy and Access...Kathmandu | Apr-15 | Interactions Between Productive Use of Energy and Access...
Kathmandu | Apr-15 | Interactions Between Productive Use of Energy and Access...
 
A Path Towards Energy Efficient India-Unnat Jyoti by Affordable LEDs for All ...
A Path Towards Energy Efficient India-Unnat Jyoti by Affordable LEDs for All ...A Path Towards Energy Efficient India-Unnat Jyoti by Affordable LEDs for All ...
A Path Towards Energy Efficient India-Unnat Jyoti by Affordable LEDs for All ...
 
Christophe Dromacque, VaasaETT: Ademe & WEC Energy Efficiency Policies 2013 -...
Christophe Dromacque, VaasaETT: Ademe & WEC Energy Efficiency Policies 2013 -...Christophe Dromacque, VaasaETT: Ademe & WEC Energy Efficiency Policies 2013 -...
Christophe Dromacque, VaasaETT: Ademe & WEC Energy Efficiency Policies 2013 -...
 
Christophe Dromacque, VaasaETT: Empower Demand
Christophe Dromacque, VaasaETT: Empower DemandChristophe Dromacque, VaasaETT: Empower Demand
Christophe Dromacque, VaasaETT: Empower Demand
 
White certificates and other incentives for energy efficiency and renewables ...
White certificates and other incentives for energy efficiency and renewables ...White certificates and other incentives for energy efficiency and renewables ...
White certificates and other incentives for energy efficiency and renewables ...
 
Q24133141
Q24133141Q24133141
Q24133141
 

Similaire à Supporting ‘Green’ electricity: Lessons learned from the Spanish Feed‐in tariff system

Energy efficiency and coservation book
Energy efficiency and coservation bookEnergy efficiency and coservation book
Energy efficiency and coservation bookgh4687
 
Winter package is coming
Winter package is comingWinter package is coming
Winter package is comingArne Koeppel
 
The role of electricity in heating and cooling
The role of electricity in heating and coolingThe role of electricity in heating and cooling
The role of electricity in heating and coolingLeonardo ENERGY
 
Impact net metering peru version ijrer
Impact net metering   peru version ijrerImpact net metering   peru version ijrer
Impact net metering peru version ijrerDavid Daniel Humpire
 
Utilities opportunities and betterment
Utilities opportunities and bettermentUtilities opportunities and betterment
Utilities opportunities and bettermentSagar Zilpe
 
Long-term macroeconomic effects of the German Energy Transition
Long-term macroeconomic effects of the German Energy TransitionLong-term macroeconomic effects of the German Energy Transition
Long-term macroeconomic effects of the German Energy TransitionOeko-Institut
 
Wind Power Regulatory Framework Survey 2016
Wind Power Regulatory Framework  Survey 2016Wind Power Regulatory Framework  Survey 2016
Wind Power Regulatory Framework Survey 2016Stavros Thomas
 
ASOG's 2020 Working Papers on Energy
ASOG's 2020 Working Papers on EnergyASOG's 2020 Working Papers on Energy
ASOG's 2020 Working Papers on EnergyASEPCELLsProject
 
Myths and Facts about Germany's Energy Transition
Myths and Facts about Germany's Energy TransitionMyths and Facts about Germany's Energy Transition
Myths and Facts about Germany's Energy TransitionClimateCourse
 
White certificates in industry at ECEEE conference - paper
White certificates in industry at ECEEE conference - paperWhite certificates in industry at ECEEE conference - paper
White certificates in industry at ECEEE conference - paperDario Di Santo
 
Webinar - Support Schemes for Renewable Energy Development and Grid Development
Webinar - Support Schemes for Renewable Energy Development and Grid DevelopmentWebinar - Support Schemes for Renewable Energy Development and Grid Development
Webinar - Support Schemes for Renewable Energy Development and Grid DevelopmentLeonardo ENERGY
 
Energy Services Market: Conceptual Framework and Mechanism of Forming
Energy Services Market: Conceptual Framework and Mechanism of FormingEnergy Services Market: Conceptual Framework and Mechanism of Forming
Energy Services Market: Conceptual Framework and Mechanism of FormingIJCMESJOURNAL
 
Achieving competitive, sustainable and guaranteed energy
Achieving competitive, sustainable and guaranteed energyAchieving competitive, sustainable and guaranteed energy
Achieving competitive, sustainable and guaranteed energyCírculo de Empresarios
 
Smart energy innovation may17 (3)
Smart energy innovation   may17 (3)Smart energy innovation   may17 (3)
Smart energy innovation may17 (3)Let's Learn Digital
 
Sales of Spanish green certificates in the EU
Sales of Spanish green certificates in the EUSales of Spanish green certificates in the EU
Sales of Spanish green certificates in the EUAlejo Etchart Ortiz
 
Public aid to renewables_Germany
Public aid to renewables_GermanyPublic aid to renewables_Germany
Public aid to renewables_GermanyRui_Silva
 
Energy storage - the role of electricity
Energy storage - the role of electricityEnergy storage - the role of electricity
Energy storage - the role of electricitySHARQproject
 

Similaire à Supporting ‘Green’ electricity: Lessons learned from the Spanish Feed‐in tariff system (20)

Energy efficiency and coservation book
Energy efficiency and coservation bookEnergy efficiency and coservation book
Energy efficiency and coservation book
 
Winter package is coming
Winter package is comingWinter package is coming
Winter package is coming
 
The role of electricity in heating and cooling
The role of electricity in heating and coolingThe role of electricity in heating and cooling
The role of electricity in heating and cooling
 
Impact net metering peru version ijrer
Impact net metering   peru version ijrerImpact net metering   peru version ijrer
Impact net metering peru version ijrer
 
Utilities opportunities and betterment
Utilities opportunities and bettermentUtilities opportunities and betterment
Utilities opportunities and betterment
 
Long-term macroeconomic effects of the German Energy Transition
Long-term macroeconomic effects of the German Energy TransitionLong-term macroeconomic effects of the German Energy Transition
Long-term macroeconomic effects of the German Energy Transition
 
CAPSTONE FINAL VERSION
CAPSTONE FINAL VERSIONCAPSTONE FINAL VERSION
CAPSTONE FINAL VERSION
 
Wind Power Regulatory Framework Survey 2016
Wind Power Regulatory Framework  Survey 2016Wind Power Regulatory Framework  Survey 2016
Wind Power Regulatory Framework Survey 2016
 
ASOG's 2020 Working Papers on Energy
ASOG's 2020 Working Papers on EnergyASOG's 2020 Working Papers on Energy
ASOG's 2020 Working Papers on Energy
 
Myths and Facts about Germany's Energy Transition
Myths and Facts about Germany's Energy TransitionMyths and Facts about Germany's Energy Transition
Myths and Facts about Germany's Energy Transition
 
Eci
EciEci
Eci
 
Conclusions
ConclusionsConclusions
Conclusions
 
White certificates in industry at ECEEE conference - paper
White certificates in industry at ECEEE conference - paperWhite certificates in industry at ECEEE conference - paper
White certificates in industry at ECEEE conference - paper
 
Webinar - Support Schemes for Renewable Energy Development and Grid Development
Webinar - Support Schemes for Renewable Energy Development and Grid DevelopmentWebinar - Support Schemes for Renewable Energy Development and Grid Development
Webinar - Support Schemes for Renewable Energy Development and Grid Development
 
Energy Services Market: Conceptual Framework and Mechanism of Forming
Energy Services Market: Conceptual Framework and Mechanism of FormingEnergy Services Market: Conceptual Framework and Mechanism of Forming
Energy Services Market: Conceptual Framework and Mechanism of Forming
 
Achieving competitive, sustainable and guaranteed energy
Achieving competitive, sustainable and guaranteed energyAchieving competitive, sustainable and guaranteed energy
Achieving competitive, sustainable and guaranteed energy
 
Smart energy innovation may17 (3)
Smart energy innovation   may17 (3)Smart energy innovation   may17 (3)
Smart energy innovation may17 (3)
 
Sales of Spanish green certificates in the EU
Sales of Spanish green certificates in the EUSales of Spanish green certificates in the EU
Sales of Spanish green certificates in the EU
 
Public aid to renewables_Germany
Public aid to renewables_GermanyPublic aid to renewables_Germany
Public aid to renewables_Germany
 
Energy storage - the role of electricity
Energy storage - the role of electricityEnergy storage - the role of electricity
Energy storage - the role of electricity
 

Dernier

Monthly Social Media Update April 2024 pptx.pptx
Monthly Social Media Update April 2024 pptx.pptxMonthly Social Media Update April 2024 pptx.pptx
Monthly Social Media Update April 2024 pptx.pptxAndy Lambert
 
Mysore Call Girls 8617370543 WhatsApp Number 24x7 Best Services
Mysore Call Girls 8617370543 WhatsApp Number 24x7 Best ServicesMysore Call Girls 8617370543 WhatsApp Number 24x7 Best Services
Mysore Call Girls 8617370543 WhatsApp Number 24x7 Best ServicesDipal Arora
 
MONA 98765-12871 CALL GIRLS IN LUDHIANA LUDHIANA CALL GIRL
MONA 98765-12871 CALL GIRLS IN LUDHIANA LUDHIANA CALL GIRLMONA 98765-12871 CALL GIRLS IN LUDHIANA LUDHIANA CALL GIRL
MONA 98765-12871 CALL GIRLS IN LUDHIANA LUDHIANA CALL GIRLSeo
 
Call Girls Pune Just Call 9907093804 Top Class Call Girl Service Available
Call Girls Pune Just Call 9907093804 Top Class Call Girl Service AvailableCall Girls Pune Just Call 9907093804 Top Class Call Girl Service Available
Call Girls Pune Just Call 9907093804 Top Class Call Girl Service AvailableDipal Arora
 
VIP Call Girls Gandi Maisamma ( Hyderabad ) Phone 8250192130 | ₹5k To 25k Wit...
VIP Call Girls Gandi Maisamma ( Hyderabad ) Phone 8250192130 | ₹5k To 25k Wit...VIP Call Girls Gandi Maisamma ( Hyderabad ) Phone 8250192130 | ₹5k To 25k Wit...
VIP Call Girls Gandi Maisamma ( Hyderabad ) Phone 8250192130 | ₹5k To 25k Wit...Suhani Kapoor
 
The Coffee Bean & Tea Leaf(CBTL), Business strategy case study
The Coffee Bean & Tea Leaf(CBTL), Business strategy case studyThe Coffee Bean & Tea Leaf(CBTL), Business strategy case study
The Coffee Bean & Tea Leaf(CBTL), Business strategy case studyEthan lee
 
Famous Olympic Siblings from the 21st Century
Famous Olympic Siblings from the 21st CenturyFamous Olympic Siblings from the 21st Century
Famous Olympic Siblings from the 21st Centuryrwgiffor
 
Creating Low-Code Loan Applications using the Trisotech Mortgage Feature Set
Creating Low-Code Loan Applications using the Trisotech Mortgage Feature SetCreating Low-Code Loan Applications using the Trisotech Mortgage Feature Set
Creating Low-Code Loan Applications using the Trisotech Mortgage Feature SetDenis Gagné
 
A305_A2_file_Batkhuu progress report.pdf
A305_A2_file_Batkhuu progress report.pdfA305_A2_file_Batkhuu progress report.pdf
A305_A2_file_Batkhuu progress report.pdftbatkhuu1
 
A DAY IN THE LIFE OF A SALESMAN / WOMAN
A DAY IN THE LIFE OF A  SALESMAN / WOMANA DAY IN THE LIFE OF A  SALESMAN / WOMAN
A DAY IN THE LIFE OF A SALESMAN / WOMANIlamathiKannappan
 
Unlocking the Secrets of Affiliate Marketing.pdf
Unlocking the Secrets of Affiliate Marketing.pdfUnlocking the Secrets of Affiliate Marketing.pdf
Unlocking the Secrets of Affiliate Marketing.pdfOnline Income Engine
 
Pharma Works Profile of Karan Communications
Pharma Works Profile of Karan CommunicationsPharma Works Profile of Karan Communications
Pharma Works Profile of Karan Communicationskarancommunications
 
Call Girls In Holiday Inn Express Gurugram➥99902@11544 ( Best price)100% Genu...
Call Girls In Holiday Inn Express Gurugram➥99902@11544 ( Best price)100% Genu...Call Girls In Holiday Inn Express Gurugram➥99902@11544 ( Best price)100% Genu...
Call Girls In Holiday Inn Express Gurugram➥99902@11544 ( Best price)100% Genu...lizamodels9
 
Understanding the Pakistan Budgeting Process: Basics and Key Insights
Understanding the Pakistan Budgeting Process: Basics and Key InsightsUnderstanding the Pakistan Budgeting Process: Basics and Key Insights
Understanding the Pakistan Budgeting Process: Basics and Key Insightsseri bangash
 
Call Girls Jp Nagar Just Call 👗 7737669865 👗 Top Class Call Girl Service Bang...
Call Girls Jp Nagar Just Call 👗 7737669865 👗 Top Class Call Girl Service Bang...Call Girls Jp Nagar Just Call 👗 7737669865 👗 Top Class Call Girl Service Bang...
Call Girls Jp Nagar Just Call 👗 7737669865 👗 Top Class Call Girl Service Bang...amitlee9823
 
9599632723 Top Call Girls in Delhi at your Door Step Available 24x7 Delhi
9599632723 Top Call Girls in Delhi at your Door Step Available 24x7 Delhi9599632723 Top Call Girls in Delhi at your Door Step Available 24x7 Delhi
9599632723 Top Call Girls in Delhi at your Door Step Available 24x7 DelhiCall Girls in Delhi
 
Boost the utilization of your HCL environment by reevaluating use cases and f...
Boost the utilization of your HCL environment by reevaluating use cases and f...Boost the utilization of your HCL environment by reevaluating use cases and f...
Boost the utilization of your HCL environment by reevaluating use cases and f...Roland Driesen
 
Monte Carlo simulation : Simulation using MCSM
Monte Carlo simulation : Simulation using MCSMMonte Carlo simulation : Simulation using MCSM
Monte Carlo simulation : Simulation using MCSMRavindra Nath Shukla
 
Insurers' journeys to build a mastery in the IoT usage
Insurers' journeys to build a mastery in the IoT usageInsurers' journeys to build a mastery in the IoT usage
Insurers' journeys to build a mastery in the IoT usageMatteo Carbone
 

Dernier (20)

Monthly Social Media Update April 2024 pptx.pptx
Monthly Social Media Update April 2024 pptx.pptxMonthly Social Media Update April 2024 pptx.pptx
Monthly Social Media Update April 2024 pptx.pptx
 
Mysore Call Girls 8617370543 WhatsApp Number 24x7 Best Services
Mysore Call Girls 8617370543 WhatsApp Number 24x7 Best ServicesMysore Call Girls 8617370543 WhatsApp Number 24x7 Best Services
Mysore Call Girls 8617370543 WhatsApp Number 24x7 Best Services
 
MONA 98765-12871 CALL GIRLS IN LUDHIANA LUDHIANA CALL GIRL
MONA 98765-12871 CALL GIRLS IN LUDHIANA LUDHIANA CALL GIRLMONA 98765-12871 CALL GIRLS IN LUDHIANA LUDHIANA CALL GIRL
MONA 98765-12871 CALL GIRLS IN LUDHIANA LUDHIANA CALL GIRL
 
Call Girls Pune Just Call 9907093804 Top Class Call Girl Service Available
Call Girls Pune Just Call 9907093804 Top Class Call Girl Service AvailableCall Girls Pune Just Call 9907093804 Top Class Call Girl Service Available
Call Girls Pune Just Call 9907093804 Top Class Call Girl Service Available
 
VIP Call Girls Gandi Maisamma ( Hyderabad ) Phone 8250192130 | ₹5k To 25k Wit...
VIP Call Girls Gandi Maisamma ( Hyderabad ) Phone 8250192130 | ₹5k To 25k Wit...VIP Call Girls Gandi Maisamma ( Hyderabad ) Phone 8250192130 | ₹5k To 25k Wit...
VIP Call Girls Gandi Maisamma ( Hyderabad ) Phone 8250192130 | ₹5k To 25k Wit...
 
The Coffee Bean & Tea Leaf(CBTL), Business strategy case study
The Coffee Bean & Tea Leaf(CBTL), Business strategy case studyThe Coffee Bean & Tea Leaf(CBTL), Business strategy case study
The Coffee Bean & Tea Leaf(CBTL), Business strategy case study
 
Famous Olympic Siblings from the 21st Century
Famous Olympic Siblings from the 21st CenturyFamous Olympic Siblings from the 21st Century
Famous Olympic Siblings from the 21st Century
 
Creating Low-Code Loan Applications using the Trisotech Mortgage Feature Set
Creating Low-Code Loan Applications using the Trisotech Mortgage Feature SetCreating Low-Code Loan Applications using the Trisotech Mortgage Feature Set
Creating Low-Code Loan Applications using the Trisotech Mortgage Feature Set
 
A305_A2_file_Batkhuu progress report.pdf
A305_A2_file_Batkhuu progress report.pdfA305_A2_file_Batkhuu progress report.pdf
A305_A2_file_Batkhuu progress report.pdf
 
A DAY IN THE LIFE OF A SALESMAN / WOMAN
A DAY IN THE LIFE OF A  SALESMAN / WOMANA DAY IN THE LIFE OF A  SALESMAN / WOMAN
A DAY IN THE LIFE OF A SALESMAN / WOMAN
 
Unlocking the Secrets of Affiliate Marketing.pdf
Unlocking the Secrets of Affiliate Marketing.pdfUnlocking the Secrets of Affiliate Marketing.pdf
Unlocking the Secrets of Affiliate Marketing.pdf
 
Pharma Works Profile of Karan Communications
Pharma Works Profile of Karan CommunicationsPharma Works Profile of Karan Communications
Pharma Works Profile of Karan Communications
 
Call Girls In Holiday Inn Express Gurugram➥99902@11544 ( Best price)100% Genu...
Call Girls In Holiday Inn Express Gurugram➥99902@11544 ( Best price)100% Genu...Call Girls In Holiday Inn Express Gurugram➥99902@11544 ( Best price)100% Genu...
Call Girls In Holiday Inn Express Gurugram➥99902@11544 ( Best price)100% Genu...
 
Understanding the Pakistan Budgeting Process: Basics and Key Insights
Understanding the Pakistan Budgeting Process: Basics and Key InsightsUnderstanding the Pakistan Budgeting Process: Basics and Key Insights
Understanding the Pakistan Budgeting Process: Basics and Key Insights
 
Call Girls Jp Nagar Just Call 👗 7737669865 👗 Top Class Call Girl Service Bang...
Call Girls Jp Nagar Just Call 👗 7737669865 👗 Top Class Call Girl Service Bang...Call Girls Jp Nagar Just Call 👗 7737669865 👗 Top Class Call Girl Service Bang...
Call Girls Jp Nagar Just Call 👗 7737669865 👗 Top Class Call Girl Service Bang...
 
9599632723 Top Call Girls in Delhi at your Door Step Available 24x7 Delhi
9599632723 Top Call Girls in Delhi at your Door Step Available 24x7 Delhi9599632723 Top Call Girls in Delhi at your Door Step Available 24x7 Delhi
9599632723 Top Call Girls in Delhi at your Door Step Available 24x7 Delhi
 
Boost the utilization of your HCL environment by reevaluating use cases and f...
Boost the utilization of your HCL environment by reevaluating use cases and f...Boost the utilization of your HCL environment by reevaluating use cases and f...
Boost the utilization of your HCL environment by reevaluating use cases and f...
 
Monte Carlo simulation : Simulation using MCSM
Monte Carlo simulation : Simulation using MCSMMonte Carlo simulation : Simulation using MCSM
Monte Carlo simulation : Simulation using MCSM
 
VVVIP Call Girls In Greater Kailash ➡️ Delhi ➡️ 9999965857 🚀 No Advance 24HRS...
VVVIP Call Girls In Greater Kailash ➡️ Delhi ➡️ 9999965857 🚀 No Advance 24HRS...VVVIP Call Girls In Greater Kailash ➡️ Delhi ➡️ 9999965857 🚀 No Advance 24HRS...
VVVIP Call Girls In Greater Kailash ➡️ Delhi ➡️ 9999965857 🚀 No Advance 24HRS...
 
Insurers' journeys to build a mastery in the IoT usage
Insurers' journeys to build a mastery in the IoT usageInsurers' journeys to build a mastery in the IoT usage
Insurers' journeys to build a mastery in the IoT usage
 

Supporting ‘Green’ electricity: Lessons learned from the Spanish Feed‐in tariff system

  • 1. Supporting ‘Green’ electricity:  Lessons learned from the Spanish Feed‐in tariff system    Lara Pérez Dueñas  Gnera Energía y Tecnología. Energy Consultant and Energy & Environment Engineer  lpd@gnera.es    ABSTRACT  The Spanish economic support system for electricity from renewable energy sources  has had a good reputation due to its good results in terms of number of new plants,  installed megawatts, industrial development, etc. Nevertheless, in the last years we  have assisted to major and sudden legislative changes motivated by different events  that  have  put  under  discussion  the  system  sustainability.  After  describing  the  main  green electricity support systems available and the benefits of introducing renewable  energies in  the electricity market, this paper analyses the  causes of the “boom and  burst” of the Spanish support mechanisms and the main lessons learned.    JEL code: Q4    Key‐words:  electricity  market,  renewable  energy,  feed‐in  tariff,  renewable  energy  support instruments        I. GREEN ELECTRICITY SUPPORT INSTRUMENTS    Costs and benefits of renewables in the electricity market    A  sustained  development  of  renewable  energy  (RE)  is  nowadays  still  not  possible  without    the support of dedicated policy instruments. Much debate has been made to  argue  if  renewable  energies  are  ‘too  expensive’  or  not,  leading  to  even  emotional  debates.  Actually,  the  use  of  electricity  from  renewable  energy  sources  has  several  direct  and  indirect  effects  on  energy  costs,  as  well  on  economics  and  social  issues.  Their quantification can allow us to have a more global vision of the incentives paid to  renewable  electricity  producers.  Let  us  briefly  describe  some  of  these  positive  and  negative effects:  - Environmental externalities: Actual energy costs do not include environmental  externalities:    health  issues,  energy  dependency,  energy  resources  depletion,  supply and public security, accidents, climate change, global justice…    - Economic  and  social  benefits:  Deloitte  (2009)  in  its  study  on  the  macroeconomic impact of wind energy, compares the direct cost of incentives  for  wind  power  in  Spain  to  other  quantified  benefits  such  as  CO2  emissions,  fewer fossil fuels import and other indirect economic and social benefits such  as new job creation, direct and indirect increase in PIB, R&D… Morthorst (2010)  also  states  that  “if  both  the  direct  and  indirect  cost  savings  from  renewable  energy  generation  were  taken  into  consideration,  the  net  effect  of  the  RES 
  • 2. support  scheme  would  be  negative,  that  is,  the  consumer  would  pay  lower  prices.”    - Merit  order  effect:  The  introduction  of  renewable  energy  in  an  electricity  market  where  price  setting  is  based  on  merit  order  can  result  in  lower  electricity  spot  prices  for  consumers  and  eventually  (but  not  necessarily)  in  lower retail prices, as will be further discussed.    - Opportunity cost due to additional operating reserve: Most renewable energies  are said to be “not administrable”, i.e. we cannot regulate their production on  demand  as  it  depends  mainly  on  weather  conditions  (wind,  sunlightning  or  rain) or on the lack of flexibility of the plant –which is also the case for nuclear  power. Thus, we need to grant an additional operating reserve that will ensure  the electricity supply on peak hours. Combined cycles are a valuable technology  for  operating  reserve  because  of  its  high  flexibility.  Spain  has  bet  on  this  technology and has greatly increased the installed capacity of combined cycles  in few years. These plants, with a high marginal cost, are used increasingly as  operational  reserve  due  to  the  development  of  non  administrable  energies,  causing them to be shut down most of the time, thus reducing its efficiency and  its profitability.      ‘Green electricity’ support instruments    The  theoretical  start  point  of  renewable  energy  economic  support  in  the  electricity  market context is the existence of externalities for environmental, security and health  associated costs in conventional energy plants (Finon et al, 2004).     Putting it into other terms, the goal is to ensure the development of the technologies  until  grid  parity  is  reached.  Grid  parity  is  defined  as  the  point  where  renewable  electricity is equal or cheaper than the reference cost for grid power. This point could  be  achieved  by  2016  for  Spanish  PV,  and  will  differ  for  different  technologies  and  countries.  Nevertheless  the  achievement  of  grid  parity  does  not  have  to  mean  the  removal of incentive regimes (KPMG, 2009).    To overcome this “market failure”, the first idea that comes into mind is to introduce a  direct pollution tax to make producers pay for actual environmental costs, for example  a  CO2  emissions  tax.  Other  instruments  have  been  developed  that  differ  from  a  genuine  “green  tax”,  but  which  pursue  the  same  objective,  in  environmental  and  economical terms, such as:  - voluntary market based on a certification for renewables, which consumers will  buy with an extra cost (“origin guaranties”)  - granted costs for every renewable kWh  - tendering systems  - quota exchange systems   
  • 3. In  Europe,  Member  States  are  required  by  different  Directives  to  support  electricity  from  renewable  energy  sources.  Countries  are  given  freedom  to  choose  their  preferred  support  scheme.  Given  different  national  priorities  and  segmentation  in  electricity  market  (despite  the  market  opening  since  early  2000’s),  the  support  schemes differ in each country and we can state that the 27 Member States operate  27 different support schemes. No harmonisation is foreseen at the short‐middle term,  and a coordinated approach is preferred (European Commission, 2008).     Implemented  policy  tools  in  Europe  and  worldwide  can  be  divided  into  two  main  categories:  price‐based  instruments  and  quantity‐based  instruments.  Price‐based  instruments  (as  Feed‐in  Tariffs  or  Premiums,  as  developed  in  Germany,  France  or  Spain)  will  fix  a  price  for  electricity,  and  the  quantity  will  be  determined  by  industry  development and market evolution. Quantity‐based instruments, on the contrary, will  fix  an  established  volume  of  energy  or  power  for  the  country,  communities  or  companies, and the price will be set by the competition between operators. Examples  for  quantity‐based  instruments  are  green  certificates  (UK,  Belgium,  Italy,  Sweden)  or  tendering systems (Ireland, France).    FIT and premiums  In a Feed‐in Tariffs (FIT) scheme, producers are granted an amount of money for every  kWh generated. This can be a fixed tariff or a premium paid on top of the electricity  market  price.  The  utility  is  obliged  to  purchase  all  electricity  generated,  or  to  give  it  preference,  with  the  generator  obliged  to  sell  all  electricity  generated  to  the  utility.  The tariff or premium is granted for a long period of time, typically 15‐20 years. This  provides a long term degree of certainty, thus lowering the market risk.  Rates can be  differentiated based on RE source, technology type, capacity size, the date the system  becomes operational, or location of the project. Tariff adjustments can be made in the  future, based on inflation or on installed capacity or generation costs (Burgie, 2009).    Quota Obligations  Under a quota obligation, governments impose an obligation on consumers, suppliers  or producers to source a certain percentage of their electricity from renewable energy.  This  obligation  is  usually  facilitated  by  tradable  green  certificates.  Accordingly,  renewable electricity producers sell the electricity at the market price, but can also sell  green certificates, which prove the renewable source of the electricity. Suppliers prove  that  they  reach  their  obligation  by  buying  these  green  certificates,  or  they  pay  a  penalty to the government (European Commission, 2008).    Theoretically, this system could have great advantages that have led to a keen interest  for  green  certificates  in  the  last  years:  it  is  in  the  line  of  electricity  market  and  is  financed directly and equally by the operators.     Nevertheless, it results on high transaction costs and high risk associated costs, which  have been poorly taken into account in the past. Moreover, quota obligations benefits  the  lower  cost  technologies,  already  mature,  but  doesn’t  support  emerging  technologies with a great potential. 
  • 4.   Tendering  In a tendering system, the Government sets an objective for the energy mix and tries  to reach it trough a succession of tenders. As a result, the producer will get a long term  contract at the price set in its bid, with a buying obligation for Utilities. The proposals  are ranked from low to high until the auction is reached.  Theoretically, tendering would allow a better control of quantities that have to be paid  to  renewables,  would  limit  global  costs  as  they  support  in  the  first  place  the  lower  costs  technologies  and  would  stimulate  innovation.  In  practice,  nevertheless,  the  experiences have not been so positive.     Other systems  Other instruments, such as voluntary agreements, CO2 taxes, investment incentives or  Fiscal  incentives  (tax  exemptions  or  reductions),  obligations  on  fuel  suppliers,  public  procurement policy, research and development... are mainly used as a complement, in  addition to the main support scheme.     Comparison between support instruments  The  European  Commission  (2008)  has  measured  the  success  of  a  policy  with  its  effectiveness  in  increasing  renewable  electricity  generation  and  by  the  level  of  payment  received  by  generators  in  comparison  to  the  level  they  require  for  profitability.    As a general rule, the criteria for evaluating the support system quality can be summed  up as: 1‐a reasonable cost for community, 2‐system stability, 3‐avoiding administrative  barriers and 4‐ensuring grid access.    As  we  will  further  discuss,  although  the  Spanish  system  was  well  rated  in  the  2008  European  Commission's  study,  in  practise  some  of  these  criteria  have  not  been  met,  resulting in most of the problems attributed to Spanish FIT.    Today, FIT is the most prevalent renewable energy policy in the world. In Europe, with  the  recent  shift  of  the  United  Kingdom  towards  a  combination  of  ROC  (renewable  obligation  certificates)  and  FIT,  70%  of  member  states  have  implemented  a  feed‐in  tariffs policy. Worldwide, forty‐five countries had adopted this kind of system in 2008  and  even  in  North  America,  traditionally  reluctant  to  tariff  systems,  FIT  policies  have  been  implemented  in  some  US  states  and  in  a  Canadian  province  (Ontario)  and  are  being carefully considered in a number of other US states (Burgie, 2009).    The  European  Commission  has  been  very  favourable  in  the  past  to  green certificates  instruments,  but  has  evolved  in  its  lasts  reports:  “Comparing  the  two  main  types  of  support  schemes,  namely  quota  obligations  and  feed‐in  tariffs,  historic  observations  from EU Member States suggest that feed‐in tariffs achieve greater renewable energy  penetration, and do so at lower costs for consumers.” (European Commission, 2008) 
  • 5. Tendering  was  in  place  in  the  UK  at  the  time  where  Germany  and  Denmark  started  their  wind  development  through  a  feed‐in  tariffs  system.  The  comparison  between  wind industry developments in all three countries is clearly in favour of FIT (Finon et al,  2004).  Nowadays,  it  is  generally  considered  that  tendering  is  not  a  well  adapted  instrument  to  build  a  renewable  energy  support  policy  except  as  a  complement  for  other  instruments  (Hadjsaïd,  2009).  In  Denmark,  for  instance,  tendering  is  used  as  a  stimulus for the development of a particular technology –off‐shore wind.     II. THE SPANISH FEED‐IN TARIFFS SYSTEM    Spain  has  bet  on  Feed‐In  tariffs  since  early  90's,  following  Germany  and  becoming  a  world pioneer and leader in this kind of policy.  The  basis  for  the  current  FIT  system  was  established  in  1994  for  small  capacity  facilities,  obliging  utilities  to  buy  the  renewable  electricity  surplus  at  a  price  that  depended  on  retail  price.  With  the  opening  of  the  market,  developed  with  Royal  Decree (RD) 2818/1998, the producers could sell their energy directly in the market or  at  a  fixed  tariff.  Later,  RD  436/2004  introduced  the  obligation  of  forecasting  when  penalizing  deviations  between  energy  prediction  and  real  production,  and  gave  the  possibility of choosing between a fixed tariff or the market price plus a fixed premium.  RD  661/2007  separates  finally  the  support  from  the  reference  electricity  price  (the  tariff or premium is not a % of the electricity price any more). It also introduces a cap  and  floor  for  some  technologies  to  avoid  a  too  high  or  too  low  retribution  due  to  possible strong fluctuations of spot market price. In 2008, RD 1578/2008 introduced a  quota  and  registry  for  solar  plants,  which  was  also  applied  for  the  rest  of  the  technologies included in the “Special Regime” (i.e.: all renewables and CHP plants with  less than 50MW) in 2009. In 2010 a new Royal Decree is expected to come.    Next, will be described the most relevant differentiating characteristics of Spanish FIT  and its evolution.    • Electricity market agents  Since  the  liberalisation  of  the  market,  the  different  agents  have  to  be  juridically  separated  to  avoid  vertical  integration.  The  following  agents  participate  in  the  generation market:  - Producer  - Independent System Operator (REE): is in charge of the technical management  of the system and of the security of supply  - Independent Market Operator (OMEL)  - Independent  regulatory  body  (CNE):  regulates  the  system  and  centralises  all  the information  - Utilities: own the lines and distribute the electricity  - Representative  agent:  acts  as  the  speaker  between  producers  and  other  agents.    It is interesting to note that the representative agent is given the possibility to have a  so‐called  “portfolio  effect”,  i.e.  to  send  predictions  of  many  plants  in  the  same 
  • 6. programme unit (like a virtual plant), thus consolidating its deviations. This leads to an  easier management of supply for the System Operator, as well as reduced deviations  costs for generators.  • Choosing between tariff or market  A big particularity of Spanish FIT system is that producers can opt for either getting a  fixed tariff per kWh produced or being paid a premium on top of market price.     Premium  FITs  have  the  advantage  of  introducing  competition  between  producers  in  the  electricity  market  and  helping  to  give  an  incentive  to  renewable  electricity  production during peak periods. To avoid excessive costs when prices rise or too low  income for producers when prices sink, Spain has introduced in 2007 a cap and floor  system  which  “restrains”  the  final  price.  Today,  cap  and  floor  exists  for  wind  power,  small hydropower, biomass and biogas, whereas photovoltaic can opt only for a fixed  tariff.     Caso de Tarifa Regulada b.7.1 Caso de la opción Mercado + Prima Precio Horario Electricidad (€/MWh) 140 90 80 120 70 100 60 Prima opción Mercado (€/MWh) 50 Prima Equivalente 80 Precio horario Mercado (€/MWh) Precio horario Mercado (€/MWh) 40 Techo 60 30 Suelo 20 40 10 20 0 H1 H2 H3 H4 H5 H6 H7 H8 H9 H10 H11 H12 H13 H14 H15 H16 H17 H18 H19 H20 H21 H22 H23 H24 0 Horas H1 H2 H3 H4 H5 H6 H7 H8 H9 H10 H11 H12 H13 H14 H15 H16 H17 H18 H19 H20 H21 H22 H23 H24 Figure 1: Illustration of the two market options: fixed tariff and premium on top of spot price with cap  and  floor.  For  tariff  option,  the  (variable)  difference  between  tariff  and  spot  price  is  called  “equivalent premium”    • Forecasts  Few  countries  require  RE  generators  to  forecast  their  output  and  to  provide  this  information  to  grid  operators  (Spain,  Slovenia,  Estonia):  since  November,  2009,  Spanish generators over 450kW are required to forecast their generation 24 hours in  advance,  or  through  the  intraday  market  (until  that  date,  forecasting  was  requested  only for plants bigger than 1MW).    However, only Spain charges generators if their actual electricity output deviates from  their predictions. A deviation may incur in a penalty if this deviation goes against the  regulating  system.  That  means  that  if  a  generator  has  produced  more  energy  than  forecasted,  and  that  the  global  system  has  less  energy  than  predicted,  then  the  deviations of this particular generator will have no cost, and vice‐versa.    • Daily markets  To allow better adjustments of forecasting and actual production, and to sharpen the  System Operator regulation, several markets have been established:    The day‐ahead market (spot market) is a physical market in which prices and amounts  are  based  on  supply  and  demand.  It  takes  place  in  one  daily  session  and  fixes  the  trading for the 24 hours of the next day.  
  • 7.   The  intraday  market  has  been  established  in  order  to  introduce  adjustments  to  the  day‐ahead  market.  This  way,  the  operators  can  adjust  the  forecasts  to  the  real  production,  resulting  in  a  better  regulation  of  power  market  and  reducing  the  deviations.  It  is  developed  in  six  different  intraday  sessions,  and  the  new  bids  or  adjustments to the spot market can be introduced three to four hours before the next  session.    In  addition  to  these,  technical  restrictions  and  deviations  from  predictions  are  regulated  through  a  regulating  power  market  and  a  balancing  market,  with  different  prices.    • Differentiated support levels  Tariff levels have been set to get a rate of return of 7% after tax (Kema, 2009). Both  the  tariff  and  premium  option  are  differentiated  by  technology  and  by  size  ‐through  capacity thresholds‐ to take into account economies of scale in larger plants. Capacity  thresholds, however, instead of linear capacity progression can lead RE developers to  size  to  the  limit  of  the  highest  rate,  focusing  on  capacity  rather  than  actual  output  (Burgie,  2009).  Note  that  Spain  was  the  first  country  to  introduce  a  FIT  for  solar  thermal technology.  Whenever  the  fixed  tariff  option  has  been  chosen,  generators  can  receive  differentiated FITs for peak or off‐peak hours.  CHP (incl. biomass CHP) in peak hours  will receive a bonus of +37% of the tariff and a penalisation of ‐36% in off‐peak (small  hydro and biomass can have a more limited bonus and penalisation).    Moreover,  to  discourage  speculative  queuing  grid  access  deposits  are  required:  500€/kW for photovoltaic and 20€/kW for the rest of the special regime.  Note  that  biomass  pricing  has  been  difficult.  At  first,  market  for  biomass  did  not  respond to FIT comparably to solar or wind, as happened as well in Germany (Kema,  2009). This technology, with slower reaction times and very particular challenges (fuel  supply logistics, feed stocks, diversity of technologies, etc.), needed a higher support  level  and  longer  to  be  pushed  up.  Now  in  Spain  we  assist  to  an  incipient  but  generalised development in the whole country of biogas and waste biomass plants.    In case of voltage dips (short drops in voltage in a system), a decoupling from the grid  is  required  for  security  reasons.  This  can  lead  however  to  the  decoupling  of  a  whole  wind  farm,  which  can  totally  destabilise  the  electric  system.  There  has  been  a  great  effort  made  in  Spain  (although  not  yet  implemented  in  Portugal,  which  affects  the  Iberian electric system) to make wind power farms able to ride through these electric  faults. Wind installations capable for short drop in voltage may perceive an economic  incentive. Thus, according to Red Eléctrica de España, in 2009 the biggest wind power  loss due to voltage dips has been 700MW despite having a total installed capacity of  19.000MW. This complement may be introduced also for photovoltaic in the future.    • FIT adjustment and revision 
  • 8. In Spain, the tariffs and premiums are fixed for the entire life of the plant. The level of  support  decreases  however  for  some  technologies:  after  15  years  for  biomass  and  biogas, and after 25 years for photovoltaic.    These  tariffs  are  planned  to  be  inflation  adjusted  yearly  according  to  the  consumer  price  index  (CPI)  and  fuel  prices.  This  is  a  way  to  protect  investors,  which  are  committed to renewable energy project for as much as forty years (Burgie, 2009).     Revision  is  a  broader  process  in  which  the  FIT  may  be  substantively  altered.  RD  661/2007  established  that,  as  85%  of  capacity  cap  for  2010  would  be  covered,  they  would be given at least 12 months to receive the same tariff, which happened for solar  already in 2007. Table 1 shows the rate of fulfillment of these caps in April 2010, and  shows that the 85% capacity cap has been exceeded for solar and for wind.    Installed  Capacity  cap  Rate  of     capacity (MW)  (MW)  fulfilment (%)  CHP  6.312  9.215  68%  Solar PV  3.472  1.331  261%  Solar termal  136  500  27%  Wind  18.401  20.155  91%  Wind (repowering)  0  2.000  0%  1.405  2.400  59%  Small hydro =< 10MW  Biomass  510  1.317  39%  Biogas and manure  180  250  72%  Solid waste  279  350  80%  Table 1: Capacity caps and rate of fulfilment in April 2010 (CNE, 2010)  • RE Quotas  After  the  unexpected  boom  of  PV  in  2008,  the  government  decided  to  set  a  solar  quota,  not  only  through  a  new  cap  for  2009,  2010,  and  so  on,  but  also  with  the  addition of a registry that will keep record of each new project. If the quota is reached,  the actual tariff decreases each year 10%, starting in 2009 with 32 c€/kWh.  This  quotas  and  registry  system  was  extended  to  the  rest  of  the  Special  Regime  in  2009, to break down an incipient “bubble” in solar thermal technology.    Analysis of the Spanish case and lessons learned  If we analyse the development of renewable electricity in Spain with its FIT system in  terms  of  its  effectiveness  in  increasing  installed  capacity  and  energy  generation,  the  results  are  quite  spectacular  (Figure  2).  Nevertheless  since  2007  we  have  assisted  to  several sudden changes in regulation that show the difficulties of the system adopted.  Let us analyse this turbulent evolution and other critics raised to Spanish FITs.    1. The evolution of RE installation and of changing legislation 
  • 9. 35.000 30.000 TRAT.RESIDUOS 25.000 RESIDUOS 20.000 BIOMASA HIDRÁULICA 15.000 EÓLICA SOLAR 10.000 COGENERACIÓN 5.000 0 90 92 94 96 98 00 02 04 06 08 19 19 19 19 19 20 20 20 20 20 MW   Figure 2: Evolution of installed capacity of technologies in Special Regime in Spain (CNE, 2010).    Despite  a  relatively  stable  policy  in  theory  (Spain  is  the  only  country  to  date  where  tariffs are granted during the whole lifetime of the installation), investor certainty has  not been provided.     If we look at the boom and burst of solar PV in Spain, we see that in august 2007 the  85%  of  the  2010  capacity  cap  set  for  solar  had  already  been  reached.  A  revision  of  tariffs  was  expected  for  September  2008,  but  the  new  tariff  was  not  known  before.  This led to a great uncertainty among project developers, who rushed to complete PV  projects on time for fear of getting a lower tariff (which could have even lead to fraud  in  some  cases).    This  caused  a  spectacular  increase  in  PV  capacity  in  2008  (Figure  2)  and  caused  the  developers  rush  installing  new  plants  which  could  lead  to  an  overdevelopment and lock‐in of inferior technologies at the best resource sites. As he  himself  claimed,  the  government  had  relied  on  the  forecasts  of  industry  associations  and  could  not  keep  track  of  the  actual  projects  that  were  being  installed.  The  2008  result was therefore a surprise for them. Actually, in 2010 the 2010 capacity cap has been  exceeded by a 261% (Table 1).  After this, the government decided to create a registry  for  new  projects  (first  for  photovoltaic,  and  then  for  the  rest  of  technologies),  as  described before, and a degressive tariff after the reach of a quota.    The  uncertainty  goes  on  today:  a  global  revision  of  retributive  system  seems  to  be  currently  on  the  table,  but  no  official  draft  has  been  released  yet.  In  2010  after  denunciation in press of possible frauds in PV, rumors have been circulating on radical  tariff  cuts  and  even  on  the  possibility  of  being  retroactive,  which  have  lead  to  a  collapse  on  the  stock  exchange  for  renewables  industry  and  to  the  halting  of  new  investments.  In  2010  is  also  expected  a  new  “Renewable  Energy  Plan”  (former  plan  was in force 2005‐2010) and the revision of the Special Regime Royal Decree.   On the other hand, the tariff set for PV has been criticised for being set too high from  the outset (similar tariffs than in Germany with much more sunshine). A balance has to  be found between a sufficient FIT that will allow the development of a yet unmature 
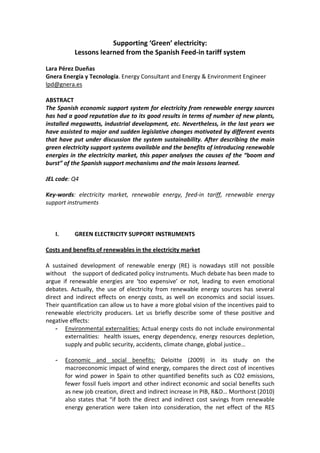
  • 10. technology  and  a  too  high  tariff  that  incentivise  a  technology  still  inefficient,  uneconomic or even speculative.       2. Cost for the community    Despite a rise on fuel prices and therefore on generation costs and electricity prices, the  consumer tariffs where not correspondingly increased by the government. This decoupling  between  the  electricity  tariff  and  the  actual  cost  was  made  possible  with  the  RD  1432/2002 and has created the so‐called “energy deficit”: difference between the amount  collected from consumers through the tariff set by the Government and the actual costs of  generation, transportation, distribution, etc. The different items included in this cost and  their  distribution  in  volume  are  detailed  in  Figure  3.  This  deficit  will  be  amortized  in  the  next  years,  therefore  it  is  a  debt  to  be  paid  for  future  consumers  although  created  by  current consumption.    Special  Regime  FITs  were  included  into  this  consumer’s  tariff,  representing  37%  of  2010  total  costs.  Even  if  the  rise  in  renewables  and  CHP  retribution  cannot  be  considered  the  sole  cause  of  the  energy  deficit,  the  exponential  increase  of  solar  in  2008  with  its  high  retribution  had  a  relevant  impact  on  the  actual  costs  and  therefore  on  the  deficit.  Thus,  the  Government  himself  stated  in  the  decree  1578/2008,  despite  his  declared  commitment  towards  renewables,  that  "Energy  sources  under  this  special  regime  constitute a risk for the system's sustainability because of their effects on power prices."  This  suggests  that  RE  were  blamed  for  the energy  deficit,  as the  tariff has  not  risen  that  much.  The total payment for renewables and CHP amounted in April 2010 €660 million, from  which  FV  and  wind  power  were  both  paid  about  €210  million.  For  2009  tariffs  and  premiums paid for RE amounted for 5.000 million (CNE, 2010).  The energy deficit, however, is not circumstantial but really structural, as it has been used  by  the  government  as  a  strategy  to  fix  a  consumption  tariff  whose  maximum  rise  was  determined in advance: electricity rates were kept artificially low.   Otros costes Servicio gestión  3% interrumpibilida d Transporte 3% 9% Primas Régimen  Distribución Especial 31% 37% Déficit tarifario Moratoria  11% Compensación  Nuclear extrapeninsular 0% 6%   Figure 3: Distribution of the different costs in the access toll of consumption electricity tariff (BOE, 2009)     
  • 11. 3. Impact on prices: reaching zero spot prices    Figure 4 describes the price fixation based on merit order, while crossing demand and  supply  curves.  The  demand  curve  is  inelastic;  therefore  minor  changes  in  the  supply  can  result  in  major  price  changes.  As  renewable  power,  like  wind  or  solar,  has  a  low  marginal  cost  due  to  zero  fuel  costs,  their  bids  enter  the  supply  curve  at  the  lowest  level. This shifts the supply curve to the right, resulting in a lower power price.  This  ‘merit  order  effect’  can  range,  according  to  various  studies,  3‐23€/MWh  for  wind  power  (Morthost,  2010).  The  total  amount  of  savings  made  due  to  the  wind  power  penetration has been evaluated within a range of €1.3‐5 billion per year in Germany or  €0.1 billion for 2006 in Denmark.      Figure 4:  Demand and supply curve for price fixation (www.omel.es)    In Spain, GELABERT et al. (2009) have concluded that an increase in the generation of  renewable  energy  sources  under  the  Special  Regime  by  1  GWh  would  result  in  a  decrease on electricity prices by around 2.5 Euros on average, or around 5%. However,  the decrease of electricity price (pool) will not directly affect consumers, as price is set  by tendering.     It  is  nevertheless  important  to  note  that  this  effect  can  be  just  temporary  because  “when this decrease in electricity prices takes place, the signal for investment is also  reduced  and  thus  future  investments  are  reduced,  bringing  about  a  subsequent  increase  in  electricity  prices.  In  addition,  when  market  power  exists,  traditional  producers may bid higher in order to keep the price level as before” (GELABERT et al,  2009).     The merit order effect can eventually result in zero spot prices, part of which can be  attributed  to  renewable  power  generation.  Low  or  zero  spot  price  results  in  lower  incomes for generators, but also in a lower cost for the general system. Nevertheless,  Spanish government and energy producers consider this as a failure of the system and  ways of avoiding it are being discussed. The whole electricity system could be revised  and Special Regime could be taken off the spot market.   
  • 12. During  the  first  four  months  of  2010,  Spanish  market  has  experienced  293  hours  of  zero  spot  prices  (CNE,  2010),  i.e.  10%  of  the  total  amount  of  hours.  This  can  be  attributed to the high production of wind and hydro power and a lower demand.    To finish, we can note that the Spanish system “special regime” has not been thought  for  broad  distributed  generation.  This  makes  Spanish  goals  different  from  Germany  (where one third of Germany’s wind power is owned by 200.000 local landowners) or  Denmark (where 150.000 families own 80% of installed turbines) (WFC, 2009). This is  not necessarily a planning error, but makes it more difficult to implement a distributed  generation system where renewable energies supply local demand and go beyond the  problems created by a centralised regime.      III. FINAL REMARKS    Spain has embraced more than 15 years ago a green electricity support policy which  has since then proven to be one of the most efficient tools for promoting renewable  energies  in  the  electricity  market.  This  pioneer  position  can  explain  some  of  the  difficulties  experienced  by  the  successive  governments  which  have  lead  to  a  major  discussion on the sustainability of the system.    Anyway, difficulties should not make us forget the innovative and interesting solutions  implemented  in  Spanish  market  to  ensure  a  great  and  high  quality  integration  of  electricity from renewable energy sources: ‘Green’ electricity represented almost 40%  of the electricity generation in April 2010.    The  main  difficulty  is  perhaps  the  lack  of  a  consistent,  clearly  defined,  long‐term  strategy,  which  leads  therefore  to  a  great  uncertainty  for  investors  and  project  developers.    It  is  certain  that  it  is  difficult  to  adjust  a  tariff  from  the  outset  for  a  new,  immature  technology as was the photovoltaic; but effectively the tariff seemed to have been set  to high, without a good capacity cap control, encouraging uncontrolled development  and  promoting  quantitative  capacity  increase  at  the  expense  of  quality  and  with  an  exponential  costs  escalation.  A  well  defined  revision  mechanism  and  a  degressive  tariff, among other measures, could have helped.    An  additional  problem  was  the  decoupling  between  actual  generation  costs  and  consumers  tariff  due  to  a  political  decision  to  contain  the  tariff  rise.  As  the  amount  paid to FIT system grows, the debt for future consumers due to energy deficit has to be  kept, entering a vicious circle.     Again, the numerous and sudden legislative adjustments to try to solve the detected  problems have contributed to investors uncertainty. 2010 might be a key year to solve  this uncertainty and design a new, re‐adapted system.     
  • 13. REFERENCES    BOE (2009): Orden ITC/3519/2009, de 28 de diciembre, por la que se revisan los peajes  de  acceso  a  partir  de  1  de  enero  de  2010  y  las  tarifas  y  primas  de  las  instalaciones  de  régimen especial  BURGIE,  B.  and  CRANDALL,  K.  (2009):    The  Application  of  Feed‐in  Tariffs  and  Other  incentives  to  Promote  Renewable  Energy  in  Colorado,  Colorado  Public  Utilities  Commission, Denver  CNE (2010): “Informe mensual de ventas de energía del régimen especial”, 10/04/2010  COMISIÓN  EUROPEA  (2008):  The  support  of  electricity  from  renewable  energy  sources,  SEC(2008)57.  COMISIÓN EUROPEA (2009): The renewable energy progress report, SEC(2009) 503 final.  DECC (2010) : Feed in Tariffs. Government’s response to the Summer 2009 consultation,  Department of Energy & Climate Change, London.  DEL RÍO, P. (2009): “La Promoción de la electricidad renovable en España en el contexto  europeo”, ICE nº 847  DELOITTE (2009): Estudio macroeconómico del impacto del sector eólico en España  FINON, D. and MENANTEAU, P. (2004): “La promotion des énergies renouvelables dans  les  nouveaux  marchés  électriques  concurrentiels »,  Anales  des  Mines‐Réalités  Industrielles  FRONDEL D., RITTER, N. and VANCE, C. (2009): Economic impacts from the promotion of  renewable energies: the German experience, RWI  GELABERT, L., LINARES, P. and LABANDEIRA, X. (2009) 'Renewable Energy and Electricity  Prices in Spain', Working Paper AEEE 09‐2009  HADJSAÏD,  N.(2010):  La  distribution  d’énergie  électrique  en  présence  de  production  décentralisée, Lavoisier.  KEMA(2009): California Feed‐In Tariff design and policy options, Oakland  KPMG (2009): Informe estratégico para el sector fotovoltaico en España: acercándonos a  la paridad de red  MITYC  (2010):  “Energías  renovables:  situación  y  objetivos”,  Ministerio  de  Industria,  Turismo y Comercio. April 2010, Madrid.  MORTHOST, P. E. et. Al  (2010): Wind energy and electricity prices. Exploring the ‘merit  order effect’, Pöyry.   WFC(2009): FITness testing: Exploring the myths and misconceptions about feed‐in tariff  policies, World Future Council, Washington