1. Job Satisfaction by Country (%)
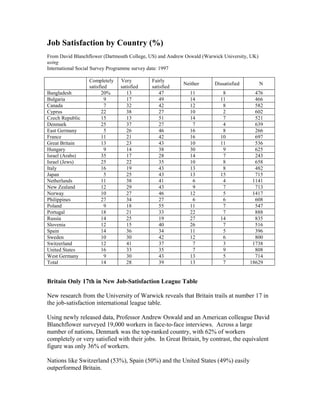
From David Blanchflower (Dartmouth College, US) and Andrew Oswald (Warwick University, UK)
using
International Social Survey Programme survey data: 1997
Completely Very Fairly
Neither Dissatisfied N
satisfied satisfied satisfied
Bangladesh 20% 13 47 11 8 476
Bulgaria 9 17 49 14 11 466
Canada 7 32 42 12 8 582
Cyprus 22 38 27 10 2 602
Czech Republic 15 13 51 14 7 521
Denmark 25 37 27 7 4 639
East Germany 5 26 46 16 8 266
France 11 21 42 16 10 697
Great Britain 13 23 43 10 11 536
Hungary 9 14 38 30 9 625
Israel (Arabs) 35 17 28 14 7 243
Israel (Jews) 25 22 35 10 8 658
Italy 16 19 43 13 8 482
Japan 5 25 43 13 15 715
Netherlands 11 38 41 6 4 1141
New Zealand 12 29 43 9 7 713
Norway 10 27 46 12 5 1417
Philippines 27 34 27 6 6 608
Poland 9 18 55 11 7 547
Portugal 18 21 33 22 7 888
Russia 14 25 19 27 14 835
Slovenia 12 15 40 26 7 516
Spain 14 36 34 11 5 396
Sweden 10 30 42 12 6 800
Switzerland 12 41 37 7 3 1738
United States 16 33 35 7 9 808
West Germany 9 30 43 13 5 714
Total 14 28 39 13 7 18629
Britain Only 17th in New Job-Satisfaction League Table
New research from the University of Warwick reveals that Britain trails at number 17 in
the job-satisfaction international league table.
Using newly released data, Professor Andrew Oswald and an American colleague David
Blanchflower surveyed 19,000 workers in face-to-face interviews. Across a large
number of nations, Denmark was the top-ranked country, with 62% of workers
completely or very satisfied with their jobs. In Great Britain, by contrast, the equivalent
figure was only 36% of workers.
Nations like Switzerland (53%), Spain (50%) and the United States (49%) easily
outperformed Britain.
2. Professor Oswald said: “For a prosperous nation, we do a lot less well on the latest job-
satisfaction ranking than we should. These findings are consistent with other evidence
that the 1990s was not an especially good decade in British workplaces. We don’t yet
understand why. Job insecurity and longer commutes may be part of the explanation.”
The Eastern European nations performed worst on the survey. Japan too was low down,
with only 30% of employees completely or very satisfied with their jobs. France (at
32%) was also slightly below Britain. Hungary was the bottom country in the whole
ranking.
The authors’ analysis was based on random sampling of each nation’s working
population.
Note for editors on international ranking: The full league-table numbers are Denmark
62%, Philippines 61, Cyprus 60, Switzerland 53, Israel (Arabs) 52, Spain 50, Netherlands
49, US 49, Israel (Jews) 47, New Zealand 41, Sweden 40, Canada 39, Portugal 39, Russia
39, Western Germany 39, Norway 37, Britain 36, Italy 35, Bangladesh 33, France 32,
Eastern Germany 31, Japan 30, Czech Republic 28, Poland 27, Slovenia 27, Bulgaria 26,
Hungary 23.
A full statement of the data is available from the author’s web page www.oswald.co.uk.
Andrew Oswald is an economics professor at the University of Warwick. David
Blanchflower is an economics professor at Dartmouth College in the USA.
2