SlideShare une entreprise Scribd logo
1  sur  27
Ramakant Mahawar
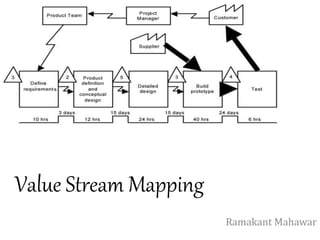
Value Stream Mapping
Value stream mapping
Value stream mapping is a lean-management
method for analyzing the current state and
designing a future state for the series of events
that take a product or service from its beginning
through to the customer. At Toyota, it is known as
"material and information flow mapping“.
Value Stream Mapping Purpose
Provide optimum value to the customer through a
complete value creation process with minimum waste in:
Design (concept to customer)
Build (order to delivery)
Sustain (in-use through life cycle to service)
Why important
Many organizations pursuing “lean” conversions have
realized that improvement events alone are not enough
Improvement events create localized improvements,
value stream mapping & analysis strengthens the
gains by providing vision and plans that connect all
improvement activities
Value stream mapping & analysis is a tool that allows
you to see waste, and plan to eliminate it
What Is Value?
A capability provided to a customer
– of the highest quality,
– at the right time,
– at an appropriate price,
as defined by the customer.
– "Value" is what the customer is buying
What Is Value Stream Analysis?
Lean
Basics
Planning tool to optimize
results of eliminating waste
Current State VSM Future State VSM
Value Steam Mapping Steps
Apply Five Simple Principles
Specify value from the standpoint of end customer
Identify the value stream for each product family
Make the product flow
So the customer can pull
As you manage toward perfection
PERFECTION
PULL FLOW
VALUE
STREAM
VALUE
Lean Guiding Principles
What Flows?
"ITEMS" flow through a value stream
– In manufacturing, materials are the items
– In design & development, designs are the items
– In service, external customer needs are the items
– In admin., internal customer needs are the items
Analysis begins with part of a total value stream, that
part of the value stream has customers too
TAKT TIME
The word takt is German and literally means pace or
rhythm. When we speak of takt time we're attempting
to understand the rate at which we need to produce our
product in order to satisfy customer demand.
Step by Step Guide
Step 1 - Select your sponsor and set expectations
– appoint someone who is responsible to make
decisions, arbitrate solutions, and plan the project.
– The sponsor usually selects the processes that will be
mapped and will usually have a firm grasp of what
achievement is being targeted.
Step by Step Guide
 Step 2 - Select your team
– You should ensure that each area or stakeholder of
the process is represented e.g. Sales, Purchasing,
Warehouse etc.
Step by Step Guide
 Step 3 -Select process to be mapped
– Value Stream Mapping is suitable for most businesses
and can be used in Manufacturing, Logistics, Supply
Chain and some Service orientated Organizations.
Step by Step Guide
Step 4 - Collect data and produce current state map
– process times, inventory or materials information,
customer (or demand) requirements.
– the future state maps will be developed using
information captured here so it’s imperative you have a
correct understanding of the business.
Step by Step Guide
Step 5 - Critique Current state
– challenge the current thinking, encourage your
team to make suggestions, look for areas of waste.
Step by Step Guide
Step 6 - Map Future State
– compile a future state map based on the
current state map and the critiques
Step by Step Guide
Step 7 - Create Action Plan and deploy
– taking the Future State map consider an
action plan that could be implemented to
change the current process to the future
state.
Step by Step Guide
Step 8 - Measure benefits
– check to ensure that the benefits expected
have been obtained – review each change
made and analyze benefits
Value Stream Mapping
Present State Value Stream Map
Value Stream Mapping
Establish Takt Time
GOAL: Produce to Demand
Takt Time = Demand Rate
Takt Time =
Work Time Available
900 Seconds
85 Boards
= 10.6 Sec/BoardTakt Time =
Cycle Time
Takt Time = Minimum # of People
Number of Units Sold
Value Stream Mapping
Future State Value Stream Map
THANK YOU

Contenu connexe

Tendances

Tendances (20)

Value Stream Mapping Project Template by Operational Excellence Consulting
Value Stream Mapping Project Template by Operational Excellence ConsultingValue Stream Mapping Project Template by Operational Excellence Consulting
Value Stream Mapping Project Template by Operational Excellence Consulting
 
Value stream mapping
Value stream mappingValue stream mapping
Value stream mapping
 
Value Stream Mapping -The Concept
Value Stream Mapping -The ConceptValue Stream Mapping -The Concept
Value Stream Mapping -The Concept
 
Value stream mapping (1)
Value stream mapping (1)Value stream mapping (1)
Value stream mapping (1)
 
Dmaic
DmaicDmaic
Dmaic
 
8 Wastes in Lean
8 Wastes in Lean8 Wastes in Lean
8 Wastes in Lean
 
Lean manufacturing ppt
Lean manufacturing pptLean manufacturing ppt
Lean manufacturing ppt
 
Lean Value Stream Mapping (VSM) Training Module
Lean Value Stream Mapping (VSM) Training ModuleLean Value Stream Mapping (VSM) Training Module
Lean Value Stream Mapping (VSM) Training Module
 
Lean manufacturing
Lean manufacturingLean manufacturing
Lean manufacturing
 
Value stream mapping ppt
Value stream mapping pptValue stream mapping ppt
Value stream mapping ppt
 
Top 25 lean tools
Top 25 lean toolsTop 25 lean tools
Top 25 lean tools
 
Lean Manufacturing PowerPoint Presentation Sample
Lean Manufacturing PowerPoint Presentation SampleLean Manufacturing PowerPoint Presentation Sample
Lean Manufacturing PowerPoint Presentation Sample
 
Lean Transformation ~ A Journey
Lean Transformation ~ A JourneyLean Transformation ~ A Journey
Lean Transformation ~ A Journey
 
Hourly Lean Introduction
Hourly Lean IntroductionHourly Lean Introduction
Hourly Lean Introduction
 
Introduction To Lean
Introduction To LeanIntroduction To Lean
Introduction To Lean
 
Value stream mapping - Future State
Value stream mapping - Future StateValue stream mapping - Future State
Value stream mapping - Future State
 
Types of waste - lean Concept Krishna Heda
Types of waste - lean Concept Krishna HedaTypes of waste - lean Concept Krishna Heda
Types of waste - lean Concept Krishna Heda
 
Identifying Lean Waste
Identifying Lean WasteIdentifying Lean Waste
Identifying Lean Waste
 
Spaghetti Diagrams
Spaghetti DiagramsSpaghetti Diagrams
Spaghetti Diagrams
 
Heijunka
HeijunkaHeijunka
Heijunka
 

Similaire à Value Stream Mapping

Value stream mapping
Value stream mappingValue stream mapping
Value stream mappingAbhishek Jain
 
Management information system
Management information systemManagement information system
Management information systemKush Sharma
 
Eliminating the production bottlenecks
Eliminating the production bottlenecksEliminating the production bottlenecks
Eliminating the production bottlenecksdutconsult
 
01-VSM-VSD-Training-Presentation-20140406-pptx.pptx
01-VSM-VSD-Training-Presentation-20140406-pptx.pptx01-VSM-VSD-Training-Presentation-20140406-pptx.pptx
01-VSM-VSD-Training-Presentation-20140406-pptx.pptxabdullahmohamed10900
 
Lean Fundamentals And Line Design 06 04 01
Lean  Fundamentals And  Line  Design 06 04 01Lean  Fundamentals And  Line  Design 06 04 01
Lean Fundamentals And Line Design 06 04 01Dan Junkins
 
Value Stream Mapping in Anatomic Pathology
Value Stream Mapping in Anatomic PathologyValue Stream Mapping in Anatomic Pathology
Value Stream Mapping in Anatomic Pathologyguest389e15
 
Froehling Value Stream Mapping G2 2008 Final Version
Froehling Value Stream Mapping G2 2008 Final VersionFroehling Value Stream Mapping G2 2008 Final Version
Froehling Value Stream Mapping G2 2008 Final Versionhfroehling1
 
Empirical Product Development
Empirical Product DevelopmentEmpirical Product Development
Empirical Product DevelopmentDavid Wolfe
 
Value Stream Mapping Overview Update
Value Stream Mapping Overview UpdateValue Stream Mapping Overview Update
Value Stream Mapping Overview Updatejheaton418
 
460 operations - 4.20
460   operations - 4.20460   operations - 4.20
460 operations - 4.20Kyle Bakken
 
Cost reduce with quality / Reducción de costos con calidad
Cost reduce with quality / Reducción de costos con calidadCost reduce with quality / Reducción de costos con calidad
Cost reduce with quality / Reducción de costos con calidadWilfredo Bocanegra Merino
 
RDrew Six Sigma Overview
RDrew Six Sigma OverviewRDrew Six Sigma Overview
RDrew Six Sigma OverviewRon Drew
 
D365 & d365 business central features
D365 & d365 business central featuresD365 & d365 business central features
D365 & d365 business central featuresInfo San
 
Rapid Deployment of ERP solutions using agile practices by Husni Roukbi
Rapid Deployment of ERP solutions using agile practices by Husni Roukbi Rapid Deployment of ERP solutions using agile practices by Husni Roukbi
Rapid Deployment of ERP solutions using agile practices by Husni Roukbi Agile ME
 
Awareness To Lean & 7 Qc Tools
Awareness To Lean & 7 Qc ToolsAwareness To Lean & 7 Qc Tools
Awareness To Lean & 7 Qc ToolsNilesh Sawant
 
Supply Chain Management Review Powerpoint Presentation Slides
Supply Chain Management Review Powerpoint Presentation SlidesSupply Chain Management Review Powerpoint Presentation Slides
Supply Chain Management Review Powerpoint Presentation SlidesSlideTeam
 

Similaire à Value Stream Mapping (20)

Value stream mapping
Value stream mappingValue stream mapping
Value stream mapping
 
Management information system
Management information systemManagement information system
Management information system
 
Eliminating the production bottlenecks
Eliminating the production bottlenecksEliminating the production bottlenecks
Eliminating the production bottlenecks
 
01-VSM-VSD-Training-Presentation-20140406-pptx.pptx
01-VSM-VSD-Training-Presentation-20140406-pptx.pptx01-VSM-VSD-Training-Presentation-20140406-pptx.pptx
01-VSM-VSD-Training-Presentation-20140406-pptx.pptx
 
Lean Fundamentals And Line Design 06 04 01
Lean  Fundamentals And  Line  Design 06 04 01Lean  Fundamentals And  Line  Design 06 04 01
Lean Fundamentals And Line Design 06 04 01
 
Value Stream Mapping in Anatomic Pathology
Value Stream Mapping in Anatomic PathologyValue Stream Mapping in Anatomic Pathology
Value Stream Mapping in Anatomic Pathology
 
Froehling Value Stream Mapping G2 2008 Final Version
Froehling Value Stream Mapping G2 2008 Final VersionFroehling Value Stream Mapping G2 2008 Final Version
Froehling Value Stream Mapping G2 2008 Final Version
 
Value Stream Analysis
Value Stream AnalysisValue Stream Analysis
Value Stream Analysis
 
Empirical Product Development
Empirical Product DevelopmentEmpirical Product Development
Empirical Product Development
 
Value Stream Mapping Overview Update
Value Stream Mapping Overview UpdateValue Stream Mapping Overview Update
Value Stream Mapping Overview Update
 
Value stream mapping
Value stream mappingValue stream mapping
Value stream mapping
 
460 operations - 4.20
460   operations - 4.20460   operations - 4.20
460 operations - 4.20
 
Cost reduce with quality / Reducción de costos con calidad
Cost reduce with quality / Reducción de costos con calidadCost reduce with quality / Reducción de costos con calidad
Cost reduce with quality / Reducción de costos con calidad
 
RDrew Six Sigma Overview
RDrew Six Sigma OverviewRDrew Six Sigma Overview
RDrew Six Sigma Overview
 
D365 & d365 business central features
D365 & d365 business central featuresD365 & d365 business central features
D365 & d365 business central features
 
Agile overview
Agile overviewAgile overview
Agile overview
 
Rapid Deployment of ERP solutions using agile practices by Husni Roukbi
Rapid Deployment of ERP solutions using agile practices by Husni Roukbi Rapid Deployment of ERP solutions using agile practices by Husni Roukbi
Rapid Deployment of ERP solutions using agile practices by Husni Roukbi
 
Awareness To Lean & 7 Qc Tools
Awareness To Lean & 7 Qc ToolsAwareness To Lean & 7 Qc Tools
Awareness To Lean & 7 Qc Tools
 
Supply Chain Management Review Powerpoint Presentation Slides
Supply Chain Management Review Powerpoint Presentation SlidesSupply Chain Management Review Powerpoint Presentation Slides
Supply Chain Management Review Powerpoint Presentation Slides
 
6 Sigma
6 Sigma6 Sigma
6 Sigma
 

Value Stream Mapping

  • 2. Value stream mapping Value stream mapping is a lean-management method for analyzing the current state and designing a future state for the series of events that take a product or service from its beginning through to the customer. At Toyota, it is known as "material and information flow mapping“.
  • 3. Value Stream Mapping Purpose Provide optimum value to the customer through a complete value creation process with minimum waste in: Design (concept to customer) Build (order to delivery) Sustain (in-use through life cycle to service)
  • 4. Why important Many organizations pursuing “lean” conversions have realized that improvement events alone are not enough Improvement events create localized improvements, value stream mapping & analysis strengthens the gains by providing vision and plans that connect all improvement activities Value stream mapping & analysis is a tool that allows you to see waste, and plan to eliminate it
  • 5. What Is Value? A capability provided to a customer – of the highest quality, – at the right time, – at an appropriate price, as defined by the customer. – "Value" is what the customer is buying
  • 6. What Is Value Stream Analysis? Lean Basics Planning tool to optimize results of eliminating waste Current State VSM Future State VSM
  • 8. Apply Five Simple Principles Specify value from the standpoint of end customer Identify the value stream for each product family Make the product flow So the customer can pull As you manage toward perfection
  • 10. What Flows? "ITEMS" flow through a value stream – In manufacturing, materials are the items – In design & development, designs are the items – In service, external customer needs are the items – In admin., internal customer needs are the items Analysis begins with part of a total value stream, that part of the value stream has customers too
  • 11.
  • 12. TAKT TIME The word takt is German and literally means pace or rhythm. When we speak of takt time we're attempting to understand the rate at which we need to produce our product in order to satisfy customer demand.
  • 13. Step by Step Guide Step 1 - Select your sponsor and set expectations – appoint someone who is responsible to make decisions, arbitrate solutions, and plan the project. – The sponsor usually selects the processes that will be mapped and will usually have a firm grasp of what achievement is being targeted.
  • 14. Step by Step Guide  Step 2 - Select your team – You should ensure that each area or stakeholder of the process is represented e.g. Sales, Purchasing, Warehouse etc.
  • 15. Step by Step Guide  Step 3 -Select process to be mapped – Value Stream Mapping is suitable for most businesses and can be used in Manufacturing, Logistics, Supply Chain and some Service orientated Organizations.
  • 16. Step by Step Guide Step 4 - Collect data and produce current state map – process times, inventory or materials information, customer (or demand) requirements. – the future state maps will be developed using information captured here so it’s imperative you have a correct understanding of the business.
  • 17. Step by Step Guide Step 5 - Critique Current state – challenge the current thinking, encourage your team to make suggestions, look for areas of waste.
  • 18. Step by Step Guide Step 6 - Map Future State – compile a future state map based on the current state map and the critiques
  • 19. Step by Step Guide Step 7 - Create Action Plan and deploy – taking the Future State map consider an action plan that could be implemented to change the current process to the future state.
  • 20. Step by Step Guide Step 8 - Measure benefits – check to ensure that the benefits expected have been obtained – review each change made and analyze benefits
  • 21. Value Stream Mapping Present State Value Stream Map
  • 22. Value Stream Mapping Establish Takt Time GOAL: Produce to Demand Takt Time = Demand Rate Takt Time = Work Time Available 900 Seconds 85 Boards = 10.6 Sec/BoardTakt Time = Cycle Time Takt Time = Minimum # of People Number of Units Sold
  • 23. Value Stream Mapping Future State Value Stream Map
  • 24.
  • 25.
  • 26.