Australian communities report infographic 2017
•
2 j'aime•1,212 vues

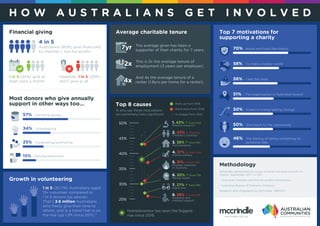
1) Most Australians get involved with charities through financial donations as well as volunteering their time and skills. 3.6 million Australians volunteer regularly, giving their time to help others. 2) The top motivations for Australians in supporting charities are knowing and trusting the charity, wanting to make a positive impact and address needs in the community. The average donor has supported their chosen charity for 7 years. 3) Medical research and children's charities are the most supported causes, though homelessness saw the biggest increase in support in recent years. Transparency in reporting and administration costs is extremely important to donors.

Recommandé
Recommandé
Contenu connexe
Similaire à Australian communities report infographic 2017
Similaire à Australian communities report infographic 2017 (20)
Plus de Mark McCrindle
Plus de Mark McCrindle (20)
Dernier
Dernier (20)
Australian communities report infographic 2017
- 1. H O W A U S T R A L I A N S G E T I N V O L V E D Most donors who give annually support in other ways too... Growth in volunteering Average charitable tenure 1 in 5 (20.7%) Australians aged 15+ volunteer compared to 1 in 3 donors (as above). That’s 3.6 million Australians who freely give their time to others, and is a trend that is on the rise (up 1.3% since 2011).† % who say these motivations are extremely/very significant 50% 45% 40% 35% 30% 25% 57% - Donating goods Top 7 motivations for supporting a charity Top 8 causes 34% - Volunteering 25% - Fundraising/promoting 15% - Raising awareness Methodology Nationally representative survey of those who give annually to charity, September 2017, n=722. * Australian Charities and Not-for-profits Commission. † Australian Bureau of Statistics (Census). Research and infographic by McCrindle - cb2017 70% - Know and trust the charity 58% - To make a better world 56% - I see the need 51% - The organisation is Australian-based 50% - Invest in a long-lasting change 50% - Give back to the community 46% - The feeling of doing something for someone else 4 in 5 Financial giving Australians (80%) give financially to charities / not-for-profits 1 in 4 (24%) give at least once a month However, 1 in 5 (20%) don’t give at all The average giver has been a supporter of their charity for 7 years. This is 2x the average tenure of employment (3 years per employer). And 4x the average tenure of a renter (1.8yrs per home for a renter). 1. 43% ↑ from 2nd Medical research 2. 43% ↓ from 1st Children’s charities 3. 38% ↑ from 6th Homelessness 6. 30% ↑ from 7th Mental health 4. 37% ↓ from 3rd Animal welfare 5. 31% ↓ from 4th Disaster response in Australia 8. 26% ↓ from 5th Disability and medical support 7. 27% ↑ from 8th Aged care Homelessness has seen the biggest rise since 2016. Rank up from 2016 Rank down from 2016 % change from 2016 mccrindle.com.au 4x4x 2x2x 7yr7yr
- 2. H O W C H A R I T I E S C A N E N G A G E The median income of a charity in 2015 was $128,703. 37% had incomes below $50,000 and 0.3% (142) had incomes above $100 million. The total income of the charity sector in 2015 was $134.5 billion (8.3% of GDP). In the last 12 months, 2 in 3 made a surplus (66%) and 1 in 3 reported a deficit (33%). The largest 10% of charities collected 90% of all charitable revenue. Blockers & enablers to giving Location* Second largest sector* by employees Income* Australia’s charities landscape* Numbers Type E M O T I O N A L B L O C K E R S E N A B L E R S P R A C T I C A L Doubting how much gets through Scepticism and trust issues Oversaturation of charities Already giving to people in need Personal connection Stories of change / impact Frontline participation Show impact of individual gift Rising costs, variable income Donation requests intrusive Set amounts / ongoing contracts Complex giving process Transparency More information Values alignment Micro-giving, small steps $ 20% % who say this is extremely/very important The 5 charity essentials $ 75% ↑ from 72% in 2016 Transparent reporting of admin costs 74% ↑ from 72% in 2016 Verification of registration as a charity 73% = at 73% in 2016 Administration costs kept below 20% 72% ↑ from 65% in 2016 Where donations are allocated 69% ↑ from 65% in 2016 Reporting specific impacts and costs Highest registered charities per capita Lowest registered charities per capita WA 10.3% of charities 10.9% of population TAS 2.6% of charities 2.2% of population QLD 15.1% of charities 20.1% of population ACT 2.2% of charities 1.6% of population Charities employ over 1.2 million staff. This makes it the second largest Australian employment sector after retail. Donor expectations regarding transparency and accountability continue to increase year on year. There are 2.1 charities for every 1,000 Australians! That’s 55,000 registered charities. For almost 1 in 3 (31%), the main purpose is religious activity. Religious charities are generally smaller and have the lowest proportion of $1 million+ revenues (5.1%) compared to health charities (39.4%) and education charities (31.4%). 2.1 1,000: #2 66% +$ -$ 33% $128,703 $