
Recommandé
Contenu connexe
Tendances
Tendances (19)
Plus de marniekrentz
Plus de marniekrentz (20)
Dernier
Dernier (20)
Graph linear equations worksheet
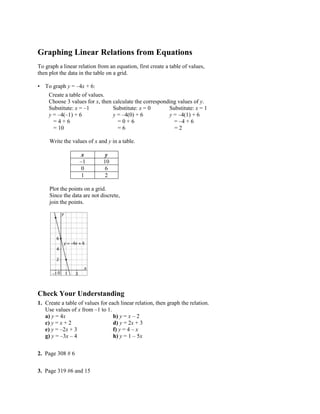
- 1. Graphing Linear Relations from Equations<br />To graph a linear relation from an equation, first create a table of values, then plot the data in the table on a grid.<br />•To graph y = –4x + 6:<br />Create a table of values.<br />Choose 3 values for x, then calculate the corresponding values of y.<br />Substitute: x = –1Substitute: x = 0Substitute: x = 1<br />y = –4(–1) + 6y = –4(0) + 6y = –4(1) + 6<br />= 4 + 6 = 0 + 6= –4 + 6<br />= 10= 6= 2<br />Write the values of x and y in a table.<br />xy–1100612<br />Plot the points on a grid.<br />Since the data are not discrete,<br />join the points.<br />Check Your Understanding<br />1.Create a table of values for each linear relation, then graph the relation.Use values of x from –1 to 1.a) y = 4xb) y = x – 2c) y = x + 2d) y = 2x + 3e) y = –2x + 3f) y = 4 – xg) y = –3x – 4h) y = 1 – 5x<br />2. Page 308 # 6<br />3. Page 319 #6 and 15<br />