1. INTERNATIONAL STUDENTS IN THE U.S.
A. NEW INTERNATIONAL STUDENT ENROLLMENT C. TOP PLACES OF ORIGIN of International Students, 2007/08 & 2008/09
New international student Year Total % Change • Students from the top five places comprise 50% of all international students.
enrollment – students 2004/05 131,946 -
enrolling for the first time 2005/06 142,923 8.3 Rank Place of Origin 2007/08 2008/09 % of Total % Change
at a U.S. institution in Fall 2006/07 157,178 10.0 WORLD TOTAL 623,805 671,616 100.0 7.7
2008 – increased 15.8% 2007/08 173,121 10.1 1 India 94,563 103,260 15.4 9.2
2008/09 200,460 15.8 2 China 81,127 98,235 14.6 21.1
over the previous year.
3 South Korea 69,124 75,065 11.2 8.6
4 Canada 29,051 29,697 4.4 2.2
B. INTERNATIONAL STUDENT TRENDS 5 Japan 33,974 29,264 4.4 -13.9
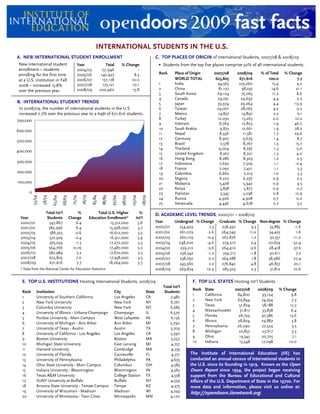
In 2008/09, the number of international students in the U.S. 6 Taiwan 29,001 28,065 4.2 -3.2
increased 7.7% over the previous year to a high of 671,616 students. 7 Mexico 14,837 14,850 2.2 0.1
700,000 8 Turkey 12,030 13,263 2.0 10.2
9 Vietnam 8,769 12,823 1.9 46.2
10 Saudi Arabia 9,873 12,661 1.9 28.2
600,000
11 Nepal 8,936 11,581 1.7 29.6
12 Germany 8,907 9,679 1.4 8.7
500,000
13 Brazil 7,578 8,767 1.3 15.7
14 Thailand 9,004 8,736 1.3 -3.0
400,000
15 United Kingdom 8,367 8,701 1.3 4.0
16 Hong Kong 8,286 8,329 1.2 0.5
300,000 17 Indonesia 7,692 7,509 1.1 -2.4
18 France 7,050 7,421 1.1 5.3
200,000 19 Colombia 6,662 7,013 1.0 5.3
20 Nigeria 6,222 6,256 0.9 0.5
100,000 21 Malaysia 5,428 5,942 0.9 9.5
22 Kenya 5,838 5,877 0.9 0.7
0 23 Pakistan 5,345 5,298 0.8 -0.9
58/59
68/69
78/79
88/89
98/99
08/09
53/54
63/64
73/74
83/84
93/94
03/04
24 Russia 4,906 4,908 0.7 0.0
25 Venezuela 4,446 4,678 0.7 5.2
Total Int'l % Total U.S. Higher % D. ACADEMIC LEVEL TRENDS, 2000/01 – 2008/09
Year Students Change Education Enrollment* Int'l
2000/01 547,867 6.4 15,312,000 3.6 Year Undergrad % Change Graduate % Change Non-degree % Change
2001/02 582,996 6.4 15,928,000 3.7 2000/01 254,429 7.3 238,497 9.3 33,883 -1.6
2002/03 586,323 0.6 16,612,000 3.5 2001/02 261,079 2.6 264,749 11.0 34,423 1.6
2003/04 572,509 -2.4 16,911,000 3.4 2002/03 260,103 -0.4 267,876 1.2 30,551 -11.2
2004/05 565,039 -1.3 17,272,000 3.3 2003/04 248,200 -4.6 274,310 2.4 20,659 -32.4
2005/06 564,766 -0.05 17,487,000 3.2 2004/05 239,212 -3.6 264,410 -3.6 28,418 37.6
2006/07 582,984 3.2 17,672,000 3.3 2005/06 236,342 -1.2 259,717 -1.8 30,611 7.7
2007/08 623,805 7.0 17,958,000 3.5 2006/07 238,050 0.7 264,288 1.8 38,986 27.4
2008/09 671,616 7.7 18,264,000 3.7 2007/08 243,360 2.2 276,842 4.8 46,837 20.1
* Data from the National Center for Education Statistics 2008/09 269,874 10.9 283,329 2.3 51,812 10.6
E. TOP U.S. INSTITUTIONS Hosting International Students, 2008/09 F. TOP U.S. STATES Hosting Int’l Students
Total Int’l
Rank State 2007/08 2008/09 % Change
Rank Institution City State Students
1 California 84,800 93,124 9.8
1 University of Southern California Los Angeles CA 7,482
2 New York 69,844 74,934 7.3
2 New York University New York NY 6,761
3 Texas 51,824 58,188 12.3
3 Columbia University New York NY 6,685
4 Massachusetts 31,817 33,838 6.4
4 University of Illinois - Urbana-Champaign Champaign IL 6,570
5 Florida 26,739 30,386 13.6
5 Purdue University - Main Campus West Lafayette IN 6,136
6 Illinois 28,804 29,887 3.8
6 University of Michigan - Ann Arbor Ann Arbor MI 5,790
7 Pennsylvania 26,090 27,529 5.5
7 University of Texas - Austin Austin TX 5,703
8 Michigan 22,857 23,617 3.3
8 University of California - Los Angeles Los Angeles CA 5,590
9 Ohio 19,343 20,725 7.1
9 Boston University Boston MA 5,037
10 Indiana 15,548 17,098 10.0
10 Michigan State University East Lansing MI 4,757
11 Harvard University Cambridge MA 4,735
12 University of Florida Gainesville FL 4,731 The Institute of International Education (IIE) has
13 University of Pennsylvania Philadelphia PA 4,635 conducted an annual census of international students in
14 Ohio State University - Main Campus Columbus OH 4,583 the U.S. since its founding in 1919. Known as the Open
15 Indiana University - Bloomington Bloomington IN 4,565 Doors Report since 1954, the project began receiving
16 Texas A&M University College Station TX 4,558 support from the Bureau of Educational and Cultural
17 SUNY University at Buffalo Buffalo NY 4,539 Affairs of the U.S. Department of State in the 1970s. For
18 Arizona State University - Tempe Campus Tempe AZ 4,375 more data and information, please visit us online at:
19 University of Wisconsin - Madison Madison WI 4,243 http://opendoors.iienetwork.org.
20 University of Minnesota - Twin Cities Minneapolis MN 4,120
2. INTERNATIONAL STUDENTS IN THE U.S. (CONTINUED)
G. TOP FIELDS OF STUDY of International Students, 2007/08 & 2008/09 H. PRIMARY SOURCE OF FUNDING
of International Students, 2007/08 & 2008/09
Field of Study 2007/08 2008/09 % of Total % Change % of %
Business and Management 110,906 138,565 20.6 24.9 Primary Source of Funds 2007/08 2008/09 Total Change
Engineering 96,133 118,980 17.7 23.8
Physical and Life Sciences 52,867 61,699 9.2 16.7 Personal and Family 388,821 435,879 64.9 12.1
Social Sciences 49,375 57,348 8.5 16.1 U.S. College or University 161,633 152,457 22.7 -5.7
Math and Computer Science 46,313 56,367 8.4 21.7 Home Gov’t or University 21,085 24,850 3.7 17.9
Health Professions 31,727 35,064 5.2 10.5 U.S. Government 3,282 4,030 0.6 22.8
Fine and Applied Arts 29,163 34,854 5.2 19.5 U.S. Private Sponsor 6,013 7,388 1.1 22.9
Intensive English Language 25,856 28,524 4.2 10.3 Foreign Private Sponsor 6,522 6,043 0.9 -7.3
Humanities 17,775 19,179 2.9 7.9 International Organization 1,390 1,343 0.2 -3.4
Education 17,460 18,120 2.7 3.8 Current Employment 29,399 33,581 5.0 14.2
Agriculture 8,945 8,961 1.3 0.2 Other Sources 5,660 6,045 0.9 6.8
Other Fields of Study 61,304 73,011 11.0 19.1 TOTAL 623,805 671,616 100.0 7.7
Undeclared 19,215 20,944 3.1 9.0
U.S. STUDENTS STUDYING ABROAD
I. U.S. STUDY ABROAD TRENDS J. LEADING DESTINATIONS, 2006/07 & 2007/08
262,416 U.S. students studied abroad for academic credit in 2007/08, an Almost all of the top 25 destinations saw increases in 2007/08. Non-
increase of 8.5% over the previous year. U.S. student participation in study traditional destinations are increasing in popularity – 13 of the top 25
abroad has more than tripled over the past two decades. destinations are outside Europe and 19 out of 25 are destinations where
300,000 English is not a primary language.
Rank Destination 2006/07 2007/08 % of Total % Change
250,000
TOTAL 241,791 262,416 100.0 8.5
1 United Kingdom 32,705 33,333 12.7 1.9
200,000 2 Italy 27,831 30,670 11.7 10.2
3 Spain 24,005 25,212 9.6 5.0
150,000 4 France 17,233 17,336 6.6 0.6
5 China 11,064 13,165 5.0 19.0
6 Australia 10,747 11,042 4.2 2.7
100,000 7 Mexico 9,461 9,928 3.8 4.9
8 Germany 7,355 8,253 3.1 12.2
9 Ireland 5,785 6,881 2.6 18.9
50,000
10 Costa Rica 5,383 6,096 2.3 13.2
11 Japan 5,012 5,710 2.2 13.9
0 12 Argentina 3,617 4,109 1.6 13.6
87/88
97/98
07/08
91/92
01/02
89/90
99/00
00/01
96/97
06/07
95/96
98/99
05/06
93/94
03/04
02/03
94/95
04/05
13 Greece 3,417 3,847 1.5 12.6
14 South Africa 3,216 3,700 1.4 15.0
15 Czech Republic 3,145 3,417 1.3 8.6
16 Austria 2,810 3,356 1.3 19.4
K. FIELDS OF STUDY of U.S. Study Abroad Students, 2006/07 & 2007/08 17 India 2,627 3,146 1.2 19.8
Field of Study 2006/07 2007/08 % 18 Ecuador 2,813 2,814 1.1 0.0
Total % Total % Change 19 Chile 2,824 2,739 1.0 -3.0
Social Sciences 51,673 21.4 56,419 21.5 9.2 20 Brazil 2,524 2,723 1.0 7.9
Business/Management 46,061 19.1 53,008 20.2 15.1 21 New Zealand 2,718 2,629 1.0 -3.3
Humanities 31,819 13.2 34,901 13.3 9.7 22 Israel 2,226 2,322 0.9 4.3
Fine or Applied Arts 18,576 7.7 22,043 8.4 18.7 23 Netherlands 2,139 2,038 0.8 -4.7
Physical/Life Sciences 17,691 7.3 18,894 7.2 6.8 24 Switzerland 1,771 1,942 0.7 9.7
Foreign Languages 17,306 7.2 16,270 6.2 -6.0 25 Russia 1,716 1,857 0.7 8.2
Health Professions 9,917 4.1 11,809 4.5 19.1
Education 10,189 4.2 10,759 4.1 5.6 L. HOST REGIONS of U.S. Study Abroad Students, 2006/07 & 2007/08
Engineering 7,412 3.1 8,135 3.1 9.8
Math/Computer Science 3,587 1.5 4,199 1.6 17.1 2006/07 2007/08 %
Agriculture 3,525 1.5 3,149 1.2 -10.7 Host Region* Total % Total % Change
Undeclared 7,615 3.1 8,660 3.3 13.7 Africa 10,066 4.2 11,844 4.5 17.7
Other Fields of Study 16,420 6.6 14,170 5.4 -13.7 Asia 24,969 10.3 29,125 11.1 16.6
Total 241,791 100.0 262,416 100.0 8.5 Europe 138,871 57.4 147,676 56.3 6.3
Latin America 36,339 15.0 40,181 15.3 10.6
Middle East 2,759 1.1 3,362 1.3 21.9
M. DURATION of Study Abroad, 2006/07 & 2007/08 North America 1,327 0.5 1,159 0.4 -12.7
Duration 2006/07 % 2007/08 % Oceania 13,820 5.7 14,028 5.3 1.5
Short-term (summer, January term, or eight weeks Antarctica 62 0.0 78 0.0 25.8
or less during the academic year) 55.4 56.3 Multiple 13,573 5.6 14,963 5.7 10.2
Mid-length (one or two quarters or one semester) 40.2 39.5 Total 241,791 100 262,416 100 8.5
Long-term (academic or calendar year) 4.4 4.2 * Cyprus and Turkey are included in Europe; Mexico is included in Latin America
60 years of opendoors