4. 4 Construction Starts Report - 4th Quarter 2007 to 2nd Quarter 2010 (source: www.bciasia.com)
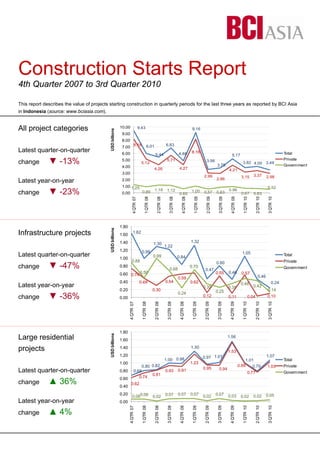
BCI Asia’s Construction Starts Report provides an immediate, historical overview of the value of projects starting construction by
category and region in recent quarters. Data is sourced from approximately 50,000 reports by BCI Asia on significant building and
construction projects (www.bciasia.com/project_leads).
While every effort has been made to ensure that the information contained herein is accurate, the publisher will not accept any liabil-
ity for omissions or errors. BCI Asia Construction Information Pte Ltd disclaims any and all liability which may be claimed arising out
of reliance upon the information presented in this publication. Copyright ® 2009 by BCI Asia Construction Information Pte Ltd. All
rights reserved.
Health projects
Latest quarter-on-quarter
change ▲ 34%
Latest year-on-year
change ▲ 3%
Community & legal
projects
Latest quarter-on-quarter
change ▲ 53%
Latest year-on-year
change ▼ -44%
All categories
by country
For BCI Asia’s construction reports, visit www.bciasia.com or call:
Bangkok + 662 651 8600
Bali + 62 361 757 426
Bandung + 62 22 520 2721
Brisbane + 61 7 3634 8500
Hanoi + 84 4 3537 8548
Ho Chi Minh City + 84 8 997 4220
Hong Kong + 852 2538 0011
Jakarta + 62 21 5790 2930
Johor Baru + 607 353 6892
Kuala Lumpur + 60 3 7661 1380
Manila + 63 2 884 1122
Melbourne + 61 3 8412 7900
Perth + 61 8 9228 2227
Penang + 604 619 2599
Surabaya + 62 31 547 3439
Singapore + 65 6538 6836
0.08
0.06
0.05
0.06 0.07
0.07
0.10
0.16
0.12
0.10
0.08
0.11
0.04
0.03
0.03 0.03
0.04
0.05
0.04
0.09 0.08
0.07
0.07
0.05
0.04
0.04
0.02 0.03
0.04
0.02
0.06 0.07
0.04
0.03
0.01
0.06
0.00
0.02
0.04
0.06
0.08
0.10
0.12
0.14
0.16
0.18
4QTR07
1QTR08
2QTR08
3QTR08
4QTR08
1QTR09
2QTR09
3QTR09
4QTR09
1QTR10
2QTR10
3QTR10
USDbillions
Total
Private
Government
0.04
0.05
0.02
0.04
0.03
0.08
0.04
0.04
0.02
0.02
0.02
0.04
0.02
0.02
0.02
0.01 0.01
0.05
0.02
0.01
0.01 0.01 0.01
0.01
0.02
0.04
0.01
0.03
0.02 0.02
0.02
0.03
0.01 0.01
0.02
0.02
0.00
0.01
0.02
0.03
0.04
0.05
0.06
0.07
0.08
4QTR07
1QTR08
2QTR08
3QTR08
4QTR08
1QTR09
2QTR09
3QTR09
4QTR09
1QTR10
2QTR10
3QTR10
USDbillions
Total
Private
Government
0.0
2.0
4.0
6.0
8.0
10.0
12.0
14.0
16.0
4QTR07
1QTR08
2QTR08
3QTR08
4QTR08
1QTR09
2QTR09
3QTR09
4QTR09
1QTR10
2QTR10
3QTR10
USDbillions
Indonesia
Malaysia
Philippines
Singapore
Hong Kong
Thailand
Vietnam