SlideShare une entreprise Scribd logo
1  sur  16
Télécharger pour lire hors ligne
SINGLE FAMILY RESIDENTIAL BREAKDOWN


                                                                                                                                                             1.8 % 7.5% %
                                                                                                                                  21.5 %                               0.3
June 2009                                                                                                                                                                  0.1 %


BEST JUNE ON RECORD                                                                                                 7.9 %


TORONTO - Monday, July 6, 2009
                                                                                                                       10.6 %                                                       50.3 %
In June 2009, Greater Toronto                  Mercer, TREB’s Senior Manager of
REALTORS® reported a record 10,955             Market Analysis. “Look for sales to
sales, up 27 per cent from June 2008.          remain high relative to listings in the
                                                                         2.3 %                                                  Dwelling Type             Sales        %     Median
The seasonally adjusted annual rate of         second half of% the year. This7.0 0.3keep
                                                                                %
                                                         21.5                  will % %
                                                                                     0.1                                      Single Detached 5,509 98
                                                                                                                               Detached                                      $420,000
sales in June was 100,700.1                    home prices growing.”                                                          Semi Detached
                                                                                                                               Semi-Detached             1,166       99      $340,000

“The record result in June is testament                                                                                       Condo T.H.
                                                                                                                               Condo Townhouse              861      98      $264,500
                                               1
                                                Seasonally adjusting TREB MLS® data removes recurring                         Condo Apt.
                                                                                                                               Condo Apt                 2,355       97      $257,000
to the fundamentally sound housing                  8.5 %
                                               seasonal trends observed each year. For example, MLS®                          Link
                                                                                                                               Link                         201      99      $325,000
market in the GTA,” said TREB President        sales are highest in late spring each year and lowest in the                   Attached/Row
                                                                                                                               Att/Row/Twnhouse             824      98      $312,500
Tom Lebour. “An increasing number              winter months. Removing the recurring seasonality, allows for                  Co-op Apt.
                                                         12.0 %                                                                Co-op Apt                      28     96      $192,500
                                               the analysis of a meaningful trend reflecting actual changes48.3 %
of households have been confident                                                                                             Detached Condo
                                                                                                                               Det Condo                      11     98      $435,000
                                               in market conditions. By multiplying the monthly seasonally-
in purchasing a home in the region’s
                                               adjusted figure by 12, creating an annual rate, we can compare
affordable and diverse resale housing          how the current month relates to historical annual figures.                        Housing Market Indicators
market.”                                                                                                                                     June 2008           June 2009        %Change
                                                                                                                     Sales                        8,600              10,955           (27%)
The average price for June transactions
                                                        Median Price
                                                                                                                     New Listings                16,069              13,357           (-17%)
                                                                                                                     Active Listings*            26,697              18,704          (-30%)
was $403,972 – up by two per cent                                                                                    Days on Market                  34                  33            (-3%)
compared to the same month last year.                                                                                * All figures for single-family dwellings.
                                                   In June the median price was
“The re-emergence of seller’s market               $345,000,          from       the     $335,250
conditions has exerted upward pressure             recorded during June of 2008. n
on home prices,” explained Jason                                                                                    Inside
                                                                                                                    District Map ............................................................. 2
                          Annual Average and Median Price                                                           Price Category Breakdown......................................2
                                                                                                                    East District ............................................................. 3
                                                                                                                    West District ............................................................ 6
                                                                                                                    Toronto District ......................................................10
   400000            Average          Median
                                                                                                                    North District..........................................................12
   300000
                                                                                                                    Annual Summary ...................................................16
                                                                                                                    Single Family Comparison ....................................16
   200000

   100000

       0
            1999   2000   2001   2002 2003   2004    2005     2006     2007     2008      2009
District Map


                                Price Category Breakdown - June 2009
         Price Range         Total S.F.D   %S.F.D   Condo Apt. %Condo Apt. Condo T.H. %Condo T.H.
    -           -    $90,000        40        0.4         26        1.1           5         0.6
    $90,001     -   $100,000        17        0.2         12        0.5           1         0.1
    $100,001    -   $110,000        18        0.2         14        0.6           3         0.3
    $110,001    -   $120,000        28        0.3         22        0.9           2         0.2
    $120,001    -   $130,000        51        0.5         41        1.7           3         0.3
    $130,001    -   $140,000        55        0.5         41        1.7           5         0.6
    $140,001    -   $150,000        82        0.7         56        2.4          13         1.5
    $150,001    -   $160,000        90        0.8         52        2.2          20         2.3
    $160,001    -   $170,000       128        1.2         90        3.8          13         1.5
    $170,001    -   $180,000       149        1.4         87        3.7          16         1.9
    $180,001    -   $190,000       168        1.5        103        4.4          25         2.9
    $190,001    -   $200,000       167        1.5         73        3.1          35         4.1
    $200,001    -   $225,000       530        4.8        237       10.1          95        11.0
    $225,001    -   $250,000       726        6.6        266       11.3         128        14.9
    $250,001    -   $300,000     1,770      16.2         500       21.2         242        28.1
    $300,001    -   $400,000     3,070      28.0         458       19.4         180        20.9
    $400,001    -   $500,000     1,691      15.4         144        6.1          30         3.5
    $500,001    -   $750,000     1,524      13.9          98        4.2          30         3.5
    $750,001    - $1,000,000       360        3.3         17        0.7           8         0.9
    $1,000,001 - $1,500,000        192        1.8         13        0.6           7         0.8
    $1,500,001 -           -        99        0.9          5        0.2            -          -
        Total:                 10,955        100       2,355       100          861        100

2   TORONTO REAL ESTATE BOARD
East District


                                Current Month: June 2009
Area   Active    New    Sales      $ Volume          Avg Price      Med Price     Avg DOM   Avg %List
E01     120       162     120     $57,898,431        $482,487        $471,000          18         102
E02      77       122     108     $58,000,436        $537,041        $463,250          18         101
E03     184       197     153     $62,878,793        $410,973        $394,000          23         100
E04     152       144     115     $30,945,211        $269,089        $286,000          24          98
E05     170       149     118     $35,118,902        $297,618        $263,750          28          98
E06     108       104      66     $23,220,619        $351,828        $355,000          20          99
E07     132       157     133     $39,628,568        $297,959        $306,000          24          98
E08     193       150     107     $32,891,750        $307,400        $299,900          29          98
E09     210       153     109     $29,029,701        $266,328        $260,000          30          98
E10     118        91      78     $29,408,940        $377,038        $364,500          28          99
E11     224       170     138     $36,696,211        $265,915        $248,250          37          98
E12      44        42      40     $12,378,100        $309,453        $295,000          33          98
E13     256       179     125     $41,275,926        $330,207        $302,000          34          98
E14     303       215     202     $61,062,568        $302,290        $284,750          37          98
E15     280       239     199     $58,618,340        $294,565        $274,000          33          98
E16     630       366     247     $55,028,874        $222,789        $212,000          37          97
E17     319       221     152     $36,946,180        $243,067        $234,000          34          98
E18      26        11       7      $4,238,000        $605,429        $567,500          59          96
E19      93        61      49     $17,055,110        $348,063        $342,000          38          98
E20     132        50      41     $10,759,400        $262,424        $251,000          45          97
E21     193        84      53     $16,805,200        $317,079        $282,000          65          96
TOTAL 3,964     3,067   2,360    $749,885,260        $317,748        $290,550          31          98


                                  Year-to-Date: June 2009
Area   Listed   Sales       $ Volume            Avg Price        Med Price      Avg DOM     Avg %List
E01      675      448     $199,416,444           $445,126         $423,500            22         100
E02      608      420     $228,653,535           $544,413         $458,500            22          99
E03    1,031      669     $246,125,859           $367,901         $353,500            28          98
E04      698      447     $115,533,192           $258,464         $275,000            32          97
E05      734      476     $142,283,298           $298,914         $271,000            37          97
E06      507      278     $102,338,052           $368,122         $341,250            30          97
E07      670      478     $133,300,697           $278,872         $269,900            35          97
E08      783      439     $127,071,746           $289,457         $286,500            35          97
E09      780      492     $122,445,923           $248,874         $244,500            37          97
E10      461      269      $95,733,192           $355,885         $350,000            34          97
E11      861      482     $127,478,849           $264,479         $260,000            38          97
E12      206      114      $34,426,700           $301,989         $275,000            33          97
E13      953      495     $158,825,084           $320,859         $291,000            38          97
E14    1,310      756     $224,672,115           $297,185         $282,450            37          98
E15    1,388      838     $240,531,146           $287,030         $270,500            37          98
E16    2,168    1,057     $226,845,834           $214,613         $201,000            40          97
E17    1,254      657     $158,055,068           $240,571         $229,600            43          97
E18       56       13       $6,930,000           $533,077         $543,000            62          95
E19      417      214      $71,605,995           $334,607         $312,250            40          97
E20      343      126      $34,668,550           $275,147         $242,000            53          97
E21      466      189      $56,389,742           $298,358         $278,000            63          96
TOTAL 16,369    9,357   $2,853,331,021           $304,941         $280,000            36          97


                                                                    TORONTO REAL ESTATE BOARD       3
SINGLE FAMILY EAST BREAKDOWN - JuNE 2009                                East District


                              East District                                                     East District
      80                     Days on Market                             80               Sales Active Listing Ratio

      60                                                                60


      40                                                                40


      20                                                                20


       0                                                                 0
            Jun   Jul Aug Sep Oct Nov Dec Jan Feb Mar Apr May Jun            Jun   Jul Aug Sep Oct Nov Dec Jan Feb Mar Apr May Jun

           2008                                              2009            2008                                           2009


     Detached Houses                                                   Semi-Detached Houses
Area Act Sales Av. Price                Med. Price % S-A Av. % List Area Act Sales Av. Price Med. Price % S-A Av. % List
E01         29      24     $545,550      $486,500     82.8      102   E01     39        65      $483,096      $485,600    166.7      104
E02         43      39     $670,944      $640,000     90.7      100   E02     14        42      $488,779      $450,500    300.0      102
E03         89      94     $472,073      $427,658    105.6      100   E03     25        28      $421,996      $406,685    112.0      103
E04         55      63     $325,738      $327,500    114.6       99   E04      8        12      $259,917      $260,000    150.0       97
E05         36      35     $442,014      $436,000     97.2      100   E05      5         5      $352,638      $361,888    100.0       99
E06         89      45     $352,927      $339,900     50.6       99   E06     10        11      $336,373      $300,600    110.0       99
E07         34      54     $396,350      $382,500    158.8       99   E07      9         5      $325,118      $315,000     55.6      100
E08        121      70     $374,884      $341,250     57.9       98   E08      4         2      $254,500      $254,500     50.0       99
E09         64      45     $328,444      $320,000     70.3       98   E09     11         1      $241,500      $241,500      9.1      101
E10         89      60     $405,276      $390,925     67.4       98   E10      -         6      $309,250      $318,750        -       98
E11         77      53     $360,010      $373,000     68.8       98   E11     24        17      $272,100      $268,200     70.8       98
E12         26      29     $338,021      $321,000    111.5       98   E12      3         1      $266,000      $266,000     33.3      101
E13        166      74     $397,868      $372,000     44.6       98   E13     13         3      $271,633      $250,000     23.1       97
E14        189     149     $330,073      $319,000     78.8       98   E14     20        10      $252,990      $246,450     50.0       98
E15        180     135     $326,743      $305,000     75.0       98   E15      9         7      $222,070      $235,000     77.8       98
E16        482     184     $242,394      $227,000     38.2       97   E16     48        30      $172,279      $176,250     62.5       98
E17        230      90     $271,230      $250,000     39.1       98   E17      4         6      $165,083      $184,750    150.0       96
E18         26       7     $605,429      $567,500     26.9       96   E18      -         -             -             -        -        -
E19         80      39     $371,672      $364,000     48.8       98   E19      -         -             -             -        -        -
E20        113      34     $273,350      $271,500     30.1       97   E20      -         -             -             -        -        -
E21        187      53     $317,079      $282,000     28.3       96   E21      4         -             -             -        -        -


4     TORONTO REAL ESTATE BOARD
SINGLE FAMILY EAST BREAKDOWN - JuNE 2009                           East District


     Condo Apartment                                                     Link
Area Act Sales Av. Price    Med. Price % S-A Av. % List Area Act      Sales Av. Price       Med. Price % S-A Av. % List
E01   31   14    $437,957    $432,000 45.2       98    E01        -        -            -            -       -        -
E02   13   11    $419,673    $382,500 84.6       97    E02        -        -            -            -       -        -
E03   52   27    $206,300    $160,000 51.9       98    E03        -        -            -            -       -        -
E04   63   29    $151,041    $153,000 46.0       96    E04        -        -            -            -       -        -
E05   95   44    $213,993    $214,250 46.3       97    E05        4        3     $347,667     $360,000    75.0      100
E06    3    3    $326,333    $340,000 100.0      98    E06        -        -            -            -       -        -
E07   74   46    $181,837    $181,000 62.2       97    E07        4       11     $330,418     $338,000   275.0       98
E08   48   26    $144,381    $135,250 54.2       96    E08        -        -            -            -       -        -
E09   90   53    $226,175    $225,000 58.9       97    E09        -        -            -            -       -        -
E10    7    2    $140,000    $140,000 28.6       97    E10        -        1     $284,000     $284,000       -       98
E11   54   26    $139,481    $141,500 48.2       97    E11        5        1     $300,000     $300,000    20.0       96
E12    3    3    $164,500    $164,000 100.0      96    E12        1        1     $265,000     $265,000   100.0       98
E13   20   12    $200,575    $181,000 60.0       97    E13        1        4     $285,000     $292,000   400.0       99
E14   14   12    $167,292    $165,000 85.7       96    E14        7        4     $248,250     $243,250    57.1       99
E15   26    6    $199,083    $190,750 23.1       97    E15       10       12     $252,908     $248,500   120.0       99
E16   30    6    $171,333    $166,000 20.0       97    E16        9        7     $202,714     $203,000    77.8       97
E17   13    8    $156,000    $148,500 61.5       96    E17       26       22     $224,350     $224,900    84.6       98
E18    -    -           -           -     -       -    E18        -        -            -            -       -        -
E19    1    -           -           -     -       -    E19        4        2     $267,000     $267,000    50.0       98
E20   10    4    $176,125    $176,500 40.0       94    E20        4        2     $230,500     $230,500    50.0       98
E21    2    -           -           -     -       -    E21        -        -            -            -       -        -


     Condo Townhouse                                       Detached Condo
Area Act Sales Av. Price Med. Price % S-A Av. % List Area Act Sales Av. Price               Med. Price % S-A Av. % List
E01    4    2    $367,400   $367,400    50.0    101   E01    -        -           -            -          -     -
E02    3    3    $426,633   $405,000   100.0     99   E02    -        -           -            -          -     -
E03    6    1    $224,000   $224,000    16.7     97   E03    -        -           -            -          -     -
E04   20    7    $260,357   $242,000    35.0     98   E04    -        -           -            -          -     -
E05   29   30    $237,384   $240,900   103.5     97   E05    -        -           -            -          -     -
E06    2    -           -          -       -      -   E06    -        -           -            -          -     -
E07    9    9    $261,289   $247,000   100.0     98   E07    -        -           -            -          -     -
E08   18    2    $182,000   $182,000    11.1     98   E08    -        -           -            -          -     -
E09   40    9    $188,011   $195,000    22.5     99   E09    -        -           -            -          -     -
E10   16    2    $196,000   $196,000    12.5     99   E10    -        -           -            -          -     -
E11   43   21    $204,252   $202,000    48.8     98   E11    -        2    $210,500     $210,500          -    99
E12    4    4    $172,750   $169,500   100.0     97   E12    -        -           -            -          -     -
E13   27   19    $223,394   $225,000    70.4     96   E13    1        1    $229,900     $229,900      100.0   100
E14   36    9    $196,433   $210,900    25.0     97   E14    1        -           -            -          -     -
E15   29   12    $194,867   $193,700    41.4     98   E15    -        -           -            -          -     -
E16   54   12    $113,208   $112,500    22.2     97   E16    -        -           -            -          -     -
E17   11    1    $264,500   $264,500     9.1     98   E17    -        -           -            -          -     -
E18    -    -           -          -       -      -   E18    -        -           -            -          -     -
E19    -    1    $295,000   $295,000       -     99   E19    -        -           -            -          -     -
E20    5    1    $300,000   $300,000    20.0     97   E20    -        -           -            -          -     -
E21    -    -           -          -       -      -   E21    -        -           -            -          -     -


                                                                               TORONTO REAL ESTATE BOARD            5
SINGLE FAMILY EAST BREAKDOWN - JuNE 2009                     East District
           Co-op Apartment                                     Attached/Row/Townhouse
Area Act Sales          Av. Price   Med. Price % S-A Av. % List Area Act Sales     Av. Price   Med. Price % S-A Av. % List
E01        -       -           -            -     -      -    E01    17      15   $435,853     $455,000     88.2      102
E02        2       2    $272,500     $272,500 100.0     95    E02     2      11   $442,145     $425,000    550.0      100
E03        4       1    $169,900     $169,900 25.0     100    E03     8       2   $362,000     $362,000     25.0       97
E04        2       1     $84,000      $84,000 50.0      84    E04     4       3   $339,333     $339,500     75.0       97
E05        -       -           -            -     -      -    E05     1       1   $305,000     $305,000    100.0       99
E06        -       -           -            -     -      -    E06     4       7   $379,974     $374,900    175.0       99
E07        -       1    $195,000     $195,000     -     98    E07     2       7   $293,486     $295,500    350.0       99
E08        -       -           -            -     -      -    E08     2       7   $289,000     $289,900    350.0       98
E09        -       -           -            -     -      -    E09     5       1   $328,800     $328,800     20.0       97
E10        -       -           -            -     -      -    E10     6       7   $325,843     $335,500    116.7      100
E11        -       -           -            -     -      -    E11    21      18   $241,844     $235,250     85.7       97
E12        -       -           -            -     -      -    E12     7       2   $430,000     $430,000     28.6       96
E13        -       -           -            -     -      -    E13    28      12   $249,792     $244,500     42.9       98
E14        -       -           -            -     -      -    E14    36      18   $254,633     $252,000     50.0       98
E15        -       -           -            -     -      -    E15    26      27   $236,509     $239,000    103.9       98
E16        -       -           -            -     -      -    E16     7       8   $181,813     $188,500    114.3       97
E17        -       -           -            -     -      -    E17    35      25   $203,872     $207,500     71.4       98
E18        -       -           -            -     -      -    E18     -       -          -            -        -        -
E19        -       -           -            -     -      -    E19     8       7   $247,271     $246,000     87.5       99
E20        -       -           -            -     -      -    E20     -       -          -            -        -        -
E21        -       -           -            -     -      -    E21     -       -          -            -        -        -


                                                                                                    West District
                                             Current Month: June 2009
    Area       Active      New       Sales      $ Volume         Avg Price         Med Price     Avg DOM       Avg %List
W01      84                  88         79      $40,636,213      $514,382           $465,000              20        101
W02     100                 120        110      $50,403,440      $458,213           $425,500              19        101
W03     190                 139         83      $24,519,091      $295,411           $291,000              35         97
W04     207                 120         83      $28,908,476      $348,295           $335,000              39         97
W05     426                 205        128      $35,618,450      $278,269           $291,500              41         97
W06     245                 196        160      $58,468,368      $365,427           $355,000              37         98
W07     148                 134         82      $39,719,603      $484,385           $440,500              21         99
W08     253                 177        172     $102,639,463      $596,741           $475,000              32         97
W09     155                  91         57      $19,605,110      $343,949           $350,000              34         98
W10     303                 171        114      $28,223,588      $247,575           $275,000              35         96
W12     241                 154        119      $60,622,963      $509,437           $410,000              35         97
W13     208                 131        118      $60,991,899      $516,881           $416,500              36         97
W14     128                  89         62      $21,914,900      $353,466           $328,750              31         97
W15     445                 287        222      $54,279,629      $244,503           $219,950              40         97
W16     171                 130        115      $44,363,051      $385,766           $347,000              29         98
W17       -                   -          -                -             -                  -               -          -
W18     156                  69         31       $7,682,000      $247,806           $263,000              28         96
W19     412                 338        297     $110,129,089      $370,805           $355,000              28         98
W20     438                 428        437     $163,017,567      $373,038           $348,900              29         98
W21     407                 237        219     $110,482,988      $504,489           $424,000              37         98
W22     135                 141        164      $56,699,644      $345,730           $325,250              29         99
W23     928                 721        541     $174,635,077      $322,801           $309,000              33         98
W24     753                 501        360     $123,843,561      $344,010           $320,250              37         97
W25     113                  62         50      $20,392,125      $407,843           $300,000              47         97
W26      31                  11          1         $260,000      $260,000           $260,000              22         98
W27     201                 112        124      $45,556,810      $367,394           $349,000              39         97
W28     253                 127        109      $47,661,100      $437,258           $410,000              51         97
W29     179                  76         60      $18,272,100      $304,535           $278,450              52         97
TOTAL 7,310               5,055      4,097   $1,549,546,305      $378,215           $335,000              34         98


6      TORONTO REAL ESTATE BOARD
SINGLE FAMILY WEST BREAKDOWN - JuNE 2009                            West District


                          West District                                                     West District
   80                    Days on Market                              80              Sales Active Listing Ratio

   60                                                                60


   40                                                                40


   20                                                                20


    0                                                                 0
        Jun   Jul Aug Sep Oct Nov Dec Jan Feb Mar Apr May Jun             Jun   Jul Aug Sep Oct Nov Dec Jan Feb Mar Apr May Jun

        2008                                            2009              2008                                            2009


                                                  Year-to-Date: June 2009
Area          Listed      Sales            $ Volume             Avg Price            Med Price        Avg DOM         Avg %List
W01          453            318         $141,480,789             $444,908              $384,750                31                 99
W02          601            403         $185,169,527             $459,478              $416,000                24                 99
W03          656            313          $90,869,229             $290,317              $287,000                40                 96
W04          669            314          $97,410,987             $310,226              $305,000                43                 96
W05        1,106            448         $123,241,351             $275,092              $290,000                44                 96
W06          981            555         $196,804,800             $354,603              $335,000                40                 97
W07          553            330         $151,556,753             $459,263              $425,000                33                 98
W08          980            548         $305,968,950             $558,338              $450,000                39                 96
W09          489            230          $73,221,642             $318,355              $325,500                37                 97
W10          900            458         $107,994,665             $235,796              $250,000                43                 96
W12          843            443         $219,420,935             $495,307              $405,000                39                 96
W13          741            377         $194,222,053             $515,178              $415,000                39                 96
W14          496            282          $93,741,135             $332,415              $319,000                37                 97
W15        1,683            857         $205,193,246             $239,432              $219,000                41                 97
W16          726            402         $146,112,449             $363,464              $341,000                34                 97
W17            -              -                    -                    -                     -                 -                  -
W18          398            147          $35,419,302             $240,948              $250,000                39                 96
W19        1,864          1,090         $397,437,235             $364,621              $350,000                33                 97
W20        2,337          1,432         $522,396,007             $364,802              $342,000                33                 97
W21        1,520            787         $406,262,870             $516,217              $430,000                41                 97
W22        1,020            742         $248,620,058             $335,067              $317,000                32                 98
W23        3,919          2,105         $652,936,469             $310,184              $296,000                35                 97
W24        2,866          1,396         $457,766,705             $327,913              $311,950                37                 97
W25          339            195          $72,876,513             $373,726              $318,000                52                 97
W26           45             15          $10,447,500             $696,500              $570,000               167                 96
W27          773            470        $164,654,165              $350,328              $329,250                41                 97
W28          768            420        $183,945,401              $437,965              $397,750                51                 97
W29          513            287          $83,599,052             $291,286              $266,000                51                 97
TOTAL     28,239         15,364       $5,568,769,788             $362,456              $324,000                38                 97


                                                                                          TORONTO REAL ESTATE BOARD               7
SINGLE FAMILY WEST BREAKDOWN - JuNE 2009                   West District
     Detached Houses                                          Semi-Detached Houses
Area Act Sales Av. Price       Med. Price % S-A Av. % List Area Act Sales Av. Price Med. Price % S-A Av. % List
W01     30    30   $759,783    $715,000   100.0    101   W01   8       11    $537,282    $550,000   137.5    106
W02     32    42   $587,000    $572,290   131.3    101   W02 28        41    $397,779    $395,000   146.4    102
W03    117    41   $307,937    $291,000    35.0     97   W03 41        25    $323,390    $324,900    61.0     98
W04     89    49   $438,526    $390,000    55.1     97   W04 16        7     $330,286    $345,000    43.8     96
W05     82    33   $370,421    $360,000    40.2     98   W05 89        42    $335,602    $315,000    47.2     97
W06     61    69   $396,145    $382,500   113.1     98   W06   4       6     $426,833    $392,750   150.0     97
W07     65    40   $613,748    $599,000    61.5    100   W07   1       -            -           -       -      -
W08    148   102   $815,519    $717,594    68.9     97   W08   2       2     $374,500    $374,500   100.0     97
W09     42    28   $473,854    $444,055    66.7    100   W09   2       4     $321,250    $316,000   200.0     97
W10     82    49   $328,663    $319,700    59.8     97   W10   8       7     $293,429    $291,000    87.5     97
W12    147    75   $623,028    $535,000    51.0     97   W12 18        6     $381,477    $380,931    33.3     97
W13    140    71   $676,274    $615,000    50.7     96   W13 23        17    $299,353    $298,000    73.9     97
W14     27    23   $527,652    $530,000    85.2     98   W14   5       8     $344,450    $341,000   160.0     97
W15     20    19   $458,763    $417,000    95.0     97   W15 15        10    $362,750    $367,250    66.7     99
W16     79    56   $460,637    $409,000    70.9     98   W16 16        21    $326,295    $333,000   131.3     97
W17      -     -          -           -       -      -   W17   -       -            -           -       -      -
W18     69    10   $284,300    $288,500    14.5     97   W18 31        9     $261,389    $263,000    29.0     94
W19    121   116   $479,152    $462,550    95.9     98   W19 33        58    $352,694    $351,250   175.8     99
W20    196   196   $474,706    $447,000   100.0     98   W20 57        87    $343,229    $346,500   152.6     99
W21    281   137   $611,616    $530,000    48.8     97   W21   6       11    $363,582    $332,000   183.3     98
W22     90    76   $412,819    $395,250    84.4     98   W22 13        26    $315,992    $317,500   200.0     99
W23    605   345   $356,205    $345,000    57.0     97   W23 159       104   $278,140    $281,000    65.4     98
W24    435   205   $413,314    $407,500    47.1     97   W24 103       61    $294,284    $291,001    59.2     97
W25     56    24   $535,884    $418,000    42.9     97   W25   2       1     $241,000    $241,000    50.0     96
W26     31     1   $260,000    $260,000     3.2     98   W26   -       -            -           -       -      -
W27    168    96   $400,795    $382,500    57.1     97   W27   5       8     $270,313    $280,000   160.0     98
W28    235    90   $462,956    $420,050    38.3     97   W28   5       10    $320,720    $322,050   200.0     98
W29    121    41   $348,556    $330,000    33.9     97   W29 13        10    $214,730    $218,150    76.9     98


      Condo Apartment                                                 Link
Area Act Sales     Av. Price   Med. Price % S-A Av. % List Area Act Sales    Av. Price   Med. Price % S-A Av. % List
W01    36 31       $292,619    $265,000 86.1       99    W01    -     -             -           -       -       -
W02    22 12       $308,269    $280,714 54.6      100    W02    -     -             -           -       -       -
W03    24 10       $199,275    $196,000 41.7       97    W03    -     -             -           -       -       -
W04    57 18       $141,461    $140,000 31.6       96    W04    1     -             -           -       -       -
W05   124 35       $148,523    $149,000 28.2       95    W05    1     -             -           -       -       -
W06   150 64       $292,287    $275,000 42.7       98    W06    -     -             -           -       -       -
W07    65 29       $294,855    $288,000 44.6       98    W07    -     -             -           -       -       -
W08    88 60       $263,171    $216,500 68.2       97    W08    -     -             -           -       -       -
W09    91 21       $198,143    $155,000 23.1       96    W09    -     -             -           -       -       -
W10   160 47       $157,039    $147,000 29.4       94    W10    -     2      $288,000    $288,000       -      96
W12    50 19       $245,637    $212,000 38.0       96    W12    -     -             -           -       -       -
W13    17   6      $174,417    $177,500 35.3       95    W13    -     -             -           -       -       -
W14    48 14       $176,414    $174,450 29.2       96    W14    1     -             -           -       -       -
W15   347 160      $211,364    $208,500 46.1       97    W15    -     -             -           -       -       -
W16    24 10       $348,440    $222,000 41.7       95    W16    2     -             -           -       -       -
W17     -   -             -           -     -       -    W17    -     -             -           -       -       -
W18    31   1      $120,500    $120,500   3.2      97    W18    -     -             -           -       -       -
W19   133 40       $217,345    $214,250 30.1       97    W19    4     2      $369,750    $369,750    50.0     103
W20    34 33       $191,448    $183,000 97.1       97    W20    2     3      $372,667    $352,000   150.0      99
W21    44 16       $245,563    $235,250 36.4       97    W21    6     6      $303,633    $307,500   100.0      97
W22     3   5      $217,800    $225,000 166.7      97    W22    1     -             -           -       -       -
W23    26 11       $202,000    $199,000 42.3       97    W23    1     4      $313,725    $323,700   400.0     100
W24    84 31       $172,142    $171,000 36.9       96    W24    4     4      $311,250    $312,750   100.0      98
W25    23 10       $304,550    $183,500 43.5       96    W25    2     -             -           -       -       -
W26     -   -             -           -     -       -    W26    -     -             -           -       -       -
W27     9   3      $251,167    $262,000 33.3       97    W27    5     1      $225,000    $225,000    20.0      96
W28     -   -             -           -     -       -    W28    1     -             -           -       -       -
W29    22   1      $262,000    $262,000   4.6      99    W29    -     -             -           -       -       -
8     TORONTO REAL ESTATE BOARD
SINGLE FAMILY WEST BREAKDOWN - JuNE 2009                West District
     Condo Townhouse                                       Detached Condo
Area Act Sales Av. Price Med. Price % S-A Av. % List Area Act Sales Av. Price      Med. Price % S-A Av. % List
W01     7    2   $343,750    $343,750    28.6   102    W01    -     -          -           -       -          -
W02     3    9   $289,033    $269,900   300.0   101    W02    -     -          -           -       -          -
W03     1    2   $272,100    $272,100   200.0    98    W03    -     -          -           -       -          -
W04    31    5   $268,380    $243,000    16.1   100    W04    -     -          -           -       -          -
W05   114   15   $220,587    $228,000    13.2    96    W05    -     -          -           -       -          -
W06    11   10   $498,750    $418,500    90.9    97    W06    -     -          -           -       -          -
W07     2    4   $493,500    $494,500   200.0    99    W07    -     -          -           -       -          -
W08     9    7   $316,771    $360,000    77.8    98    W08    -     -          -           -       -          -
W09    15    2   $209,900    $209,900    13.3   100    W09    -     -          -           -       -          -
W10    45    6   $190,458    $193,375    13.3    96    W10    -     -          -           -       -          -
W12    20   16   $319,625    $296,000    80.0    97    W12    4     2   $784,000    $784,000    50.0         99
W13    25   19   $253,918    $249,900    76.0    97    W13    -     1   $855,000    $855,000       -         97
W14    44   17   $267,853    $278,000    38.6    97    W14    -     -          -           -       -          -
W15    63   33   $245,982    $248,000    52.4    97    W15    -     -          -           -       -          -
W16    47   27   $293,030    $253,000    57.5    97    W16    -     -          -           -       -          -
W17     -    -          -           -       -     -    W17    -     -          -           -       -          -
W18    22   11   $215,091    $190,000    50.0    96    W18    -     -          -           -       -          -
W19   102   56   $284,516    $287,500    54.9    98    W19    -     -          -           -       -          -
W20   115   86   $260,846    $257,450    74.8    98    W20    2     -          -           -       -          -
W21    32   15   $265,167    $262,500    46.9    97    W21    1     -          -           -       -          -
W22     7    5   $249,900    $210,500    71.4    97    W22    -     -          -           -       -          -
W23    80   27   $229,363    $237,000    33.8    97    W23    -     -          -           -       -          -
W24    83   26   $201,115    $194,500    31.3    96    W24    6     1   $435,000    $435,000    16.7         98
W25    17    7   $278,129    $235,000    41.2    99    W25    1     -          -           -       -          -
W26     -    -          -           -       -     -    W26    -     -          -           -       -          -
W27     5    8   $197,688    $195,000   160.0    98    W27    -     -          -           -       -          -
W28     6    2   $365,500    $365,500    33.3    94    W28    -     -          -           -       -          -
W29     8    2   $158,000    $158,000    25.0    95    W29    -     -          -           -       -          -


      Co-op Apartment                                    Attached/Row/Townhouse
Area Act Sales Av. Price    Med. Price % S-A Av. % List Area Act Sales Av. Price Med. Price % S-A Av. % List
W01    -    -           -           -       -    -    W01     3     5   $434,783   $465,101    166.7     105
W02    5    -           -           -       -    -    W02    10     6   $523,333   $536,000     60.0     100
W03    -    -           -           -       -    -    W03     7     5   $254,400   $247,000     71.4      96
W04    1    -           -           -       -    -    W04    12     4   $305,125   $305,250     33.3      99
W05    9    1     $51,000     $51,000    11.1   85    W05     7     2   $370,575   $370,575     28.6      98
W06    8    1    $132,000    $132,000    12.5   95    W06    11    10   $474,750   $459,000     90.9      99
W07    3    1    $122,000    $122,000    33.3   94    W07    12     8   $565,363   $538,750     66.7      98
W08    3    -           -           -       -    -    W08     3     1   $699,900   $699,900     33.3     100
W09    4    1    $181,500    $181,500    25.0   98    W09     1     1   $289,900   $289,900    100.0     100
W10    1    -           -           -       -    -    W10     7     3   $321,833   $320,000     42.9      98
W12    1    -           -           -       -    -    W12     1     1   $257,900   $257,900    100.0      98
W13    -    -           -           -       -    -    W13     3     4   $290,375   $306,750    133.3      97
W14    -    -           -           -       -    -    W14     3     -          -          -        -       -
W15    -    -           -           -       -    -    W15     -     -          -          -        -       -
W16    -    -           -           -       -    -    W16     3     1   $319,000   $319,000     33.3     100
W17    -    -           -           -       -    -    W17     -     -          -          -        -       -
W18    -    -           -           -       -    -    W18     3     -          -          -        -       -
W19    -    -           -           -       -    -    W19    19    25   $349,000   $348,000    131.6      98
W20    -    -           -           -       -    -    W20    32    32   $320,177   $313,000    100.0      98
W21    -    -           -           -       -    -    W21    37    34   $381,292   $327,000     91.9      98
W22    -    -           -           -       -    -    W22    21    52   $284,060   $290,000    247.6      99
W23    -    -           -           -       -    -    W2 3   57    50   $262,965   $262,250     87.7      98
W24    -    -           -           -       -    -    W24    38    32   $278,672   $274,750     84.2      97
W25    -    -           -           -       -    -    W25    12     8   $287,188   $284,250     66.7      98
W26    -    -           -           -       -    -    W26     -     -          -          -        -       -
W27    -    -           -           -       -    -    W27     9     8   $294,750   $290,750     88.9      98
W28    -    -           -           -       -    -    W28     6     7   $293,843   $280,000    116.7      98
W29    -    -           -           -       -    -    W29    15     6   $209,333   $210,000     40.0      97
                                                                        TORONTO REAL ESTATE BOARD        9
Central District
                                                 Current Month: June 2009
Area       Active           New        Sales         $ Volume           Avg Price             Med Price       Avg DOM         Avg%List
C01     667                574          481       $174,581,475          $362,955               $316,000                 30             99
C02     188                128          113         $90,501,384         $800,897               $605,000                 40             99
C03     126                105           85         $74,056,688         $871,255               $620,000                 32             99
C04     241                186          156        $117,428,273          $752,745              $664,000                 28             98
C06      58                 57           59         $28,858,217          $489,122              $470,000                 37             98
C07     226                176          184         $75,685,975          $411,337              $344,750                 30             98
C08     239                242          197         $75,017,043          $380,797              $345,000                 23             99
C09      86                 52           39         $32,619,195          $836,390              $563,000                 38             97
C10     170                154          130         $93,015,115          $715,501              $564,000                 28             99
C11      73                 60           51         $28,194,763          $552,838              $443,500                 31             99
C12     179                 90           62         $74,588,626        $1,203,042              $919,000                 31             96
C13     124                 89           77         $28,604,988          $371,493              $340,000                 34             98
C14     289                275          245        $100,126,178          $408,678              $310,000                 25             98
C15     248                229          170         $68,971,394          $405,714              $362,000                 28             96
TOTAL 2,914              2,417        2,049      $1,062,249,314          $518,423              $379,900                 29             98


                           Central District                                                     Central District
     80                    Days on Market                                 80               Sales Active Listing Ratio

     60                                                                   60


     40                                                                   40


     20                                                                   20


                                                                           0
      0                                                                        Jun   Jul Aug Sep Oct Nov Dec Jan Feb Mar Apr May Jun
          Jun   Jul Aug Sep Oct Nov Dec Jan Feb Mar Apr May Jun

          2008                                            2009                 2008                                           2009


                                                    Year-to-Date: June 2009
Area            Listed      Sales             $ Volume             Avg Price             Med Price         Avg DOM           Avg%List
 C01    2,996               1,737          $616,217,969             $354,760              $314,000              35                98
 C02      724                 392          $267,586,503             $682,619              $520,000              33                98
 C03      506                 282          $209,628,675             $743,364              $490,263              35                98
 C04    1,052                 589          $432,689,070             $734,616              $669,000              35                97
 C06      302                 196           $95,512,171             $487,307              $458,500              35                97
 C07    1,100                 661          $251,083,924             $379,855              $325,000              34                97
 C08    1,163                 754          $260,258,125             $345,170              $303,000              32                98
 C09      311                 174          $164,563,585             $945,768              $665,000              38                97
 C10      874                 543          $335,742,068             $618,310              $470,800              34                97
 C11      378                 220          $119,700,624             $544,094              $500,050              32                97
 C12      506                 216          $258,748,794           $1,197,911              $887,750              38                96
 C13      489                 290          $105,621,281            $364,211               $335,944              32                97
 C14    1,438                 853          $349,888,156            $410,185               $306,500              32                97
 C15    1,010                 572          $218,772,569            $382,470               $340,000              35                96
 TOTAL 12,849               7,479        $3,686,013,514            $492,848               $361,500              34                97


10   TORONTO REAL ESTATE BOARD
SINGLE FAMILY CENTRAL BREAKDOWN - JuNE 2009                      Central District
     Detached Houses                                         Semi-Detached Houses
Area Act Sales Av. Price       Med. Price % S-A Av. % List Area Act Sales Av. Price Med. Price % S-A Av.% List
C01  12      10    $710,600   $602,000 83.3         96    C01   32      18      $571,151   $562,500  56.3          105
C02  38      32   $1,098,719  $843,750 84.2         99    C02   33      27      $757,440   $532,620  81.8          102
C03  73      48   $1,079,238  $655,500 65.8        100    C03   12      17      $590,568   $407,000 141.7           99
C04 178     106     $926,009  $875,000 59.6         98    C04    4      12      $579,875   $561,500 300.0          104
C06  40      43     $574,585  $515,000 107.5        98    C06    1       -             -          -     -            -
C07  92      52     $639,457  $540,000 56.5         98    C07    7       6      $398,583   $397,500  85.7          100
C08   5       3     $552,000  $561,000 60.0        105    C08    6      10      $653,800   $702,500 166.7           97
C09  39      10   $1,711,420 $1,572,500 25.6        98    C09    3       1    $1,750,000 $1,750,000  33.3           99
C10  66      39   $1,258,700   $970,000 59.1        98    C10   13      18     $636,318   $634,000 138.5           102
C11  18      22     $917,230   $895,500 122.2      101    C11    1       5     $522,500   $551,000 500.0           100
C12 138      39   $1,551,508 $1,250,000 28.3        96    C12    1       1     $425,000   $425,000 100.0            98
C13  24      27     $554,548   $556,000 112.5       98    C13   16       3     $376,500   $364,500   18.8           98
C14 132      49     $759,992   $622,000 37.1        97    C14    1       -             -          -     -            -
C15  66      56     $597,661   $560,200 84.9        98    C15   14      16     $384,163   $380,500 114.3            98


     Condo Apartment                                                       Link
Area Act Sales Av. Price       Med. Price % S-A Av. % List Area Act     Sales Av. Price        Med. Price % S-A Av.% List
C01   569   400    $340,895    $307,500 70.3        99    C01       -     -            -               -     -        -
C02    98    35    $586,600    $489,000 35.7        97    C02       -     -            -               -     -        -
C03    31    14    $690,536    $535,250 45.2        97    C03       -     -            -               -     -        -
C04    46    29    $353,517    $325,000 63.0        97    C04       -     -            -               -     -        -
C06    17    15    $254,337    $265,500 88.2        98    C06       -     -            -               -     -        -
C07   100   103    $304,435    $293,500 103.0       98    C07       1     1     $405,000        $405,000 100.0       98
C08   188   165    $345,465    $327,000 87.8       100    C08       -     -            -               -     -        -
C09    27    19    $493,368    $460,000 70.4        97    C09       -     -            -               -     -        -
C10    73    63    $418,282    $348,200 86.3        99    C10       -     -            -               -     -        -
C11    34    18    $180,222    $191,000 52.9        96    C11       -     -            -               -     -        -
C12    23    15    $597,853    $442,000 65.2        97    C12       -     -            -               -     -        -
C13    79    43    $261,551    $243,000 54.4        97    C13       -     1     $365,000        $365,000     -       99
C14   121   173    $299,097    $274,000 143.0       99    C14       -     -            -               -     -        -
C15   124    52    $317,748    $272,500 41.9        92    C15       1     1     $426,800        $426,800 100.0      100


      Condo Townhouse                                           Detached Condo
Area Act Sales     Av. Price   Med. Price % S-A Av. % List Area Act Sales      Av. Price       Med. Price % S-A Av.% List
C01   40    41     $374,271     $329,800   102.5    100   C01   -         -                -           -      -           -
C02    3     4     $842,750     $673,000   133.3     97   C02   -         -                -           -      -           -
C03    -     2     $915,819     $915,819       -     94   C03   -         -                -           -      -           -
C04    3     5     $204,080     $234,000   166.7     81   C04   -         -                -           -      -           -
C06    -     1     $336,000     $336,000       -    102   C06   -         -                -           -      -           -
C07   22    17     $341,024     $310,000    77.3     97   C07   -         -                -           -      -           -
C08   15     9     $500,443     $392,500    60.0     99   C08   -         -                -           -      -           -
C09    2     2     $547,000     $547,000   100.0     99   C09   -         -                -           -      -           -
C10   12     7     $635,457     $748,000    58.3    100   C10   -         -                -           -      -           -
C11   15     3     $196,333     $138,000    20.0     97   C11   -         -                -           -      -           -
C12   17     7     $669,571     $552,000    41.2     98   C12   -         -                -           -      -           -
C13    1     3     $297,000     $250,000   300.0     99   C13   -         -                -           -      -           -
C14   23    14     $427,493     $442,000    60.9     98   C14   -         -                -           -      -           -
C15   43    44     $271,638     $268,400   102.3     98   C15   -         -                -           -      -           -


                                                                               TORONTO REAL ESTATE BOARD             11
SINGLE FAMILY CENTRAL BREAKDOWN - JuNE 2009                  Central District


        Co-op Apartment                                      Attached/Row/Townhouse
Area Act Sales        Av. Price   Med. Price % S-A Av. % List Area Act Sales       Av. Price   Med. Price % S-A Av. % List
C01      -       1    $157,500     $157,500     -     96     C01     14       11   $484,909     $480,000    78.6     99
C02      5       2    $205,000     $205,000 40.0      97     C02     11       13   $813,808     $739,000   118.2     98
C03      8       4    $178,625     $132,250 50.0      97     C03      2        -          -            -       -      -
C04      7       3    $203,467     $181,000 42.9      97     C04      3        1   $430,000     $430,000    33.3     98
C06      -       -           -            -     -      -     C06      -        -          -            -       -      -
C07      -       -           -            -     -      -     C07      4        5   $496,700     $492,500   125.0     97
C08      7       1    $235,000     $235,000 14.3      98     C08     18        9   $564,699     $558,888    50.0    100
C09     15       6    $415,333     $420,000 40.0      97     C09      -        1   $795,000     $795,000       -     99
C10      4       -           -            -     -      -     C10      2        3   $557,375     $535,000   150.0    102
C11      -       -           -            -     -      -     C11      5        3   $523,400     $387,000    60.0     99
C12      -       -           -            -     -      -     C12      -        -          -            -       -      -
C13      2       -           -            -     -      -     C13      2        -          -            -       -      -
C14      1       1    $205,000     $205,000 100.0     95     C14     11        8   $619,113     $540,500    72.7     96
C15      -       -           -            -     -      -     C15      -        1   $454,000     $454,000       -     99


                                                                                                    North District

                                            Current Month: June 2009
 Area        Active      New       Sales       $ Volume        Avg Price           Med Price     Avg DOM      Avg %List
 N01     123              94         89        $40,249,600         $452,243         $457,000           29           98
 N02     212             172        137        $60,267,367         $439,908         $394,000           27           97
 N03     388             328        297       $134,073,861         $451,427         $394,000           35           97
 N04     214             178        149        $72,624,190         $487,411         $477,000           29           98
 N05     188             139        139        $66,862,588         $481,026         $458,000           37           98
 N06     249             134        133        $63,952,375         $480,845         $382,000           49           97
 N07     248             170        186        $66,424,804         $357,123         $326,000           38           98
 N08     498             350        320       $149,831,208         $468,223         $419,250           34           97
 N10     156             142        118        $49,403,100         $418,670         $395,650           29           99
 N11     414             420        386       $180,459,951         $467,513         $429,250           28           99
 N12     125              63         59        $24,914,900         $422,286         $380,000           49           98
 N13     121              34         11         $6,097,900         $554,355         $483,000           55           96
 N14     142              46         32        $26,334,613         $822,957         $640,000           79           95
 N15     106              35         24         $8,462,200         $352,592         $304,500           48           96
 N16     147              51         39        $16,748,699         $429,454         $375,000           68           97
 N17     309             129         92        $26,589,532         $289,017         $255,000           50           96
 N18     146              73         61        $19,575,800         $320,915         $300,000           47           97
 N19     216              80         55        $15,920,926         $289,471         $246,000           63           97
 N20      38              11         10         $4,220,500         $422,050         $356,750           53           98
 N21      44              21         10         $3,503,000         $350,300         $315,750          101           96
 N22     103              40         30         $7,850,500         $261,683         $234,500           74           97
 N23     209              68         53        $14,637,850         $276,186         $260,000           73           97
 N24     120              40         19         $4,821,500         $253,763         $199,000           76           94
 TOTAL 4,516           2,818      2,449     $1,063,826,964         $434,392         $390,000           39           98


12    TORONTO REAL ESTATE BOARD
North District


                           North District                                                    North District
   80                     Days on Market                              80               Sales Active Listing Ratio

   60                                                                 60


   40                                                                 40


   20                                                                 20


    0                                                                  0
        Jun    Jul Aug Sep Oct Nov Dec Jan Feb Mar Apr May Jun             Jun   Jul Aug Sep Oct Nov Dec Jan Feb Mar Apr May Jun

        2008                                            2009               2008                                           2009


                                                   Year-to-Date: June 2009
Area          Listed       Sales            $ Volume             Avg Price            Med Price        Avg DOM         Avg %List
N01             542           320       $145,064,788             $453,327               $425,000               37                  97
N02             866           461       $196,366,385             $425,957               $375,000               36                  97
N03           1,817         1,038       $458,563,625             $441,776               $382,500               38                  97
N04             976           534       $247,043,501             $462,628               $450,100               34                  97
N05             780           412       $190,881,638             $463,305               $431,500               39                  97
N06             808           449       $190,904,313             $425,177               $358,000               45                  97
N07           1,126           689       $236,008,512             $342,538               $320,990               46                  97
N08           2,163         1,158       $514,053,894             $443,915               $402,500               36                  97
N10             678           405       $166,670,259             $411,532               $385,000               34                  98
N11           2,257         1,458       $646,739,422             $443,580               $404,500               37                  97
N12             399           180         $74,071,188            $411,507               $369,250               42                  97
N13             188            48         $28,761,700            $599,202               $500,000               72                  95
N14             270            98         $67,351,112            $687,256               $588,500               76                  95
N15             242           110         $39,076,200            $355,238               $311,000               51                  96
N16             316           142         $55,251,688            $389,096               $342,500               62                  96
N17             822           381       $102,139,882             $268,084               $247,000               47                  97
N18             414           209         $63,167,305            $302,236               $284,500               48                  97
N19             455           241         $65,013,176            $269,764               $244,000               68                  97
N20              65            28         $11,517,763            $411,349               $381,250               63                  97
N21              83            36         $10,771,200            $299,200               $292,750               88                  96
N22             235           114         $30,040,965            $263,517               $241,000               71                  97
N23             419           164         $45,957,330            $280,228               $252,500               70                  96
N24             206            64         $15,173,500            $237,086               $207,500               67                  95
TOTAL         16,127        8,739      $3,600,589,346            $412,014               $373,500               42                  97


                                                                                           TORONTO REAL ESTATE BOARD                13
SINGLE FAMILY NORTH BREAKDOWN - JuNE 2009                 North District


     Detached Houses                                        Semi-Detached Houses
Area Act Sales Av. Price     Med. Price % S-A Av. % List Area Act Sales Av. Price Med. Price % S-A Av. % List
N01    72    47   $581,504    $545,000 65.3       98    N01     -     3    $362,133   $329,900       -     100
N02    96    69   $584,502    $495,000 71.9       97    N02     -     -           -          -       -       -
N03   185   136   $627,946    $581,250 73.5       98    N03    12     7    $423,000   $429,000    58.3      98
N04   154   107   $534,110    $516,000 69.5       98    N04    11    13    $374,673   $385,000   118.2     100
N05   159    94   $543,000    $500,500 59.1       98    N05     8    11    $364,790   $366,000   137.5      99
N06   174    85   $564,533    $455,000 48.9       97    N06    12     7    $318,857   $312,000    58.3      98
N07   165   117   $406,216    $370,000 70.9       97    N07    18    25    $276,711   $288,000   138.9      97
N08   350   179   $551,887    $500,000 51.1       97    N08    36    70    $375,136   $375,000   194.4      98
N10    89    52   $499,779    $473,000 58.4       98    N10     3     9    $359,767   $365,000   300.0      99
N11   218   228   $552,378    $521,000 104.6      99    N11    16    31    $368,006   $369,800   193.8     101
N12   111    45   $465,838    $413,000 40.5       97    N12     1     4    $318,800   $323,600   400.0     100
N13   121    11   $554,355    $483,000   9.1      96    N13     -     -           -          -       -       -
N14   135    30   $859,220    $668,000 22.2       95    N14     -     -           -          -       -       -
N15   101    21   $369,590    $327,500 20.8       96    N15     -     -           -          -       -       -
N16   121    34   $454,491    $434,000 28.1       97    N16     -     1    $315,000   $315,000       -      99
N17   298    84   $297,758    $261,750 28.2       96    N17     2     1    $248,000   $248,000    50.0      99
N18   116    46   $345,137    $328,500 39.7       98    N18     2     4    $250,625   $257,750   200.0      97
N19   147    37   $313,549    $267,500 25.2       97    N19     6     3    $204,667   $200,000    50.0      96
N20    38    10   $422,050    $356,750 26.3       98    N20     -     -           -          -       -       -
N21    44    10   $350,300    $315,750 22.7       96    N21     -     -           -          -       -       -
N22    89    24   $277,875    $246,000 27.0       97    N22     2     -           -          -       -       -
N23   197    49   $283,854    $270,000 24.9       97    N23     -     -           -          -       -       -
N24   111    18   $254,389    $196,000 16.2       94    N24     1     -           -          -       -       -


     Condo Apartment                                                   Link
Area Act Sales Av. Price     Med. Price % S-A Av. % List Area Act   Sales Av. Price   Med. Price % S-A Av. % List
N01 18      17    $246,088    $255,000   94.4     97    N01    3       4   $400,375   $391,000   133.3    99
N02 82      44    $262,120    $251,000   53.7     97    N02    6       7   $331,143   $338,000   116.7    97
N03 127     81    $243,217    $239,000   63.8     97    N03    3       6   $391,933   $387,000   200.0    98
N04 28       2    $188,750    $188,750    7.1     96    N04    1       1   $405,000   $405,000   100.0    96
N05   -      -           -           -      -      -    N05    6       6   $383,150   $376,500   100.0    98
N06 12       5    $284,400    $292,000   41.7     94    N06    1       2   $379,500   $379,500   200.0    99
N07 17       6    $234,000    $249,000   35.3     98    N07    4       1   $348,000   $348,000    25.0    99
N08 69      11    $351,364    $300,000   15.9     94    N08    2       3   $396,567   $380,000   150.0    97
N10 33       4    $227,500    $222,000   12.1     95    N10   20      45   $376,316   $375,000   225.0   100
N11 95      20    $315,384    $291,000   21.1     97    N11   11      17   $367,188   $369,000   154.6   100
N12   3      -           -           -      -      -    N12    1       -          -          -       -     -
N13   -      -           -           -      -      -    N13    -       -          -          -       -     -
N14   5      -           -           -      -      -    N14    -       -          -          -       -     -
N15   -      -           -           -      -      -    N15    -       -          -          -       -     -
N16 15       1    $210,000    $210,000    6.7     95    N16    1       -          -          -       -     -
N17   2      -           -           -      -      -    N17    -       -          -          -       -     -
N18   7      1    $193,000    $193,000   14.3     97    N18   12       7   $264,143   $267,000    58.3    98
N19 15       -           -           -      -      -    N19    8       5   $225,725   $243,626    62.5    97
N20   -      -           -           -      -      -    N20    -       -          -          -       -     -
N21   -      -           -           -      -      -    N21    -       -          -          -       -     -
N22   -      -           -           -      -      -    N22    8       2   $211,500   $211,500    25.0    98
N23   -      -           -           -      -      -    N23    4       -          -          -       -     -
N24   -      -           -           -      -      -    N24    -       -          -          -       -     -


14    TORONTO REAL ESTATE BOARD
SINGLE FAMILY NORTH BREAKDOWN - JuNE 2009               North District


     Condo Townhouse                                       Detached Condo
Area Act Sales Av. Price Med. Price % S-A Av. % List Area Act Sales Av. Price      Med. Price % S-A Av. % List
N01   28   14    $323,107    $283,500    50.0   98    N01   -      -           -           -    -        -
N02   22   10    $313,230    $299,900    45.5   97    N02 1        -           -           -    -        -
N03   28   29    $310,564    $321,000   103.6   98    N03 -        -           -           -    -        -
N04    9    3    $302,000    $338,000    33.3   98    N04 -        -           -           -    -        -
N05    3    1    $315,000    $315,000    33.3   98    N05 -        -           -           -    -        -
N06   24    8    $442,438    $333,500    33.3   97    N06 -        -           -           -    -        -
N07   26    8    $230,125    $224,000    30.8   98    N07 -        -           -           -    -        -
N08   11   12    $305,550    $309,300   109.1   97    N08 -        -           -           -    -        -
N10    3    4    $278,250    $273,000   133.3   98    N10 -        -           -           -    -        -
N11   40   37    $311,692    $320,000    92.5   98    N11 -        1    $530,000    $530,000    -       99
N12    -    2    $191,500    $191,500       -   97    N12 -        -           -           -    -        -
N13    -    -           -           -       -    -    N13 -        -           -           -    -        -
N14    2    -           -           -       -    -    N14 -        -           -           -    -        -
N15    -    -           -           -       -    -    N15 -        -           -           -    -        -
N16    5    2    $265,500    $265,500    40.0   99    N16 -        -           -           -    -        -
N17    2    3    $149,833    $144,000   150.0   97    N17 1        -           -           -    -        -
N18    7    2    $207,500    $207,500    28.6   96    N18 -        -           -           -    -        -
N19    3    2    $190,000    $190,000    66.7   96    N19 26       3    $365,667    $292,000 11.5       96
N20    -    -           -           -       -    -    N20 -        -           -           -    -        -
N21    -    -           -           -       -    -    N21 -        -           -           -    -        -
N22    -    -           -           -       -    -    N22 -        -           -           -    -        -
N23    -    -           -           -       -    -    N23 -        -           -           -    -        -
N24    8    1    $242,500    $242,500    12.5   97    N24 -        -           -           -    -        -


     Co-op Apartment                                     Attached/Row/Townhouse
Area Act Sales Av. Price    Med. Price % S-A Av. % List Area Act Sales Av. Price Med. Price % S-A Av. % List
N01    -    -           -           -       -    -    N01     2    4    $381,000   $358,750   200.0     98
N02    -    -           -           -       -    -    N02    5     7    $421,875   $431,000   140.0    100
N03    -    -           -           -       -    -    N03   33    38    $385,624   $387,000   115.2     96
N04    -    -           -           -       -    -    N04   11    23    $387,617   $375,000   209.1     99
N05    -    -           -           -       -    -    N05   12    27    $340,519   $344,000   225.0     98
N06    -    -           -           -       -    -    N06   26    26    $308,254   $313,250   100.0     98
N07    -    -           -           -       -    -    N07   18    29    $289,199   $291,000   161.1     98
N08    -    -           -           -       -    -    N08   30    45    $356,947   $353,000   150.0     98
N10    -    1    $208,000    $208,000       -   95    N10    8     3    $337,167   $343,000    37.5     99
N11    -    -           -           -       -    -    N11   34    52    $355,714   $339,500   152.9     99
N12    -    -           -           -       -    -    N12    9     8    $286,750   $286,500    88.9     98
N13    -    -           -           -       -    -    N13    -     -           -          -       -      -
N14    -    -           -           -       -    -    N14    -     2    $279,000   $279,000       -     95
N15    -    -           -           -       -    -    N15    5     3    $233,600   $236,000    60.0     97
N16    -    -           -           -       -    -    N16    5     1    $240,000   $240,000    20.0     96
N17    -    -           -           -       -    -    N17    4     4    $220,100   $218,750   100.0     97
N18    -    -           -           -       -    -    N18    2     1    $240,000   $240,000    50.0     97
N19    -    -           -           -       -    -    N19   11     5    $220,000   $226,000    45.5     98
N20    -    -           -           -       -    -    N20    -     -           -          -       -      -
N21    -    -           -           -       -    -    N21    -     -           -          -       -      -
N22    -    -           -           -       -    -    N22    4     4    $189,625   $191,000   100.0     95
N23    -    -           -           -       -    -    N23    8     4    $182,250   $174,000    50.0     96
N24    -    -           -           -       -    -    N24    -     -           -          -       -      -


                                                                       TORONTO REAL ESTATE BOARD         15
District Totals
                                  New          Active           Listed             Sales                  $ Volume           Avg Price           Med Price           Avg DOM Avg Month
        Grand Total            13,357         18,704               N/A            10,955          $4,425,507,843              $403,972            $345,000                      33                   98
        Year                       N/A            N/A           73,584            40,939        $15,708,703,669               $383,710            $329,500                      38                   97


                                                                  Annual Summary - Single Family
               Year                 *Number of Sales                 *Average Price                             Year                *Number of Sales                       *Average Price
              1975                          22,020                     $57,581                                  2008
              1976                          19,025                     $61,389                                  January                         5,075                         $374,449
              1977                          20,512                     $64,559                                  February                        6,015                         $382,048
              1978                          21,184                     $67,333                                  March                           6,631                         $380,338
              1979                          23,466                     $70,830                                  April                           8,762                         $398,687
              1980                          26,017                     $75,694                                  May                             9,411                         $398,148
              1981                          29,625                     $90,203                                  June                            8,600                         $395,866
              1982                          25,336                     $95,496                                  July                            7,806                         $371,427
              1983                          30,046                    $101,626                                  August                          6,318                         $364,886
              1984                          31,905                    $102,318                                  September                       6,424                         $368,549
              1985                          45,509                    $109,094                                  October                         5,155                         $352,974
              1986                          52,919                    $138,925                                  November                        3,640                         $368,582
              1987                          43,475                    $189,105                                  December                        2,577                         $361,415
              1988                          49,381                    $229,635
              1989                          38,960                    $273,698                                  Total**                         74,552                        $379,347
              1990                          26,779                    $255,020
              1991                          38,144                    $234,313                                  2009
              1992                          41,703                    $214,971                                  January                          2,670                        $343,632
              1993                          38,990                    $206,490                                  February                         4,120                        $361,305
              1994                          44,237                    $208,921                                  March                            6,171                        $362,050
              1995                          39,273                    $203,028                                  April                            8,107                        $385,641
              1996                          55,779                    $198,150                                  May                              9,589                        $395,609
              1997                          58,014                    $211,307                                  June                            10,955                        $403,972
              1998                          55,344                    $216,815
              1999                          58,957                    $228,372                                  Year-to-Date**                  40,939                        $383,710
              2000                          58,343                    $243,255
              2001                          67,612                    $251,508
              2002                          74,759                    $275,231
              2003                          78,898                    $293,067
              2004                          83,501                    $315,231
              2005                          84,145                    $335,907
              2006                          83,084                    $351,941
              2007                          93,193                    $376,236
              * Due to District revisions, caution should be exercised when undertaking historical comparisons. Please refer to appropriate maps.
              **This figure may not equal the sum of all monthly totals, as the year-to-date total reflects sales reported in error and deals that have fallen through since January 1st.


                                                           Single Family Dwelling Sales Comparison

                                Sales                                                          Active Listing
15000                                                               35000                                                              400000
                                                                                                                                                                 Average Price
13500
                                                                    30000
12000
10500                                                               25000                                                              337500

9000
                                                                    20000
7500
                                                                                                                                       275000
6000                                                                15000

4500                                                                10000
3000                                                                                                                                   212500
                                                                     5000
 1500
   0                                                                   0                                                               150000
        Jun   Jul Aug Sep Oct Nov Dec Jan Feb Mar Apr May Jun               Jun   Jul Aug Sep Oct Nov Dec Jan Feb Mar Apr May Jun               1999 2000 2001 2002 2003 2004 2005 2006 2007 2008 2009
        2008                                            2009                2008                                            2009


        16      TORONTO REAL ESTATE BOARD

Contenu connexe

Tendances

April Market Watch
April Market WatchApril Market Watch
April Market WatchLarrySage
 
2010-March TREB Market Watch Report
2010-March TREB Market Watch Report2010-March TREB Market Watch Report
2010-March TREB Market Watch ReportSteven Silva
 
Toronto Real Estate Statistics September 2010
Toronto Real Estate Statistics September 2010Toronto Real Estate Statistics September 2010
Toronto Real Estate Statistics September 2010John Helfrich
 
September's Newsletter
September's NewsletterSeptember's Newsletter
September's NewsletterFabio Recine
 
Pasadena Homes March up2date Sales Report
Pasadena Homes March up2date Sales ReportPasadena Homes March up2date Sales Report
Pasadena Homes March up2date Sales ReportDoug Willis
 
Uncw 2012 economic conference final draft
Uncw 2012 economic conference   final draftUncw 2012 economic conference   final draft
Uncw 2012 economic conference final draftintracoastal
 
Annual Report Bdc
Annual Report BdcAnnual Report Bdc
Annual Report Bdcgineva
 
February 2013's Monthly Indicators report - Boston Real Estate Market Trends
February 2013's Monthly Indicators report - Boston Real Estate Market TrendsFebruary 2013's Monthly Indicators report - Boston Real Estate Market Trends
February 2013's Monthly Indicators report - Boston Real Estate Market TrendsUnit Realty Group
 
North Texas MLS Sales Activity May 2012
North Texas MLS Sales Activity May 2012North Texas MLS Sales Activity May 2012
North Texas MLS Sales Activity May 2012Rick Michels
 
Pasadena Homes April09 Sales Report
Pasadena Homes April09 Sales ReportPasadena Homes April09 Sales Report
Pasadena Homes April09 Sales ReportDoug Willis
 
omnicom group Q3 2008 Investor Presentation
omnicom group  Q3 2008 Investor Presentationomnicom group  Q3 2008 Investor Presentation
omnicom group Q3 2008 Investor Presentationfinance22
 

Tendances (13)

Market watch march 2011
Market watch march 2011Market watch march 2011
Market watch march 2011
 
April Market Watch
April Market WatchApril Market Watch
April Market Watch
 
2010-March TREB Market Watch Report
2010-March TREB Market Watch Report2010-March TREB Market Watch Report
2010-March TREB Market Watch Report
 
Market Watch for March 2010
Market Watch for March 2010Market Watch for March 2010
Market Watch for March 2010
 
Toronto Real Estate Statistics September 2010
Toronto Real Estate Statistics September 2010Toronto Real Estate Statistics September 2010
Toronto Real Estate Statistics September 2010
 
September's Newsletter
September's NewsletterSeptember's Newsletter
September's Newsletter
 
Pasadena Homes March up2date Sales Report
Pasadena Homes March up2date Sales ReportPasadena Homes March up2date Sales Report
Pasadena Homes March up2date Sales Report
 
Uncw 2012 economic conference final draft
Uncw 2012 economic conference   final draftUncw 2012 economic conference   final draft
Uncw 2012 economic conference final draft
 
Annual Report Bdc
Annual Report BdcAnnual Report Bdc
Annual Report Bdc
 
February 2013's Monthly Indicators report - Boston Real Estate Market Trends
February 2013's Monthly Indicators report - Boston Real Estate Market TrendsFebruary 2013's Monthly Indicators report - Boston Real Estate Market Trends
February 2013's Monthly Indicators report - Boston Real Estate Market Trends
 
North Texas MLS Sales Activity May 2012
North Texas MLS Sales Activity May 2012North Texas MLS Sales Activity May 2012
North Texas MLS Sales Activity May 2012
 
Pasadena Homes April09 Sales Report
Pasadena Homes April09 Sales ReportPasadena Homes April09 Sales Report
Pasadena Homes April09 Sales Report
 
omnicom group Q3 2008 Investor Presentation
omnicom group  Q3 2008 Investor Presentationomnicom group  Q3 2008 Investor Presentation
omnicom group Q3 2008 Investor Presentation
 

Similaire à MARKET WATCH FOR JUNE 2010

T R E B Market Watch Jan2010
T R E B Market Watch Jan2010T R E B Market Watch Jan2010
T R E B Market Watch Jan2010John Helfrich
 
2010 01 Toronto Mls Market Watch
2010 01  Toronto Mls Market Watch2010 01  Toronto Mls Market Watch
2010 01 Toronto Mls Market WatchSteven Silva
 
Toronto housing stats market watch all neighbourhoods dec. 2010
Toronto housing stats market watch all neighbourhoods dec. 2010Toronto housing stats market watch all neighbourhoods dec. 2010
Toronto housing stats market watch all neighbourhoods dec. 2010James Metcalfe
 
Market watch december 2010
Market watch december 2010Market watch december 2010
Market watch december 2010Jennifer Backus
 
Market Watch December 2010 Toronto Homes Resale Statistics
Market Watch December 2010 Toronto Homes Resale StatisticsMarket Watch December 2010 Toronto Homes Resale Statistics
Market Watch December 2010 Toronto Homes Resale StatisticsJohn Helfrich
 
TREB Market Watch December 2010
TREB Market Watch December 2010TREB Market Watch December 2010
TREB Market Watch December 2010Harish Maraj
 
Toronto real estate statistics june 2011
Toronto real estate statistics june 2011Toronto real estate statistics june 2011
Toronto real estate statistics june 2011John Helfrich
 
Toronto real estate statistics july 2010
Toronto real estate statistics july 2010Toronto real estate statistics july 2010
Toronto real estate statistics july 2010John Helfrich
 
Market Watch July 2010
Market Watch July 2010Market Watch July 2010
Market Watch July 2010Derek Cardona
 
Toronto Real Estate Statistics February 2011
Toronto Real Estate Statistics February 2011Toronto Real Estate Statistics February 2011
Toronto Real Estate Statistics February 2011John Helfrich
 
Toronto real estate statistics may 2011
Toronto real estate statistics may 2011Toronto real estate statistics may 2011
Toronto real estate statistics may 2011John Helfrich
 
Market watch january 2011
Market watch january 2011Market watch january 2011
Market watch january 2011Jennifer Backus
 
Toronto Market Trends
Toronto Market TrendsToronto Market Trends
Toronto Market TrendsLarrySage
 
February 2010 Toronto Mls Market Watch
February 2010 Toronto Mls Market WatchFebruary 2010 Toronto Mls Market Watch
February 2010 Toronto Mls Market WatchSteven Silva
 
Toronto real estate statistics november 2010
Toronto real estate statistics november 2010Toronto real estate statistics november 2010
Toronto real estate statistics november 2010John Helfrich
 
Toronto real estate statistics april 2011
Toronto real estate statistics april 2011Toronto real estate statistics april 2011
Toronto real estate statistics april 2011John Helfrich
 
Toronto real estate statistics march 2011
Toronto real estate statistics march 2011Toronto real estate statistics march 2011
Toronto real estate statistics march 2011John Helfrich
 

Similaire à MARKET WATCH FOR JUNE 2010 (20)

T R E B Market Watch Jan2010
T R E B Market Watch Jan2010T R E B Market Watch Jan2010
T R E B Market Watch Jan2010
 
2010 01 Toronto Mls Market Watch
2010 01  Toronto Mls Market Watch2010 01  Toronto Mls Market Watch
2010 01 Toronto Mls Market Watch
 
Toronto housing stats market watch all neighbourhoods dec. 2010
Toronto housing stats market watch all neighbourhoods dec. 2010Toronto housing stats market watch all neighbourhoods dec. 2010
Toronto housing stats market watch all neighbourhoods dec. 2010
 
Market watch december 2010
Market watch december 2010Market watch december 2010
Market watch december 2010
 
Market Watch December 2010 Toronto Homes Resale Statistics
Market Watch December 2010 Toronto Homes Resale StatisticsMarket Watch December 2010 Toronto Homes Resale Statistics
Market Watch December 2010 Toronto Homes Resale Statistics
 
TREB Market Watch December 2010
TREB Market Watch December 2010TREB Market Watch December 2010
TREB Market Watch December 2010
 
Toronto real estate statistics june 2011
Toronto real estate statistics june 2011Toronto real estate statistics june 2011
Toronto real estate statistics june 2011
 
Toronto real estate statistics july 2010
Toronto real estate statistics july 2010Toronto real estate statistics july 2010
Toronto real estate statistics july 2010
 
Mw1007 pdf
Mw1007 pdfMw1007 pdf
Mw1007 pdf
 
Toronto Real Estate Market Watch July 2010
Toronto Real Estate Market Watch July 2010Toronto Real Estate Market Watch July 2010
Toronto Real Estate Market Watch July 2010
 
Market Watch July 2010
Market Watch July 2010Market Watch July 2010
Market Watch July 2010
 
Toronto Real Estate Statistics February 2011
Toronto Real Estate Statistics February 2011Toronto Real Estate Statistics February 2011
Toronto Real Estate Statistics February 2011
 
TREB
TREBTREB
TREB
 
Toronto real estate statistics may 2011
Toronto real estate statistics may 2011Toronto real estate statistics may 2011
Toronto real estate statistics may 2011
 
Market watch january 2011
Market watch january 2011Market watch january 2011
Market watch january 2011
 
Toronto Market Trends
Toronto Market TrendsToronto Market Trends
Toronto Market Trends
 
February 2010 Toronto Mls Market Watch
February 2010 Toronto Mls Market WatchFebruary 2010 Toronto Mls Market Watch
February 2010 Toronto Mls Market Watch
 
Toronto real estate statistics november 2010
Toronto real estate statistics november 2010Toronto real estate statistics november 2010
Toronto real estate statistics november 2010
 
Toronto real estate statistics april 2011
Toronto real estate statistics april 2011Toronto real estate statistics april 2011
Toronto real estate statistics april 2011
 
Toronto real estate statistics march 2011
Toronto real estate statistics march 2011Toronto real estate statistics march 2011
Toronto real estate statistics march 2011
 

Dernier

Maha Mauka Squarefeet Brochure |Maha Mauka Squarefeet PDF Brochure|
Maha Mauka Squarefeet Brochure |Maha Mauka Squarefeet PDF Brochure|Maha Mauka Squarefeet Brochure |Maha Mauka Squarefeet PDF Brochure|
Maha Mauka Squarefeet Brochure |Maha Mauka Squarefeet PDF Brochure|AkshayJoshi575980
 
Call Girls in Noida Sector 11 Noida 💯Call Us 🔝 9582086666 🔝 South Delhi Escor...
Call Girls in Noida Sector 11 Noida 💯Call Us 🔝 9582086666 🔝 South Delhi Escor...Call Girls in Noida Sector 11 Noida 💯Call Us 🔝 9582086666 🔝 South Delhi Escor...
Call Girls in Noida Sector 11 Noida 💯Call Us 🔝 9582086666 🔝 South Delhi Escor...delhimodel235
 
Girls in Kalyanpuri }Delhi↫8447779280↬Escort Service. In Delhi NCR
Girls in Kalyanpuri }Delhi↫8447779280↬Escort Service. In Delhi NCRGirls in Kalyanpuri }Delhi↫8447779280↬Escort Service. In Delhi NCR
Girls in Kalyanpuri }Delhi↫8447779280↬Escort Service. In Delhi NCRasmaqueen5
 
3D Architectural Rendering Company by Panoram CGI
3D Architectural Rendering Company by Panoram CGI3D Architectural Rendering Company by Panoram CGI
3D Architectural Rendering Company by Panoram CGIPanoram CGI
 
Call Girls in Noida Sector 13 Noida 💯Call Us 🔝 9582086666 🔝 South Delhi Escor...
Call Girls in Noida Sector 13 Noida 💯Call Us 🔝 9582086666 🔝 South Delhi Escor...Call Girls in Noida Sector 13 Noida 💯Call Us 🔝 9582086666 🔝 South Delhi Escor...
Call Girls in Noida Sector 13 Noida 💯Call Us 🔝 9582086666 🔝 South Delhi Escor...delhimodel235
 
9990771857 Call Girls in Dwarka Sector 3 Delhi (Call Girls) Delhi
9990771857 Call Girls in Dwarka Sector 3 Delhi (Call Girls) Delhi9990771857 Call Girls in Dwarka Sector 3 Delhi (Call Girls) Delhi
9990771857 Call Girls in Dwarka Sector 3 Delhi (Call Girls) Delhidelhimodel235
 
9990771857 Call Girls in Dwarka Sector 6 Delhi (Call Girls) Delhi
9990771857 Call Girls in Dwarka Sector 6 Delhi (Call Girls) Delhi9990771857 Call Girls in Dwarka Sector 6 Delhi (Call Girls) Delhi
9990771857 Call Girls in Dwarka Sector 6 Delhi (Call Girls) Delhidelhimodel235
 
Kolte Patil Kharadi Pune E Brochure.pdf
Kolte Patil Kharadi Pune E  Brochure.pdfKolte Patil Kharadi Pune E  Brochure.pdf
Kolte Patil Kharadi Pune E Brochure.pdfabbu831446
 
Call Girls in shastri nagar Delhi 8264348440 ✅ call girls ❤️
Call Girls in shastri nagar Delhi 8264348440 ✅ call girls ❤️Call Girls in shastri nagar Delhi 8264348440 ✅ call girls ❤️
Call Girls in shastri nagar Delhi 8264348440 ✅ call girls ❤️soniya singh
 
call girls in ganesh nagar Delhi 8264348440 ✅ call girls ❤️
call girls in ganesh nagar Delhi 8264348440 ✅ call girls ❤️call girls in ganesh nagar Delhi 8264348440 ✅ call girls ❤️
call girls in ganesh nagar Delhi 8264348440 ✅ call girls ❤️soniya singh
 
Call Girls In Mayur Vihar Delhi ☆↫8447779280 ❤Escorts Service In Delhi
Call Girls In Mayur Vihar Delhi ☆↫8447779280 ❤Escorts Service In DelhiCall Girls In Mayur Vihar Delhi ☆↫8447779280 ❤Escorts Service In Delhi
Call Girls In Mayur Vihar Delhi ☆↫8447779280 ❤Escorts Service In Delhiasmaqueen5
 
Greater Vancouver Realtors Statistics Package April 2024
Greater Vancouver Realtors Statistics Package April 2024Greater Vancouver Realtors Statistics Package April 2024
Greater Vancouver Realtors Statistics Package April 2024VickyAulakh1
 
Shapoorji Pallonji Joyville Vista Pune | Spend Your Family Time Together
Shapoorji Pallonji Joyville Vista Pune | Spend Your Family Time TogetherShapoorji Pallonji Joyville Vista Pune | Spend Your Family Time Together
Shapoorji Pallonji Joyville Vista Pune | Spend Your Family Time Togetheraidasheikh47
 
Mahindra Happinest Tathawade Pune Brochure.pdf
Mahindra Happinest Tathawade Pune Brochure.pdfMahindra Happinest Tathawade Pune Brochure.pdf
Mahindra Happinest Tathawade Pune Brochure.pdfBabyrudram
 
TENANT SCREENING REPORT SERVICES​ How Tenant Screening Reports Work
TENANT SCREENING REPORT SERVICES​ How Tenant Screening Reports WorkTENANT SCREENING REPORT SERVICES​ How Tenant Screening Reports Work
TENANT SCREENING REPORT SERVICES​ How Tenant Screening Reports WorkTurbo Tenant
 
Kohinoor Hinjewadi Phase 2 Pune E-Brochure.pdf
Kohinoor Hinjewadi Phase 2 Pune  E-Brochure.pdfKohinoor Hinjewadi Phase 2 Pune  E-Brochure.pdf
Kohinoor Hinjewadi Phase 2 Pune E-Brochure.pdfManishSaxena95
 
Properties for Sale in Istanbul with Schools and Parks | Antalya Development
Properties for Sale in Istanbul with Schools and Parks | Antalya DevelopmentProperties for Sale in Istanbul with Schools and Parks | Antalya Development
Properties for Sale in Istanbul with Schools and Parks | Antalya DevelopmentAntalya Development
 
Call Girls in Noida Sector 77 Noida 💯Call Us 🔝 9582086666 🔝 South Delhi Escor...
Call Girls in Noida Sector 77 Noida 💯Call Us 🔝 9582086666 🔝 South Delhi Escor...Call Girls in Noida Sector 77 Noida 💯Call Us 🔝 9582086666 🔝 South Delhi Escor...
Call Girls in Noida Sector 77 Noida 💯Call Us 🔝 9582086666 🔝 South Delhi Escor...delhimodel235
 
BDSM⚡Call Girls in Sector 57 Noida Escorts >༒8448380779 Escort Service
BDSM⚡Call Girls in Sector 57 Noida Escorts >༒8448380779 Escort ServiceBDSM⚡Call Girls in Sector 57 Noida Escorts >༒8448380779 Escort Service
BDSM⚡Call Girls in Sector 57 Noida Escorts >༒8448380779 Escort ServiceDelhi Call girls
 
Call Girls In Chand Nagar (Delhi)+918447779280 Welcome To Vip Women Seeking M...
Call Girls In Chand Nagar (Delhi)+918447779280 Welcome To Vip Women Seeking M...Call Girls In Chand Nagar (Delhi)+918447779280 Welcome To Vip Women Seeking M...
Call Girls In Chand Nagar (Delhi)+918447779280 Welcome To Vip Women Seeking M...asmaqueen5
 

Dernier (20)

Maha Mauka Squarefeet Brochure |Maha Mauka Squarefeet PDF Brochure|
Maha Mauka Squarefeet Brochure |Maha Mauka Squarefeet PDF Brochure|Maha Mauka Squarefeet Brochure |Maha Mauka Squarefeet PDF Brochure|
Maha Mauka Squarefeet Brochure |Maha Mauka Squarefeet PDF Brochure|
 
Call Girls in Noida Sector 11 Noida 💯Call Us 🔝 9582086666 🔝 South Delhi Escor...
Call Girls in Noida Sector 11 Noida 💯Call Us 🔝 9582086666 🔝 South Delhi Escor...Call Girls in Noida Sector 11 Noida 💯Call Us 🔝 9582086666 🔝 South Delhi Escor...
Call Girls in Noida Sector 11 Noida 💯Call Us 🔝 9582086666 🔝 South Delhi Escor...
 
Girls in Kalyanpuri }Delhi↫8447779280↬Escort Service. In Delhi NCR
Girls in Kalyanpuri }Delhi↫8447779280↬Escort Service. In Delhi NCRGirls in Kalyanpuri }Delhi↫8447779280↬Escort Service. In Delhi NCR
Girls in Kalyanpuri }Delhi↫8447779280↬Escort Service. In Delhi NCR
 
3D Architectural Rendering Company by Panoram CGI
3D Architectural Rendering Company by Panoram CGI3D Architectural Rendering Company by Panoram CGI
3D Architectural Rendering Company by Panoram CGI
 
Call Girls in Noida Sector 13 Noida 💯Call Us 🔝 9582086666 🔝 South Delhi Escor...
Call Girls in Noida Sector 13 Noida 💯Call Us 🔝 9582086666 🔝 South Delhi Escor...Call Girls in Noida Sector 13 Noida 💯Call Us 🔝 9582086666 🔝 South Delhi Escor...
Call Girls in Noida Sector 13 Noida 💯Call Us 🔝 9582086666 🔝 South Delhi Escor...
 
9990771857 Call Girls in Dwarka Sector 3 Delhi (Call Girls) Delhi
9990771857 Call Girls in Dwarka Sector 3 Delhi (Call Girls) Delhi9990771857 Call Girls in Dwarka Sector 3 Delhi (Call Girls) Delhi
9990771857 Call Girls in Dwarka Sector 3 Delhi (Call Girls) Delhi
 
9990771857 Call Girls in Dwarka Sector 6 Delhi (Call Girls) Delhi
9990771857 Call Girls in Dwarka Sector 6 Delhi (Call Girls) Delhi9990771857 Call Girls in Dwarka Sector 6 Delhi (Call Girls) Delhi
9990771857 Call Girls in Dwarka Sector 6 Delhi (Call Girls) Delhi
 
Kolte Patil Kharadi Pune E Brochure.pdf
Kolte Patil Kharadi Pune E  Brochure.pdfKolte Patil Kharadi Pune E  Brochure.pdf
Kolte Patil Kharadi Pune E Brochure.pdf
 
Call Girls in shastri nagar Delhi 8264348440 ✅ call girls ❤️
Call Girls in shastri nagar Delhi 8264348440 ✅ call girls ❤️Call Girls in shastri nagar Delhi 8264348440 ✅ call girls ❤️
Call Girls in shastri nagar Delhi 8264348440 ✅ call girls ❤️
 
call girls in ganesh nagar Delhi 8264348440 ✅ call girls ❤️
call girls in ganesh nagar Delhi 8264348440 ✅ call girls ❤️call girls in ganesh nagar Delhi 8264348440 ✅ call girls ❤️
call girls in ganesh nagar Delhi 8264348440 ✅ call girls ❤️
 
Call Girls In Mayur Vihar Delhi ☆↫8447779280 ❤Escorts Service In Delhi
Call Girls In Mayur Vihar Delhi ☆↫8447779280 ❤Escorts Service In DelhiCall Girls In Mayur Vihar Delhi ☆↫8447779280 ❤Escorts Service In Delhi
Call Girls In Mayur Vihar Delhi ☆↫8447779280 ❤Escorts Service In Delhi
 
Greater Vancouver Realtors Statistics Package April 2024
Greater Vancouver Realtors Statistics Package April 2024Greater Vancouver Realtors Statistics Package April 2024
Greater Vancouver Realtors Statistics Package April 2024
 
Shapoorji Pallonji Joyville Vista Pune | Spend Your Family Time Together
Shapoorji Pallonji Joyville Vista Pune | Spend Your Family Time TogetherShapoorji Pallonji Joyville Vista Pune | Spend Your Family Time Together
Shapoorji Pallonji Joyville Vista Pune | Spend Your Family Time Together
 
Mahindra Happinest Tathawade Pune Brochure.pdf
Mahindra Happinest Tathawade Pune Brochure.pdfMahindra Happinest Tathawade Pune Brochure.pdf
Mahindra Happinest Tathawade Pune Brochure.pdf
 
TENANT SCREENING REPORT SERVICES​ How Tenant Screening Reports Work
TENANT SCREENING REPORT SERVICES​ How Tenant Screening Reports WorkTENANT SCREENING REPORT SERVICES​ How Tenant Screening Reports Work
TENANT SCREENING REPORT SERVICES​ How Tenant Screening Reports Work
 
Kohinoor Hinjewadi Phase 2 Pune E-Brochure.pdf
Kohinoor Hinjewadi Phase 2 Pune  E-Brochure.pdfKohinoor Hinjewadi Phase 2 Pune  E-Brochure.pdf
Kohinoor Hinjewadi Phase 2 Pune E-Brochure.pdf
 
Properties for Sale in Istanbul with Schools and Parks | Antalya Development
Properties for Sale in Istanbul with Schools and Parks | Antalya DevelopmentProperties for Sale in Istanbul with Schools and Parks | Antalya Development
Properties for Sale in Istanbul with Schools and Parks | Antalya Development
 
Call Girls in Noida Sector 77 Noida 💯Call Us 🔝 9582086666 🔝 South Delhi Escor...
Call Girls in Noida Sector 77 Noida 💯Call Us 🔝 9582086666 🔝 South Delhi Escor...Call Girls in Noida Sector 77 Noida 💯Call Us 🔝 9582086666 🔝 South Delhi Escor...
Call Girls in Noida Sector 77 Noida 💯Call Us 🔝 9582086666 🔝 South Delhi Escor...
 
BDSM⚡Call Girls in Sector 57 Noida Escorts >༒8448380779 Escort Service
BDSM⚡Call Girls in Sector 57 Noida Escorts >༒8448380779 Escort ServiceBDSM⚡Call Girls in Sector 57 Noida Escorts >༒8448380779 Escort Service
BDSM⚡Call Girls in Sector 57 Noida Escorts >༒8448380779 Escort Service
 
Call Girls In Chand Nagar (Delhi)+918447779280 Welcome To Vip Women Seeking M...
Call Girls In Chand Nagar (Delhi)+918447779280 Welcome To Vip Women Seeking M...Call Girls In Chand Nagar (Delhi)+918447779280 Welcome To Vip Women Seeking M...
Call Girls In Chand Nagar (Delhi)+918447779280 Welcome To Vip Women Seeking M...
 

MARKET WATCH FOR JUNE 2010

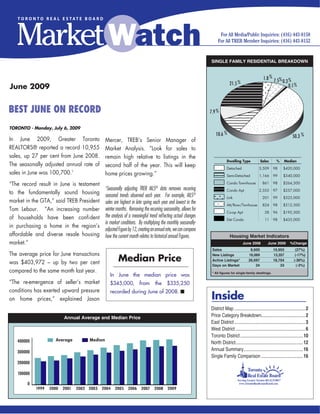
  • 1. SINGLE FAMILY RESIDENTIAL BREAKDOWN 1.8 % 7.5% % 21.5 % 0.3 June 2009 0.1 % BEST JUNE ON RECORD 7.9 % TORONTO - Monday, July 6, 2009 10.6 % 50.3 % In June 2009, Greater Toronto Mercer, TREB’s Senior Manager of REALTORS® reported a record 10,955 Market Analysis. “Look for sales to sales, up 27 per cent from June 2008. remain high relative to listings in the 2.3 % Dwelling Type Sales % Median The seasonally adjusted annual rate of second half of% the year. This7.0 0.3keep % 21.5 will % % 0.1 Single Detached 5,509 98 Detached $420,000 sales in June was 100,700.1 home prices growing.” Semi Detached Semi-Detached 1,166 99 $340,000 “The record result in June is testament Condo T.H. Condo Townhouse 861 98 $264,500 1 Seasonally adjusting TREB MLS® data removes recurring Condo Apt. Condo Apt 2,355 97 $257,000 to the fundamentally sound housing 8.5 % seasonal trends observed each year. For example, MLS® Link Link 201 99 $325,000 market in the GTA,” said TREB President sales are highest in late spring each year and lowest in the Attached/Row Att/Row/Twnhouse 824 98 $312,500 Tom Lebour. “An increasing number winter months. Removing the recurring seasonality, allows for Co-op Apt. 12.0 % Co-op Apt 28 96 $192,500 the analysis of a meaningful trend reflecting actual changes48.3 % of households have been confident Detached Condo Det Condo 11 98 $435,000 in market conditions. By multiplying the monthly seasonally- in purchasing a home in the region’s adjusted figure by 12, creating an annual rate, we can compare affordable and diverse resale housing how the current month relates to historical annual figures. Housing Market Indicators market.” June 2008 June 2009 %Change Sales 8,600 10,955 (27%) The average price for June transactions Median Price New Listings 16,069 13,357 (-17%) Active Listings* 26,697 18,704 (-30%) was $403,972 – up by two per cent Days on Market 34 33 (-3%) compared to the same month last year. * All figures for single-family dwellings. In June the median price was “The re-emergence of seller’s market $345,000, from the $335,250 conditions has exerted upward pressure recorded during June of 2008. n on home prices,” explained Jason Inside District Map ............................................................. 2 Annual Average and Median Price Price Category Breakdown......................................2 East District ............................................................. 3 West District ............................................................ 6 Toronto District ......................................................10 400000 Average Median North District..........................................................12 300000 Annual Summary ...................................................16 Single Family Comparison ....................................16 200000 100000 0 1999 2000 2001 2002 2003 2004 2005 2006 2007 2008 2009
  • 2. District Map Price Category Breakdown - June 2009 Price Range Total S.F.D %S.F.D Condo Apt. %Condo Apt. Condo T.H. %Condo T.H. - - $90,000 40 0.4 26 1.1 5 0.6 $90,001 - $100,000 17 0.2 12 0.5 1 0.1 $100,001 - $110,000 18 0.2 14 0.6 3 0.3 $110,001 - $120,000 28 0.3 22 0.9 2 0.2 $120,001 - $130,000 51 0.5 41 1.7 3 0.3 $130,001 - $140,000 55 0.5 41 1.7 5 0.6 $140,001 - $150,000 82 0.7 56 2.4 13 1.5 $150,001 - $160,000 90 0.8 52 2.2 20 2.3 $160,001 - $170,000 128 1.2 90 3.8 13 1.5 $170,001 - $180,000 149 1.4 87 3.7 16 1.9 $180,001 - $190,000 168 1.5 103 4.4 25 2.9 $190,001 - $200,000 167 1.5 73 3.1 35 4.1 $200,001 - $225,000 530 4.8 237 10.1 95 11.0 $225,001 - $250,000 726 6.6 266 11.3 128 14.9 $250,001 - $300,000 1,770 16.2 500 21.2 242 28.1 $300,001 - $400,000 3,070 28.0 458 19.4 180 20.9 $400,001 - $500,000 1,691 15.4 144 6.1 30 3.5 $500,001 - $750,000 1,524 13.9 98 4.2 30 3.5 $750,001 - $1,000,000 360 3.3 17 0.7 8 0.9 $1,000,001 - $1,500,000 192 1.8 13 0.6 7 0.8 $1,500,001 - - 99 0.9 5 0.2 - - Total: 10,955 100 2,355 100 861 100 2 TORONTO REAL ESTATE BOARD
  • 3. East District Current Month: June 2009 Area Active New Sales $ Volume Avg Price Med Price Avg DOM Avg %List E01 120 162 120 $57,898,431 $482,487 $471,000 18 102 E02 77 122 108 $58,000,436 $537,041 $463,250 18 101 E03 184 197 153 $62,878,793 $410,973 $394,000 23 100 E04 152 144 115 $30,945,211 $269,089 $286,000 24 98 E05 170 149 118 $35,118,902 $297,618 $263,750 28 98 E06 108 104 66 $23,220,619 $351,828 $355,000 20 99 E07 132 157 133 $39,628,568 $297,959 $306,000 24 98 E08 193 150 107 $32,891,750 $307,400 $299,900 29 98 E09 210 153 109 $29,029,701 $266,328 $260,000 30 98 E10 118 91 78 $29,408,940 $377,038 $364,500 28 99 E11 224 170 138 $36,696,211 $265,915 $248,250 37 98 E12 44 42 40 $12,378,100 $309,453 $295,000 33 98 E13 256 179 125 $41,275,926 $330,207 $302,000 34 98 E14 303 215 202 $61,062,568 $302,290 $284,750 37 98 E15 280 239 199 $58,618,340 $294,565 $274,000 33 98 E16 630 366 247 $55,028,874 $222,789 $212,000 37 97 E17 319 221 152 $36,946,180 $243,067 $234,000 34 98 E18 26 11 7 $4,238,000 $605,429 $567,500 59 96 E19 93 61 49 $17,055,110 $348,063 $342,000 38 98 E20 132 50 41 $10,759,400 $262,424 $251,000 45 97 E21 193 84 53 $16,805,200 $317,079 $282,000 65 96 TOTAL 3,964 3,067 2,360 $749,885,260 $317,748 $290,550 31 98 Year-to-Date: June 2009 Area Listed Sales $ Volume Avg Price Med Price Avg DOM Avg %List E01 675 448 $199,416,444 $445,126 $423,500 22 100 E02 608 420 $228,653,535 $544,413 $458,500 22 99 E03 1,031 669 $246,125,859 $367,901 $353,500 28 98 E04 698 447 $115,533,192 $258,464 $275,000 32 97 E05 734 476 $142,283,298 $298,914 $271,000 37 97 E06 507 278 $102,338,052 $368,122 $341,250 30 97 E07 670 478 $133,300,697 $278,872 $269,900 35 97 E08 783 439 $127,071,746 $289,457 $286,500 35 97 E09 780 492 $122,445,923 $248,874 $244,500 37 97 E10 461 269 $95,733,192 $355,885 $350,000 34 97 E11 861 482 $127,478,849 $264,479 $260,000 38 97 E12 206 114 $34,426,700 $301,989 $275,000 33 97 E13 953 495 $158,825,084 $320,859 $291,000 38 97 E14 1,310 756 $224,672,115 $297,185 $282,450 37 98 E15 1,388 838 $240,531,146 $287,030 $270,500 37 98 E16 2,168 1,057 $226,845,834 $214,613 $201,000 40 97 E17 1,254 657 $158,055,068 $240,571 $229,600 43 97 E18 56 13 $6,930,000 $533,077 $543,000 62 95 E19 417 214 $71,605,995 $334,607 $312,250 40 97 E20 343 126 $34,668,550 $275,147 $242,000 53 97 E21 466 189 $56,389,742 $298,358 $278,000 63 96 TOTAL 16,369 9,357 $2,853,331,021 $304,941 $280,000 36 97 TORONTO REAL ESTATE BOARD 3
  • 4. SINGLE FAMILY EAST BREAKDOWN - JuNE 2009 East District East District East District 80 Days on Market 80 Sales Active Listing Ratio 60 60 40 40 20 20 0 0 Jun Jul Aug Sep Oct Nov Dec Jan Feb Mar Apr May Jun Jun Jul Aug Sep Oct Nov Dec Jan Feb Mar Apr May Jun 2008 2009 2008 2009 Detached Houses Semi-Detached Houses Area Act Sales Av. Price Med. Price % S-A Av. % List Area Act Sales Av. Price Med. Price % S-A Av. % List E01 29 24 $545,550 $486,500 82.8 102 E01 39 65 $483,096 $485,600 166.7 104 E02 43 39 $670,944 $640,000 90.7 100 E02 14 42 $488,779 $450,500 300.0 102 E03 89 94 $472,073 $427,658 105.6 100 E03 25 28 $421,996 $406,685 112.0 103 E04 55 63 $325,738 $327,500 114.6 99 E04 8 12 $259,917 $260,000 150.0 97 E05 36 35 $442,014 $436,000 97.2 100 E05 5 5 $352,638 $361,888 100.0 99 E06 89 45 $352,927 $339,900 50.6 99 E06 10 11 $336,373 $300,600 110.0 99 E07 34 54 $396,350 $382,500 158.8 99 E07 9 5 $325,118 $315,000 55.6 100 E08 121 70 $374,884 $341,250 57.9 98 E08 4 2 $254,500 $254,500 50.0 99 E09 64 45 $328,444 $320,000 70.3 98 E09 11 1 $241,500 $241,500 9.1 101 E10 89 60 $405,276 $390,925 67.4 98 E10 - 6 $309,250 $318,750 - 98 E11 77 53 $360,010 $373,000 68.8 98 E11 24 17 $272,100 $268,200 70.8 98 E12 26 29 $338,021 $321,000 111.5 98 E12 3 1 $266,000 $266,000 33.3 101 E13 166 74 $397,868 $372,000 44.6 98 E13 13 3 $271,633 $250,000 23.1 97 E14 189 149 $330,073 $319,000 78.8 98 E14 20 10 $252,990 $246,450 50.0 98 E15 180 135 $326,743 $305,000 75.0 98 E15 9 7 $222,070 $235,000 77.8 98 E16 482 184 $242,394 $227,000 38.2 97 E16 48 30 $172,279 $176,250 62.5 98 E17 230 90 $271,230 $250,000 39.1 98 E17 4 6 $165,083 $184,750 150.0 96 E18 26 7 $605,429 $567,500 26.9 96 E18 - - - - - - E19 80 39 $371,672 $364,000 48.8 98 E19 - - - - - - E20 113 34 $273,350 $271,500 30.1 97 E20 - - - - - - E21 187 53 $317,079 $282,000 28.3 96 E21 4 - - - - - 4 TORONTO REAL ESTATE BOARD
  • 5. SINGLE FAMILY EAST BREAKDOWN - JuNE 2009 East District Condo Apartment Link Area Act Sales Av. Price Med. Price % S-A Av. % List Area Act Sales Av. Price Med. Price % S-A Av. % List E01 31 14 $437,957 $432,000 45.2 98 E01 - - - - - - E02 13 11 $419,673 $382,500 84.6 97 E02 - - - - - - E03 52 27 $206,300 $160,000 51.9 98 E03 - - - - - - E04 63 29 $151,041 $153,000 46.0 96 E04 - - - - - - E05 95 44 $213,993 $214,250 46.3 97 E05 4 3 $347,667 $360,000 75.0 100 E06 3 3 $326,333 $340,000 100.0 98 E06 - - - - - - E07 74 46 $181,837 $181,000 62.2 97 E07 4 11 $330,418 $338,000 275.0 98 E08 48 26 $144,381 $135,250 54.2 96 E08 - - - - - - E09 90 53 $226,175 $225,000 58.9 97 E09 - - - - - - E10 7 2 $140,000 $140,000 28.6 97 E10 - 1 $284,000 $284,000 - 98 E11 54 26 $139,481 $141,500 48.2 97 E11 5 1 $300,000 $300,000 20.0 96 E12 3 3 $164,500 $164,000 100.0 96 E12 1 1 $265,000 $265,000 100.0 98 E13 20 12 $200,575 $181,000 60.0 97 E13 1 4 $285,000 $292,000 400.0 99 E14 14 12 $167,292 $165,000 85.7 96 E14 7 4 $248,250 $243,250 57.1 99 E15 26 6 $199,083 $190,750 23.1 97 E15 10 12 $252,908 $248,500 120.0 99 E16 30 6 $171,333 $166,000 20.0 97 E16 9 7 $202,714 $203,000 77.8 97 E17 13 8 $156,000 $148,500 61.5 96 E17 26 22 $224,350 $224,900 84.6 98 E18 - - - - - - E18 - - - - - - E19 1 - - - - - E19 4 2 $267,000 $267,000 50.0 98 E20 10 4 $176,125 $176,500 40.0 94 E20 4 2 $230,500 $230,500 50.0 98 E21 2 - - - - - E21 - - - - - - Condo Townhouse Detached Condo Area Act Sales Av. Price Med. Price % S-A Av. % List Area Act Sales Av. Price Med. Price % S-A Av. % List E01 4 2 $367,400 $367,400 50.0 101 E01 - - - - - - E02 3 3 $426,633 $405,000 100.0 99 E02 - - - - - - E03 6 1 $224,000 $224,000 16.7 97 E03 - - - - - - E04 20 7 $260,357 $242,000 35.0 98 E04 - - - - - - E05 29 30 $237,384 $240,900 103.5 97 E05 - - - - - - E06 2 - - - - - E06 - - - - - - E07 9 9 $261,289 $247,000 100.0 98 E07 - - - - - - E08 18 2 $182,000 $182,000 11.1 98 E08 - - - - - - E09 40 9 $188,011 $195,000 22.5 99 E09 - - - - - - E10 16 2 $196,000 $196,000 12.5 99 E10 - - - - - - E11 43 21 $204,252 $202,000 48.8 98 E11 - 2 $210,500 $210,500 - 99 E12 4 4 $172,750 $169,500 100.0 97 E12 - - - - - - E13 27 19 $223,394 $225,000 70.4 96 E13 1 1 $229,900 $229,900 100.0 100 E14 36 9 $196,433 $210,900 25.0 97 E14 1 - - - - - E15 29 12 $194,867 $193,700 41.4 98 E15 - - - - - - E16 54 12 $113,208 $112,500 22.2 97 E16 - - - - - - E17 11 1 $264,500 $264,500 9.1 98 E17 - - - - - - E18 - - - - - - E18 - - - - - - E19 - 1 $295,000 $295,000 - 99 E19 - - - - - - E20 5 1 $300,000 $300,000 20.0 97 E20 - - - - - - E21 - - - - - - E21 - - - - - - TORONTO REAL ESTATE BOARD 5
  • 6. SINGLE FAMILY EAST BREAKDOWN - JuNE 2009 East District Co-op Apartment Attached/Row/Townhouse Area Act Sales Av. Price Med. Price % S-A Av. % List Area Act Sales Av. Price Med. Price % S-A Av. % List E01 - - - - - - E01 17 15 $435,853 $455,000 88.2 102 E02 2 2 $272,500 $272,500 100.0 95 E02 2 11 $442,145 $425,000 550.0 100 E03 4 1 $169,900 $169,900 25.0 100 E03 8 2 $362,000 $362,000 25.0 97 E04 2 1 $84,000 $84,000 50.0 84 E04 4 3 $339,333 $339,500 75.0 97 E05 - - - - - - E05 1 1 $305,000 $305,000 100.0 99 E06 - - - - - - E06 4 7 $379,974 $374,900 175.0 99 E07 - 1 $195,000 $195,000 - 98 E07 2 7 $293,486 $295,500 350.0 99 E08 - - - - - - E08 2 7 $289,000 $289,900 350.0 98 E09 - - - - - - E09 5 1 $328,800 $328,800 20.0 97 E10 - - - - - - E10 6 7 $325,843 $335,500 116.7 100 E11 - - - - - - E11 21 18 $241,844 $235,250 85.7 97 E12 - - - - - - E12 7 2 $430,000 $430,000 28.6 96 E13 - - - - - - E13 28 12 $249,792 $244,500 42.9 98 E14 - - - - - - E14 36 18 $254,633 $252,000 50.0 98 E15 - - - - - - E15 26 27 $236,509 $239,000 103.9 98 E16 - - - - - - E16 7 8 $181,813 $188,500 114.3 97 E17 - - - - - - E17 35 25 $203,872 $207,500 71.4 98 E18 - - - - - - E18 - - - - - - E19 - - - - - - E19 8 7 $247,271 $246,000 87.5 99 E20 - - - - - - E20 - - - - - - E21 - - - - - - E21 - - - - - - West District Current Month: June 2009 Area Active New Sales $ Volume Avg Price Med Price Avg DOM Avg %List W01 84 88 79 $40,636,213 $514,382 $465,000 20 101 W02 100 120 110 $50,403,440 $458,213 $425,500 19 101 W03 190 139 83 $24,519,091 $295,411 $291,000 35 97 W04 207 120 83 $28,908,476 $348,295 $335,000 39 97 W05 426 205 128 $35,618,450 $278,269 $291,500 41 97 W06 245 196 160 $58,468,368 $365,427 $355,000 37 98 W07 148 134 82 $39,719,603 $484,385 $440,500 21 99 W08 253 177 172 $102,639,463 $596,741 $475,000 32 97 W09 155 91 57 $19,605,110 $343,949 $350,000 34 98 W10 303 171 114 $28,223,588 $247,575 $275,000 35 96 W12 241 154 119 $60,622,963 $509,437 $410,000 35 97 W13 208 131 118 $60,991,899 $516,881 $416,500 36 97 W14 128 89 62 $21,914,900 $353,466 $328,750 31 97 W15 445 287 222 $54,279,629 $244,503 $219,950 40 97 W16 171 130 115 $44,363,051 $385,766 $347,000 29 98 W17 - - - - - - - - W18 156 69 31 $7,682,000 $247,806 $263,000 28 96 W19 412 338 297 $110,129,089 $370,805 $355,000 28 98 W20 438 428 437 $163,017,567 $373,038 $348,900 29 98 W21 407 237 219 $110,482,988 $504,489 $424,000 37 98 W22 135 141 164 $56,699,644 $345,730 $325,250 29 99 W23 928 721 541 $174,635,077 $322,801 $309,000 33 98 W24 753 501 360 $123,843,561 $344,010 $320,250 37 97 W25 113 62 50 $20,392,125 $407,843 $300,000 47 97 W26 31 11 1 $260,000 $260,000 $260,000 22 98 W27 201 112 124 $45,556,810 $367,394 $349,000 39 97 W28 253 127 109 $47,661,100 $437,258 $410,000 51 97 W29 179 76 60 $18,272,100 $304,535 $278,450 52 97 TOTAL 7,310 5,055 4,097 $1,549,546,305 $378,215 $335,000 34 98 6 TORONTO REAL ESTATE BOARD
  • 7. SINGLE FAMILY WEST BREAKDOWN - JuNE 2009 West District West District West District 80 Days on Market 80 Sales Active Listing Ratio 60 60 40 40 20 20 0 0 Jun Jul Aug Sep Oct Nov Dec Jan Feb Mar Apr May Jun Jun Jul Aug Sep Oct Nov Dec Jan Feb Mar Apr May Jun 2008 2009 2008 2009 Year-to-Date: June 2009 Area Listed Sales $ Volume Avg Price Med Price Avg DOM Avg %List W01 453 318 $141,480,789 $444,908 $384,750 31 99 W02 601 403 $185,169,527 $459,478 $416,000 24 99 W03 656 313 $90,869,229 $290,317 $287,000 40 96 W04 669 314 $97,410,987 $310,226 $305,000 43 96 W05 1,106 448 $123,241,351 $275,092 $290,000 44 96 W06 981 555 $196,804,800 $354,603 $335,000 40 97 W07 553 330 $151,556,753 $459,263 $425,000 33 98 W08 980 548 $305,968,950 $558,338 $450,000 39 96 W09 489 230 $73,221,642 $318,355 $325,500 37 97 W10 900 458 $107,994,665 $235,796 $250,000 43 96 W12 843 443 $219,420,935 $495,307 $405,000 39 96 W13 741 377 $194,222,053 $515,178 $415,000 39 96 W14 496 282 $93,741,135 $332,415 $319,000 37 97 W15 1,683 857 $205,193,246 $239,432 $219,000 41 97 W16 726 402 $146,112,449 $363,464 $341,000 34 97 W17 - - - - - - - W18 398 147 $35,419,302 $240,948 $250,000 39 96 W19 1,864 1,090 $397,437,235 $364,621 $350,000 33 97 W20 2,337 1,432 $522,396,007 $364,802 $342,000 33 97 W21 1,520 787 $406,262,870 $516,217 $430,000 41 97 W22 1,020 742 $248,620,058 $335,067 $317,000 32 98 W23 3,919 2,105 $652,936,469 $310,184 $296,000 35 97 W24 2,866 1,396 $457,766,705 $327,913 $311,950 37 97 W25 339 195 $72,876,513 $373,726 $318,000 52 97 W26 45 15 $10,447,500 $696,500 $570,000 167 96 W27 773 470 $164,654,165 $350,328 $329,250 41 97 W28 768 420 $183,945,401 $437,965 $397,750 51 97 W29 513 287 $83,599,052 $291,286 $266,000 51 97 TOTAL 28,239 15,364 $5,568,769,788 $362,456 $324,000 38 97 TORONTO REAL ESTATE BOARD 7
  • 8. SINGLE FAMILY WEST BREAKDOWN - JuNE 2009 West District Detached Houses Semi-Detached Houses Area Act Sales Av. Price Med. Price % S-A Av. % List Area Act Sales Av. Price Med. Price % S-A Av. % List W01 30 30 $759,783 $715,000 100.0 101 W01 8 11 $537,282 $550,000 137.5 106 W02 32 42 $587,000 $572,290 131.3 101 W02 28 41 $397,779 $395,000 146.4 102 W03 117 41 $307,937 $291,000 35.0 97 W03 41 25 $323,390 $324,900 61.0 98 W04 89 49 $438,526 $390,000 55.1 97 W04 16 7 $330,286 $345,000 43.8 96 W05 82 33 $370,421 $360,000 40.2 98 W05 89 42 $335,602 $315,000 47.2 97 W06 61 69 $396,145 $382,500 113.1 98 W06 4 6 $426,833 $392,750 150.0 97 W07 65 40 $613,748 $599,000 61.5 100 W07 1 - - - - - W08 148 102 $815,519 $717,594 68.9 97 W08 2 2 $374,500 $374,500 100.0 97 W09 42 28 $473,854 $444,055 66.7 100 W09 2 4 $321,250 $316,000 200.0 97 W10 82 49 $328,663 $319,700 59.8 97 W10 8 7 $293,429 $291,000 87.5 97 W12 147 75 $623,028 $535,000 51.0 97 W12 18 6 $381,477 $380,931 33.3 97 W13 140 71 $676,274 $615,000 50.7 96 W13 23 17 $299,353 $298,000 73.9 97 W14 27 23 $527,652 $530,000 85.2 98 W14 5 8 $344,450 $341,000 160.0 97 W15 20 19 $458,763 $417,000 95.0 97 W15 15 10 $362,750 $367,250 66.7 99 W16 79 56 $460,637 $409,000 70.9 98 W16 16 21 $326,295 $333,000 131.3 97 W17 - - - - - - W17 - - - - - - W18 69 10 $284,300 $288,500 14.5 97 W18 31 9 $261,389 $263,000 29.0 94 W19 121 116 $479,152 $462,550 95.9 98 W19 33 58 $352,694 $351,250 175.8 99 W20 196 196 $474,706 $447,000 100.0 98 W20 57 87 $343,229 $346,500 152.6 99 W21 281 137 $611,616 $530,000 48.8 97 W21 6 11 $363,582 $332,000 183.3 98 W22 90 76 $412,819 $395,250 84.4 98 W22 13 26 $315,992 $317,500 200.0 99 W23 605 345 $356,205 $345,000 57.0 97 W23 159 104 $278,140 $281,000 65.4 98 W24 435 205 $413,314 $407,500 47.1 97 W24 103 61 $294,284 $291,001 59.2 97 W25 56 24 $535,884 $418,000 42.9 97 W25 2 1 $241,000 $241,000 50.0 96 W26 31 1 $260,000 $260,000 3.2 98 W26 - - - - - - W27 168 96 $400,795 $382,500 57.1 97 W27 5 8 $270,313 $280,000 160.0 98 W28 235 90 $462,956 $420,050 38.3 97 W28 5 10 $320,720 $322,050 200.0 98 W29 121 41 $348,556 $330,000 33.9 97 W29 13 10 $214,730 $218,150 76.9 98 Condo Apartment Link Area Act Sales Av. Price Med. Price % S-A Av. % List Area Act Sales Av. Price Med. Price % S-A Av. % List W01 36 31 $292,619 $265,000 86.1 99 W01 - - - - - - W02 22 12 $308,269 $280,714 54.6 100 W02 - - - - - - W03 24 10 $199,275 $196,000 41.7 97 W03 - - - - - - W04 57 18 $141,461 $140,000 31.6 96 W04 1 - - - - - W05 124 35 $148,523 $149,000 28.2 95 W05 1 - - - - - W06 150 64 $292,287 $275,000 42.7 98 W06 - - - - - - W07 65 29 $294,855 $288,000 44.6 98 W07 - - - - - - W08 88 60 $263,171 $216,500 68.2 97 W08 - - - - - - W09 91 21 $198,143 $155,000 23.1 96 W09 - - - - - - W10 160 47 $157,039 $147,000 29.4 94 W10 - 2 $288,000 $288,000 - 96 W12 50 19 $245,637 $212,000 38.0 96 W12 - - - - - - W13 17 6 $174,417 $177,500 35.3 95 W13 - - - - - - W14 48 14 $176,414 $174,450 29.2 96 W14 1 - - - - - W15 347 160 $211,364 $208,500 46.1 97 W15 - - - - - - W16 24 10 $348,440 $222,000 41.7 95 W16 2 - - - - - W17 - - - - - - W17 - - - - - - W18 31 1 $120,500 $120,500 3.2 97 W18 - - - - - - W19 133 40 $217,345 $214,250 30.1 97 W19 4 2 $369,750 $369,750 50.0 103 W20 34 33 $191,448 $183,000 97.1 97 W20 2 3 $372,667 $352,000 150.0 99 W21 44 16 $245,563 $235,250 36.4 97 W21 6 6 $303,633 $307,500 100.0 97 W22 3 5 $217,800 $225,000 166.7 97 W22 1 - - - - - W23 26 11 $202,000 $199,000 42.3 97 W23 1 4 $313,725 $323,700 400.0 100 W24 84 31 $172,142 $171,000 36.9 96 W24 4 4 $311,250 $312,750 100.0 98 W25 23 10 $304,550 $183,500 43.5 96 W25 2 - - - - - W26 - - - - - - W26 - - - - - - W27 9 3 $251,167 $262,000 33.3 97 W27 5 1 $225,000 $225,000 20.0 96 W28 - - - - - - W28 1 - - - - - W29 22 1 $262,000 $262,000 4.6 99 W29 - - - - - - 8 TORONTO REAL ESTATE BOARD
  • 9. SINGLE FAMILY WEST BREAKDOWN - JuNE 2009 West District Condo Townhouse Detached Condo Area Act Sales Av. Price Med. Price % S-A Av. % List Area Act Sales Av. Price Med. Price % S-A Av. % List W01 7 2 $343,750 $343,750 28.6 102 W01 - - - - - - W02 3 9 $289,033 $269,900 300.0 101 W02 - - - - - - W03 1 2 $272,100 $272,100 200.0 98 W03 - - - - - - W04 31 5 $268,380 $243,000 16.1 100 W04 - - - - - - W05 114 15 $220,587 $228,000 13.2 96 W05 - - - - - - W06 11 10 $498,750 $418,500 90.9 97 W06 - - - - - - W07 2 4 $493,500 $494,500 200.0 99 W07 - - - - - - W08 9 7 $316,771 $360,000 77.8 98 W08 - - - - - - W09 15 2 $209,900 $209,900 13.3 100 W09 - - - - - - W10 45 6 $190,458 $193,375 13.3 96 W10 - - - - - - W12 20 16 $319,625 $296,000 80.0 97 W12 4 2 $784,000 $784,000 50.0 99 W13 25 19 $253,918 $249,900 76.0 97 W13 - 1 $855,000 $855,000 - 97 W14 44 17 $267,853 $278,000 38.6 97 W14 - - - - - - W15 63 33 $245,982 $248,000 52.4 97 W15 - - - - - - W16 47 27 $293,030 $253,000 57.5 97 W16 - - - - - - W17 - - - - - - W17 - - - - - - W18 22 11 $215,091 $190,000 50.0 96 W18 - - - - - - W19 102 56 $284,516 $287,500 54.9 98 W19 - - - - - - W20 115 86 $260,846 $257,450 74.8 98 W20 2 - - - - - W21 32 15 $265,167 $262,500 46.9 97 W21 1 - - - - - W22 7 5 $249,900 $210,500 71.4 97 W22 - - - - - - W23 80 27 $229,363 $237,000 33.8 97 W23 - - - - - - W24 83 26 $201,115 $194,500 31.3 96 W24 6 1 $435,000 $435,000 16.7 98 W25 17 7 $278,129 $235,000 41.2 99 W25 1 - - - - - W26 - - - - - - W26 - - - - - - W27 5 8 $197,688 $195,000 160.0 98 W27 - - - - - - W28 6 2 $365,500 $365,500 33.3 94 W28 - - - - - - W29 8 2 $158,000 $158,000 25.0 95 W29 - - - - - - Co-op Apartment Attached/Row/Townhouse Area Act Sales Av. Price Med. Price % S-A Av. % List Area Act Sales Av. Price Med. Price % S-A Av. % List W01 - - - - - - W01 3 5 $434,783 $465,101 166.7 105 W02 5 - - - - - W02 10 6 $523,333 $536,000 60.0 100 W03 - - - - - - W03 7 5 $254,400 $247,000 71.4 96 W04 1 - - - - - W04 12 4 $305,125 $305,250 33.3 99 W05 9 1 $51,000 $51,000 11.1 85 W05 7 2 $370,575 $370,575 28.6 98 W06 8 1 $132,000 $132,000 12.5 95 W06 11 10 $474,750 $459,000 90.9 99 W07 3 1 $122,000 $122,000 33.3 94 W07 12 8 $565,363 $538,750 66.7 98 W08 3 - - - - - W08 3 1 $699,900 $699,900 33.3 100 W09 4 1 $181,500 $181,500 25.0 98 W09 1 1 $289,900 $289,900 100.0 100 W10 1 - - - - - W10 7 3 $321,833 $320,000 42.9 98 W12 1 - - - - - W12 1 1 $257,900 $257,900 100.0 98 W13 - - - - - - W13 3 4 $290,375 $306,750 133.3 97 W14 - - - - - - W14 3 - - - - - W15 - - - - - - W15 - - - - - - W16 - - - - - - W16 3 1 $319,000 $319,000 33.3 100 W17 - - - - - - W17 - - - - - - W18 - - - - - - W18 3 - - - - - W19 - - - - - - W19 19 25 $349,000 $348,000 131.6 98 W20 - - - - - - W20 32 32 $320,177 $313,000 100.0 98 W21 - - - - - - W21 37 34 $381,292 $327,000 91.9 98 W22 - - - - - - W22 21 52 $284,060 $290,000 247.6 99 W23 - - - - - - W2 3 57 50 $262,965 $262,250 87.7 98 W24 - - - - - - W24 38 32 $278,672 $274,750 84.2 97 W25 - - - - - - W25 12 8 $287,188 $284,250 66.7 98 W26 - - - - - - W26 - - - - - - W27 - - - - - - W27 9 8 $294,750 $290,750 88.9 98 W28 - - - - - - W28 6 7 $293,843 $280,000 116.7 98 W29 - - - - - - W29 15 6 $209,333 $210,000 40.0 97 TORONTO REAL ESTATE BOARD 9
  • 10. Central District Current Month: June 2009 Area Active New Sales $ Volume Avg Price Med Price Avg DOM Avg%List C01 667 574 481 $174,581,475 $362,955 $316,000 30 99 C02 188 128 113 $90,501,384 $800,897 $605,000 40 99 C03 126 105 85 $74,056,688 $871,255 $620,000 32 99 C04 241 186 156 $117,428,273 $752,745 $664,000 28 98 C06 58 57 59 $28,858,217 $489,122 $470,000 37 98 C07 226 176 184 $75,685,975 $411,337 $344,750 30 98 C08 239 242 197 $75,017,043 $380,797 $345,000 23 99 C09 86 52 39 $32,619,195 $836,390 $563,000 38 97 C10 170 154 130 $93,015,115 $715,501 $564,000 28 99 C11 73 60 51 $28,194,763 $552,838 $443,500 31 99 C12 179 90 62 $74,588,626 $1,203,042 $919,000 31 96 C13 124 89 77 $28,604,988 $371,493 $340,000 34 98 C14 289 275 245 $100,126,178 $408,678 $310,000 25 98 C15 248 229 170 $68,971,394 $405,714 $362,000 28 96 TOTAL 2,914 2,417 2,049 $1,062,249,314 $518,423 $379,900 29 98 Central District Central District 80 Days on Market 80 Sales Active Listing Ratio 60 60 40 40 20 20 0 0 Jun Jul Aug Sep Oct Nov Dec Jan Feb Mar Apr May Jun Jun Jul Aug Sep Oct Nov Dec Jan Feb Mar Apr May Jun 2008 2009 2008 2009 Year-to-Date: June 2009 Area Listed Sales $ Volume Avg Price Med Price Avg DOM Avg%List C01 2,996 1,737 $616,217,969 $354,760 $314,000 35 98 C02 724 392 $267,586,503 $682,619 $520,000 33 98 C03 506 282 $209,628,675 $743,364 $490,263 35 98 C04 1,052 589 $432,689,070 $734,616 $669,000 35 97 C06 302 196 $95,512,171 $487,307 $458,500 35 97 C07 1,100 661 $251,083,924 $379,855 $325,000 34 97 C08 1,163 754 $260,258,125 $345,170 $303,000 32 98 C09 311 174 $164,563,585 $945,768 $665,000 38 97 C10 874 543 $335,742,068 $618,310 $470,800 34 97 C11 378 220 $119,700,624 $544,094 $500,050 32 97 C12 506 216 $258,748,794 $1,197,911 $887,750 38 96 C13 489 290 $105,621,281 $364,211 $335,944 32 97 C14 1,438 853 $349,888,156 $410,185 $306,500 32 97 C15 1,010 572 $218,772,569 $382,470 $340,000 35 96 TOTAL 12,849 7,479 $3,686,013,514 $492,848 $361,500 34 97 10 TORONTO REAL ESTATE BOARD
  • 11. SINGLE FAMILY CENTRAL BREAKDOWN - JuNE 2009 Central District Detached Houses Semi-Detached Houses Area Act Sales Av. Price Med. Price % S-A Av. % List Area Act Sales Av. Price Med. Price % S-A Av.% List C01 12 10 $710,600 $602,000 83.3 96 C01 32 18 $571,151 $562,500 56.3 105 C02 38 32 $1,098,719 $843,750 84.2 99 C02 33 27 $757,440 $532,620 81.8 102 C03 73 48 $1,079,238 $655,500 65.8 100 C03 12 17 $590,568 $407,000 141.7 99 C04 178 106 $926,009 $875,000 59.6 98 C04 4 12 $579,875 $561,500 300.0 104 C06 40 43 $574,585 $515,000 107.5 98 C06 1 - - - - - C07 92 52 $639,457 $540,000 56.5 98 C07 7 6 $398,583 $397,500 85.7 100 C08 5 3 $552,000 $561,000 60.0 105 C08 6 10 $653,800 $702,500 166.7 97 C09 39 10 $1,711,420 $1,572,500 25.6 98 C09 3 1 $1,750,000 $1,750,000 33.3 99 C10 66 39 $1,258,700 $970,000 59.1 98 C10 13 18 $636,318 $634,000 138.5 102 C11 18 22 $917,230 $895,500 122.2 101 C11 1 5 $522,500 $551,000 500.0 100 C12 138 39 $1,551,508 $1,250,000 28.3 96 C12 1 1 $425,000 $425,000 100.0 98 C13 24 27 $554,548 $556,000 112.5 98 C13 16 3 $376,500 $364,500 18.8 98 C14 132 49 $759,992 $622,000 37.1 97 C14 1 - - - - - C15 66 56 $597,661 $560,200 84.9 98 C15 14 16 $384,163 $380,500 114.3 98 Condo Apartment Link Area Act Sales Av. Price Med. Price % S-A Av. % List Area Act Sales Av. Price Med. Price % S-A Av.% List C01 569 400 $340,895 $307,500 70.3 99 C01 - - - - - - C02 98 35 $586,600 $489,000 35.7 97 C02 - - - - - - C03 31 14 $690,536 $535,250 45.2 97 C03 - - - - - - C04 46 29 $353,517 $325,000 63.0 97 C04 - - - - - - C06 17 15 $254,337 $265,500 88.2 98 C06 - - - - - - C07 100 103 $304,435 $293,500 103.0 98 C07 1 1 $405,000 $405,000 100.0 98 C08 188 165 $345,465 $327,000 87.8 100 C08 - - - - - - C09 27 19 $493,368 $460,000 70.4 97 C09 - - - - - - C10 73 63 $418,282 $348,200 86.3 99 C10 - - - - - - C11 34 18 $180,222 $191,000 52.9 96 C11 - - - - - - C12 23 15 $597,853 $442,000 65.2 97 C12 - - - - - - C13 79 43 $261,551 $243,000 54.4 97 C13 - 1 $365,000 $365,000 - 99 C14 121 173 $299,097 $274,000 143.0 99 C14 - - - - - - C15 124 52 $317,748 $272,500 41.9 92 C15 1 1 $426,800 $426,800 100.0 100 Condo Townhouse Detached Condo Area Act Sales Av. Price Med. Price % S-A Av. % List Area Act Sales Av. Price Med. Price % S-A Av.% List C01 40 41 $374,271 $329,800 102.5 100 C01 - - - - - - C02 3 4 $842,750 $673,000 133.3 97 C02 - - - - - - C03 - 2 $915,819 $915,819 - 94 C03 - - - - - - C04 3 5 $204,080 $234,000 166.7 81 C04 - - - - - - C06 - 1 $336,000 $336,000 - 102 C06 - - - - - - C07 22 17 $341,024 $310,000 77.3 97 C07 - - - - - - C08 15 9 $500,443 $392,500 60.0 99 C08 - - - - - - C09 2 2 $547,000 $547,000 100.0 99 C09 - - - - - - C10 12 7 $635,457 $748,000 58.3 100 C10 - - - - - - C11 15 3 $196,333 $138,000 20.0 97 C11 - - - - - - C12 17 7 $669,571 $552,000 41.2 98 C12 - - - - - - C13 1 3 $297,000 $250,000 300.0 99 C13 - - - - - - C14 23 14 $427,493 $442,000 60.9 98 C14 - - - - - - C15 43 44 $271,638 $268,400 102.3 98 C15 - - - - - - TORONTO REAL ESTATE BOARD 11
  • 12. SINGLE FAMILY CENTRAL BREAKDOWN - JuNE 2009 Central District Co-op Apartment Attached/Row/Townhouse Area Act Sales Av. Price Med. Price % S-A Av. % List Area Act Sales Av. Price Med. Price % S-A Av. % List C01 - 1 $157,500 $157,500 - 96 C01 14 11 $484,909 $480,000 78.6 99 C02 5 2 $205,000 $205,000 40.0 97 C02 11 13 $813,808 $739,000 118.2 98 C03 8 4 $178,625 $132,250 50.0 97 C03 2 - - - - - C04 7 3 $203,467 $181,000 42.9 97 C04 3 1 $430,000 $430,000 33.3 98 C06 - - - - - - C06 - - - - - - C07 - - - - - - C07 4 5 $496,700 $492,500 125.0 97 C08 7 1 $235,000 $235,000 14.3 98 C08 18 9 $564,699 $558,888 50.0 100 C09 15 6 $415,333 $420,000 40.0 97 C09 - 1 $795,000 $795,000 - 99 C10 4 - - - - - C10 2 3 $557,375 $535,000 150.0 102 C11 - - - - - - C11 5 3 $523,400 $387,000 60.0 99 C12 - - - - - - C12 - - - - - - C13 2 - - - - - C13 2 - - - - - C14 1 1 $205,000 $205,000 100.0 95 C14 11 8 $619,113 $540,500 72.7 96 C15 - - - - - - C15 - 1 $454,000 $454,000 - 99 North District Current Month: June 2009 Area Active New Sales $ Volume Avg Price Med Price Avg DOM Avg %List N01 123 94 89 $40,249,600 $452,243 $457,000 29 98 N02 212 172 137 $60,267,367 $439,908 $394,000 27 97 N03 388 328 297 $134,073,861 $451,427 $394,000 35 97 N04 214 178 149 $72,624,190 $487,411 $477,000 29 98 N05 188 139 139 $66,862,588 $481,026 $458,000 37 98 N06 249 134 133 $63,952,375 $480,845 $382,000 49 97 N07 248 170 186 $66,424,804 $357,123 $326,000 38 98 N08 498 350 320 $149,831,208 $468,223 $419,250 34 97 N10 156 142 118 $49,403,100 $418,670 $395,650 29 99 N11 414 420 386 $180,459,951 $467,513 $429,250 28 99 N12 125 63 59 $24,914,900 $422,286 $380,000 49 98 N13 121 34 11 $6,097,900 $554,355 $483,000 55 96 N14 142 46 32 $26,334,613 $822,957 $640,000 79 95 N15 106 35 24 $8,462,200 $352,592 $304,500 48 96 N16 147 51 39 $16,748,699 $429,454 $375,000 68 97 N17 309 129 92 $26,589,532 $289,017 $255,000 50 96 N18 146 73 61 $19,575,800 $320,915 $300,000 47 97 N19 216 80 55 $15,920,926 $289,471 $246,000 63 97 N20 38 11 10 $4,220,500 $422,050 $356,750 53 98 N21 44 21 10 $3,503,000 $350,300 $315,750 101 96 N22 103 40 30 $7,850,500 $261,683 $234,500 74 97 N23 209 68 53 $14,637,850 $276,186 $260,000 73 97 N24 120 40 19 $4,821,500 $253,763 $199,000 76 94 TOTAL 4,516 2,818 2,449 $1,063,826,964 $434,392 $390,000 39 98 12 TORONTO REAL ESTATE BOARD
  • 13. North District North District North District 80 Days on Market 80 Sales Active Listing Ratio 60 60 40 40 20 20 0 0 Jun Jul Aug Sep Oct Nov Dec Jan Feb Mar Apr May Jun Jun Jul Aug Sep Oct Nov Dec Jan Feb Mar Apr May Jun 2008 2009 2008 2009 Year-to-Date: June 2009 Area Listed Sales $ Volume Avg Price Med Price Avg DOM Avg %List N01 542 320 $145,064,788 $453,327 $425,000 37 97 N02 866 461 $196,366,385 $425,957 $375,000 36 97 N03 1,817 1,038 $458,563,625 $441,776 $382,500 38 97 N04 976 534 $247,043,501 $462,628 $450,100 34 97 N05 780 412 $190,881,638 $463,305 $431,500 39 97 N06 808 449 $190,904,313 $425,177 $358,000 45 97 N07 1,126 689 $236,008,512 $342,538 $320,990 46 97 N08 2,163 1,158 $514,053,894 $443,915 $402,500 36 97 N10 678 405 $166,670,259 $411,532 $385,000 34 98 N11 2,257 1,458 $646,739,422 $443,580 $404,500 37 97 N12 399 180 $74,071,188 $411,507 $369,250 42 97 N13 188 48 $28,761,700 $599,202 $500,000 72 95 N14 270 98 $67,351,112 $687,256 $588,500 76 95 N15 242 110 $39,076,200 $355,238 $311,000 51 96 N16 316 142 $55,251,688 $389,096 $342,500 62 96 N17 822 381 $102,139,882 $268,084 $247,000 47 97 N18 414 209 $63,167,305 $302,236 $284,500 48 97 N19 455 241 $65,013,176 $269,764 $244,000 68 97 N20 65 28 $11,517,763 $411,349 $381,250 63 97 N21 83 36 $10,771,200 $299,200 $292,750 88 96 N22 235 114 $30,040,965 $263,517 $241,000 71 97 N23 419 164 $45,957,330 $280,228 $252,500 70 96 N24 206 64 $15,173,500 $237,086 $207,500 67 95 TOTAL 16,127 8,739 $3,600,589,346 $412,014 $373,500 42 97 TORONTO REAL ESTATE BOARD 13
  • 14. SINGLE FAMILY NORTH BREAKDOWN - JuNE 2009 North District Detached Houses Semi-Detached Houses Area Act Sales Av. Price Med. Price % S-A Av. % List Area Act Sales Av. Price Med. Price % S-A Av. % List N01 72 47 $581,504 $545,000 65.3 98 N01 - 3 $362,133 $329,900 - 100 N02 96 69 $584,502 $495,000 71.9 97 N02 - - - - - - N03 185 136 $627,946 $581,250 73.5 98 N03 12 7 $423,000 $429,000 58.3 98 N04 154 107 $534,110 $516,000 69.5 98 N04 11 13 $374,673 $385,000 118.2 100 N05 159 94 $543,000 $500,500 59.1 98 N05 8 11 $364,790 $366,000 137.5 99 N06 174 85 $564,533 $455,000 48.9 97 N06 12 7 $318,857 $312,000 58.3 98 N07 165 117 $406,216 $370,000 70.9 97 N07 18 25 $276,711 $288,000 138.9 97 N08 350 179 $551,887 $500,000 51.1 97 N08 36 70 $375,136 $375,000 194.4 98 N10 89 52 $499,779 $473,000 58.4 98 N10 3 9 $359,767 $365,000 300.0 99 N11 218 228 $552,378 $521,000 104.6 99 N11 16 31 $368,006 $369,800 193.8 101 N12 111 45 $465,838 $413,000 40.5 97 N12 1 4 $318,800 $323,600 400.0 100 N13 121 11 $554,355 $483,000 9.1 96 N13 - - - - - - N14 135 30 $859,220 $668,000 22.2 95 N14 - - - - - - N15 101 21 $369,590 $327,500 20.8 96 N15 - - - - - - N16 121 34 $454,491 $434,000 28.1 97 N16 - 1 $315,000 $315,000 - 99 N17 298 84 $297,758 $261,750 28.2 96 N17 2 1 $248,000 $248,000 50.0 99 N18 116 46 $345,137 $328,500 39.7 98 N18 2 4 $250,625 $257,750 200.0 97 N19 147 37 $313,549 $267,500 25.2 97 N19 6 3 $204,667 $200,000 50.0 96 N20 38 10 $422,050 $356,750 26.3 98 N20 - - - - - - N21 44 10 $350,300 $315,750 22.7 96 N21 - - - - - - N22 89 24 $277,875 $246,000 27.0 97 N22 2 - - - - - N23 197 49 $283,854 $270,000 24.9 97 N23 - - - - - - N24 111 18 $254,389 $196,000 16.2 94 N24 1 - - - - - Condo Apartment Link Area Act Sales Av. Price Med. Price % S-A Av. % List Area Act Sales Av. Price Med. Price % S-A Av. % List N01 18 17 $246,088 $255,000 94.4 97 N01 3 4 $400,375 $391,000 133.3 99 N02 82 44 $262,120 $251,000 53.7 97 N02 6 7 $331,143 $338,000 116.7 97 N03 127 81 $243,217 $239,000 63.8 97 N03 3 6 $391,933 $387,000 200.0 98 N04 28 2 $188,750 $188,750 7.1 96 N04 1 1 $405,000 $405,000 100.0 96 N05 - - - - - - N05 6 6 $383,150 $376,500 100.0 98 N06 12 5 $284,400 $292,000 41.7 94 N06 1 2 $379,500 $379,500 200.0 99 N07 17 6 $234,000 $249,000 35.3 98 N07 4 1 $348,000 $348,000 25.0 99 N08 69 11 $351,364 $300,000 15.9 94 N08 2 3 $396,567 $380,000 150.0 97 N10 33 4 $227,500 $222,000 12.1 95 N10 20 45 $376,316 $375,000 225.0 100 N11 95 20 $315,384 $291,000 21.1 97 N11 11 17 $367,188 $369,000 154.6 100 N12 3 - - - - - N12 1 - - - - - N13 - - - - - - N13 - - - - - - N14 5 - - - - - N14 - - - - - - N15 - - - - - - N15 - - - - - - N16 15 1 $210,000 $210,000 6.7 95 N16 1 - - - - - N17 2 - - - - - N17 - - - - - - N18 7 1 $193,000 $193,000 14.3 97 N18 12 7 $264,143 $267,000 58.3 98 N19 15 - - - - - N19 8 5 $225,725 $243,626 62.5 97 N20 - - - - - - N20 - - - - - - N21 - - - - - - N21 - - - - - - N22 - - - - - - N22 8 2 $211,500 $211,500 25.0 98 N23 - - - - - - N23 4 - - - - - N24 - - - - - - N24 - - - - - - 14 TORONTO REAL ESTATE BOARD
  • 15. SINGLE FAMILY NORTH BREAKDOWN - JuNE 2009 North District Condo Townhouse Detached Condo Area Act Sales Av. Price Med. Price % S-A Av. % List Area Act Sales Av. Price Med. Price % S-A Av. % List N01 28 14 $323,107 $283,500 50.0 98 N01 - - - - - - N02 22 10 $313,230 $299,900 45.5 97 N02 1 - - - - - N03 28 29 $310,564 $321,000 103.6 98 N03 - - - - - - N04 9 3 $302,000 $338,000 33.3 98 N04 - - - - - - N05 3 1 $315,000 $315,000 33.3 98 N05 - - - - - - N06 24 8 $442,438 $333,500 33.3 97 N06 - - - - - - N07 26 8 $230,125 $224,000 30.8 98 N07 - - - - - - N08 11 12 $305,550 $309,300 109.1 97 N08 - - - - - - N10 3 4 $278,250 $273,000 133.3 98 N10 - - - - - - N11 40 37 $311,692 $320,000 92.5 98 N11 - 1 $530,000 $530,000 - 99 N12 - 2 $191,500 $191,500 - 97 N12 - - - - - - N13 - - - - - - N13 - - - - - - N14 2 - - - - - N14 - - - - - - N15 - - - - - - N15 - - - - - - N16 5 2 $265,500 $265,500 40.0 99 N16 - - - - - - N17 2 3 $149,833 $144,000 150.0 97 N17 1 - - - - - N18 7 2 $207,500 $207,500 28.6 96 N18 - - - - - - N19 3 2 $190,000 $190,000 66.7 96 N19 26 3 $365,667 $292,000 11.5 96 N20 - - - - - - N20 - - - - - - N21 - - - - - - N21 - - - - - - N22 - - - - - - N22 - - - - - - N23 - - - - - - N23 - - - - - - N24 8 1 $242,500 $242,500 12.5 97 N24 - - - - - - Co-op Apartment Attached/Row/Townhouse Area Act Sales Av. Price Med. Price % S-A Av. % List Area Act Sales Av. Price Med. Price % S-A Av. % List N01 - - - - - - N01 2 4 $381,000 $358,750 200.0 98 N02 - - - - - - N02 5 7 $421,875 $431,000 140.0 100 N03 - - - - - - N03 33 38 $385,624 $387,000 115.2 96 N04 - - - - - - N04 11 23 $387,617 $375,000 209.1 99 N05 - - - - - - N05 12 27 $340,519 $344,000 225.0 98 N06 - - - - - - N06 26 26 $308,254 $313,250 100.0 98 N07 - - - - - - N07 18 29 $289,199 $291,000 161.1 98 N08 - - - - - - N08 30 45 $356,947 $353,000 150.0 98 N10 - 1 $208,000 $208,000 - 95 N10 8 3 $337,167 $343,000 37.5 99 N11 - - - - - - N11 34 52 $355,714 $339,500 152.9 99 N12 - - - - - - N12 9 8 $286,750 $286,500 88.9 98 N13 - - - - - - N13 - - - - - - N14 - - - - - - N14 - 2 $279,000 $279,000 - 95 N15 - - - - - - N15 5 3 $233,600 $236,000 60.0 97 N16 - - - - - - N16 5 1 $240,000 $240,000 20.0 96 N17 - - - - - - N17 4 4 $220,100 $218,750 100.0 97 N18 - - - - - - N18 2 1 $240,000 $240,000 50.0 97 N19 - - - - - - N19 11 5 $220,000 $226,000 45.5 98 N20 - - - - - - N20 - - - - - - N21 - - - - - - N21 - - - - - - N22 - - - - - - N22 4 4 $189,625 $191,000 100.0 95 N23 - - - - - - N23 8 4 $182,250 $174,000 50.0 96 N24 - - - - - - N24 - - - - - - TORONTO REAL ESTATE BOARD 15
  • 16. District Totals New Active Listed Sales $ Volume Avg Price Med Price Avg DOM Avg Month Grand Total 13,357 18,704 N/A 10,955 $4,425,507,843 $403,972 $345,000 33 98 Year N/A N/A 73,584 40,939 $15,708,703,669 $383,710 $329,500 38 97 Annual Summary - Single Family Year *Number of Sales *Average Price Year *Number of Sales *Average Price 1975 22,020 $57,581 2008 1976 19,025 $61,389 January 5,075 $374,449 1977 20,512 $64,559 February 6,015 $382,048 1978 21,184 $67,333 March 6,631 $380,338 1979 23,466 $70,830 April 8,762 $398,687 1980 26,017 $75,694 May 9,411 $398,148 1981 29,625 $90,203 June 8,600 $395,866 1982 25,336 $95,496 July 7,806 $371,427 1983 30,046 $101,626 August 6,318 $364,886 1984 31,905 $102,318 September 6,424 $368,549 1985 45,509 $109,094 October 5,155 $352,974 1986 52,919 $138,925 November 3,640 $368,582 1987 43,475 $189,105 December 2,577 $361,415 1988 49,381 $229,635 1989 38,960 $273,698 Total** 74,552 $379,347 1990 26,779 $255,020 1991 38,144 $234,313 2009 1992 41,703 $214,971 January 2,670 $343,632 1993 38,990 $206,490 February 4,120 $361,305 1994 44,237 $208,921 March 6,171 $362,050 1995 39,273 $203,028 April 8,107 $385,641 1996 55,779 $198,150 May 9,589 $395,609 1997 58,014 $211,307 June 10,955 $403,972 1998 55,344 $216,815 1999 58,957 $228,372 Year-to-Date** 40,939 $383,710 2000 58,343 $243,255 2001 67,612 $251,508 2002 74,759 $275,231 2003 78,898 $293,067 2004 83,501 $315,231 2005 84,145 $335,907 2006 83,084 $351,941 2007 93,193 $376,236 * Due to District revisions, caution should be exercised when undertaking historical comparisons. Please refer to appropriate maps. **This figure may not equal the sum of all monthly totals, as the year-to-date total reflects sales reported in error and deals that have fallen through since January 1st. Single Family Dwelling Sales Comparison Sales Active Listing 15000 35000 400000 Average Price 13500 30000 12000 10500 25000 337500 9000 20000 7500 275000 6000 15000 4500 10000 3000 212500 5000 1500 0 0 150000 Jun Jul Aug Sep Oct Nov Dec Jan Feb Mar Apr May Jun Jun Jul Aug Sep Oct Nov Dec Jan Feb Mar Apr May Jun 1999 2000 2001 2002 2003 2004 2005 2006 2007 2008 2009 2008 2009 2008 2009 16 TORONTO REAL ESTATE BOARD