SlideShare une entreprise Scribd logo
1  sur  9
Télécharger pour lire hors ligne
News Release
FOR IMMEDIATE RELEASE:
Home sales and listings just below 10-year average
VANCOUVER, BC – December 2, 2016 – Home buyer and seller activity remains near
historical averages in the Metro Vancouver* housing market.
Residential home sales in the region totalled 2,214 in November 2016, a decrease of 0.9 per cent
from the 2,233 sales recorded in October 2016 and a decrease of 37.2 per cent compared to
November 2015 when 3,524 homes sold.
Last month’s sales were 7.6 per cent below the 10-year sales average for the month.
“While 2016 has been anything but a normal year for the Metro Vancouver housing market,
supply and demand totals have returned to more historically normal levels over the last few
months,” said Dan Morrison, Real Estate Board of Greater Vancouver (REBGV) president.
New listings for detached, attached and apartment properties in Metro Vancouver totalled 3,147
in November 2016. This represents a decrease of 20.9 per cent compared to the 3,981 units listed
in October 2016 and a 7.2 per cent decrease compared to November 2015 when 3,392 properties
were listed.
Last month’s new listing count was 1.2 per cent below the region’s 10-year new listing average
for the month.
The total number of properties currently listed for sale on the MLS® system in Metro Vancouver
is 8,385, an 8.3 per cent decrease compared to October 2016 (9,143) and a 3.6 per cent increase
compared to November 2015 (8,096).
The sales-to-active listings ratio for November 2016 is 26.4 per cent. This is up two per cent
from last month (24.4 per cent).
Downward pressure on home prices can occur when the ratio dips below the 12 per cent mark for
a sustained period, while home prices can experience upward pressure when it surpasses 20 per
cent over several months.
“Demand, relative to supply, for detached homes is lower right now than demand for townhomes
and apartments,” Morrison said. “This is causing prices to remain stable, or flat, for townhomes
and apartments, while detached homes are seeing modest month-over-month declines.”
The MLS® Home Price Index composite benchmark price for all residential properties in Metro
Vancouver is currently $908,300. This represents a 1.2 per cent decrease compared to last month
and a 20.5 per cent increase compared to November 2015.
Sales of detached properties in November 2016 reached 638, a decrease of 2.1 per cent from the
652 detached sales recorded in October 2016 and a 52.2 per cent decline over November 2015.
The benchmark price for detached properties is $1,511,100. This represents a 2.2 per cent decline
compared to last month and a 23 per cent increase compared to November 2015.
Sales of apartment properties reached 1,200 in November 2016, an increase of 1.9 per cent
compared to the 1,178 sales in October 2016 and a 22.7 per cent decrease compared to
November 2015.The benchmark price of an apartment property is $512,100. This is unchanged
from last month and is an 18 per cent increase compared to November 2015.
Attached property sales in November 2016 totalled 376, a decrease of 6.7 per cent compared to
the 403 sales in October 2016 and a 40.9 per cent decline compared to November 2015. The
benchmark price of an attached unit is $667,100. This represents a 0.3 per cent decrease
compared to last month and a 23 per cent increase compared to November 2015.
*Editor’s Note: Areas covered by Real Estate Board of Greater Vancouver include: Whistler,
Sunshine Coast, Squamish, West Vancouver, North Vancouver, Vancouver, Burnaby, New
Westminster, Richmond, Port Moody, Port Coquitlam, Coquitlam, Pitt Meadows, Maple Ridge
and South Delta.
-30-
The real estate industry is a key economic driver in British Columbia. In 2015, 42,326 homes changed ownership in
the Board’s area, generating $2.7 billion in economic spin-off activity and an estimated 19,000 jobs. The total dollar
value of residential sales transacted through the MLS® system in Greater Vancouver totalled $39 billion in 2015.
The Real Estate Board of Greater Vancouver is an association representing more than 13,000 REALTORS® and
their companies. The Board provides a variety of member services, including the Multiple Listing Service®. For
more information on real estate, statistics, and buying or selling a home, contact a local REALTOR® or visit
www.rebgv.org.
For more information please contact:
Craig Munn
Manager, Communication
Real Estate Board of Greater Vancouver
604.730.3146
cmunn@rebgv.org
Property Type Area
Benchmark
Price
Price
Index
1 Month
Change %
3 Month
Change %
6 Month
Change %
1 Year
Change %
3 Year
Change %
5 Year
Change %
10 Year
Change %
Residential / Composite Lower Mainland $812,400 229.1 -1.0% -2.3% 3.3% 22.8% 49.9% 49.6% 77.6%
Greater Vancouver $908,300 237.7 -1.2% -2.7% 2.1% 20.5% 50.3% 49.7% 85.3%
Bowen Island $814,000 176.5 2.7% 2.0% 12.7% 28.5% 44.0% 39.5% 41.1%
Burnaby East $836,200 230.8 -0.7% -3.8% -1.8% 17.2% 46.5% 52.4% 77.9%
Burnaby North $771,900 232.0 0.3% -1.1% 3.6% 24.0% 49.6% 50.1% 80.5%
Burnaby South $850,200 240.3 -0.6% -2.0% 4.8% 21.5% 49.3% 47.9% 88.2%
Coquitlam $752,500 223.3 -1.8% -3.8% -0.6% 18.8% 50.1% 52.8% 75.0%
Ladner $814,900 226.5 -1.9% -2.2% -1.0% 20.5% 55.7% 52.0% 83.3%
Maple Ridge $573,900 193.9 -0.2% 0.1% 7.4% 30.4% 49.0% 47.6% 54.0%
New Westminster $526,400 224.2 0.0% -1.9% 4.5% 20.0% 43.6% 43.8% 67.2%
North Vancouver $983,500 221.9 -1.2% -4.2% 3.0% 21.7% 50.5% 56.2% 81.7%
Pitt Meadows $562,700 205.8 0.5% 1.3% 10.8% 29.6% 44.5% 48.4% 58.8%
Port Coquitlam $576,500 204.3 -2.4% -4.4% 0.5% 20.9% 43.9% 43.8% 58.0%
Port Moody $764,600 211.4 -0.6% -1.5% 1.9% 19.9% 49.8% 58.1% 66.6%
Richmond $859,000 248.9 -1.9% -2.8% 1.3% 21.6% 50.8% 46.9% 93.5%
Squamish $627,100 204.4 1.5% 0.6% 8.8% 26.3% 62.2% 69.3% 76.2%
Sunshine Coast $491,200 172.1 1.1% 2.9% 9.9% 27.3% 44.1% 36.3% 35.6%
Tsawwassen $957,300 239.8 -2.1% -1.2% -0.8% 23.4% 64.5% 60.6% 92.0%
Vancouver East $965,100 282.7 -2.6% -2.7% 3.6% 21.3% 56.8% 61.5% 114.3%
Vancouver West $1,227,500 258.7 -0.4% -2.0% 1.5% 18.6% 52.4% 50.0% 99.2%
West Vancouver $2,510,300 269.4 -5.4% -9.5% -3.1% 17.5% 55.1% 63.2% 112.3%
Whistler $714,000 165.9 1.5% 0.5% 6.6% 26.4% 55.2% 59.2% 46.2%
Single Family Detached Lower Mainland $1,214,700 258.0 -1.9% -3.9% 0.8% 25.1% 60.1% 60.5% 103.5%
Greater Vancouver $1,511,100 278.7 -2.2% -4.2% -0.2% 23.0% 63.0% 61.1% 121.2%
Bowen Island $814,000 176.5 2.7% 2.0% 12.7% 28.5% 44.0% 39.5% 41.1%
Burnaby East $1,171,700 262.0 -0.8% -7.1% -5.4% 18.1% 56.8% 63.9% 107.0%
Burnaby North $1,520,800 294.1 -1.8% -4.8% -3.3% 22.3% 66.3% 69.5% 133.6%
Burnaby South $1,641,400 314.2 -0.9% -3.5% 2.7% 28.5% 67.5% 70.1% 148.0%
Coquitlam $1,163,300 258.1 -2.8% -5.3% -2.0% 24.0% 64.0% 69.4% 105.3%
Ladner $1,016,700 245.1 -1.8% -1.4% -1.0% 21.7% 66.6% 64.1% 100.2%
Maple Ridge $713,600 203.3 -0.1% 0.1% 6.5% 32.3% 55.1% 57.5% 66.0%
New Westminster $1,026,700 254.7 -1.8% -7.0% -4.9% 18.7% 55.1% 57.6% 101.5%
North Vancouver $1,625,800 258.8 -2.0% -3.8% 1.1% 27.0% 69.7% 74.9% 117.1%
Pitt Meadows $793,900 223.7 0.2% 1.3% 9.0% 32.1% 59.2% 58.1% 76.6%
Port Coquitlam $864,100 230.5 -1.7% -4.8% -4.6% 20.1% 56.7% 58.0% 83.5%
Port Moody $1,375,400 254.0 -0.2% -1.4% 1.7% 25.7% 59.9% 72.2% 102.2%
Richmond $1,610,500 323.0 -3.8% -5.5% -2.0% 27.2% 72.5% 60.8% 151.4%
Squamish $792,100 210.6 2.8% -1.0% 8.6% 26.7% 58.1% 56.6% 77.9%
Sunshine Coast $488,600 171.2 1.0% 2.8% 9.7% 27.4% 44.2% 35.4% 34.9%
Tsawwassen $1,223,200 263.4 -2.4% -1.9% -2.7% 23.1% 73.7% 74.2% 111.7%
Vancouver East $1,473,900 325.8 -2.8% -3.9% 1.2% 21.9% 72.4% 77.5% 155.3%
Vancouver West $3,521,000 361.5 -1.4% -2.7% 2.3% 22.9% 67.9% 58.8% 177.9%
West Vancouver $3,016,600 286.8 -6.0% -10.2% -3.6% 17.7% 55.9% 68.1% 126.9%
Whistler $1,323,400 183.2 0.9% 0.1% 7.9% 23.4% 47.6% 41.7% 58.9%
HOW TO READ THE TABLE:
• Benchmark Price: Estimated sale price of a benchmark property. Benchmarks represent a typical property within each market.
• Price Index: Index numbers estimate the percentage change in price on typical and constant quality properties over time. All figures are based on past sales.
• x Month/Year Change %: Percentage change of index over a period of x month(s)/year(s) *
In January 2005, the indexes are set to 100.
Townhome properties are similar to Attached properties, a category that was used in the previous MLSLink HPI, but do not included duplexes.
The above info is deemed reliable, but is not guaranteed. All dollar amounts in CDN.
November 2016*
* MLS®, Multiple Listing Service®, and all related graphics are trademarks of The Canadian Real Estate Association 1 of 14
Property Type Area
Benchmark
Price
Price
Index
1 Month
Change %
3 Month
Change %
6 Month
Change %
1 Year
Change %
3 Year
Change %
5 Year
Change %
10 Year
Change %
November 2016*
Townhouse Lower Mainland $560,600 202.9 0.0% -0.4% 9.4% 26.2% 44.1% 40.7% 59.3%
Greater Vancouver $667,100 215.6 -0.3% -1.6% 5.5% 23.0% 45.1% 43.4% 69.8%
Burnaby East $530,000 190.1 -0.1% 3.7% 6.5% 21.2% 26.9% 30.3% 49.1%
Burnaby North $536,100 199.9 3.2% 4.3% 10.7% 22.3% 33.6% 27.2% 55.9%
Burnaby South $574,100 206.0 0.9% 2.1% 14.4% 26.4% 41.5% 36.4% 63.9%
Coquitlam $510,400 187.5 0.3% -1.2% -2.4% 13.9% 35.1% 38.1% 48.2%
Ladner $595,800 197.4 -0.4% -6.6% -3.0% 16.4% 33.3% 35.9% 56.9%
Maple Ridge $402,100 195.3 -0.7% -1.6% 10.8% 30.2% 54.9% 43.3% 49.1%
New Westminster $514,000 193.1 -0.6% -6.5% -3.8% 16.4% 31.1% 31.8% 51.7%
North Vancouver $840,600 201.2 -0.2% -6.6% 5.3% 22.4% 45.8% 41.5% 65.7%
Pitt Meadows $477,700 206.7 0.7% -0.3% 14.1% 29.5% 49.6% 49.3% 60.5%
Port Coquitlam $526,300 199.6 -3.9% -4.3% 5.7% 26.7% 39.2% 41.2% 54.5%
Port Moody $519,600 175.6 -0.8% -3.5% -4.0% 5.5% 30.8% 29.1% 36.4%
Richmond $722,500 233.6 1.1% -1.4% 5.4% 23.3% 45.5% 41.8% 84.1%
Squamish $628,000 228.1 0.4% 2.3% 9.1% 30.3% 80.6% 115.8% 100.8%
Tsawwassen $598,200 197.7 -0.3% -6.7% -1.9% 19.3% 37.5% 30.7% 57.2%
Vancouver East $765,500 252.4 -0.7% -2.6% 5.5% 22.2% 45.8% 48.5% 86.7%
Vancouver West $1,089,300 246.4 -3.1% -1.6% 5.2% 25.7% 54.5% 57.3% 95.6%
Whistler $772,700 206.6 0.4% 1.3% 6.3% 26.6% 63.3% 97.3% 88.3%
Apartment Lower Mainland $462,800 202.1 0.1% 0.1% 6.6% 18.6% 37.4% 37.6% 52.3%
Greater Vancouver $512,100 205.9 0.0% -0.4% 5.6% 18.0% 38.5% 38.9% 56.9%
Burnaby East $539,200 204.7 2.5% -3.9% -1.3% 6.3% 34.3% 48.5% 46.5%
Burnaby North $476,100 201.3 1.8% 1.7% 11.1% 26.8% 40.6% 42.4% 54.1%
Burnaby South $527,600 211.8 -0.5% -1.4% 6.3% 17.6% 40.0% 36.7% 64.2%
Coquitlam $343,200 188.9 -0.3% -1.0% 4.9% 14.3% 36.5% 34.3% 43.5%
Ladner $400,500 189.8 -3.2% 0.8% 4.6% 21.4% 40.5% 25.9% 50.5%
Maple Ridge $205,700 148.5 0.1% 2.6% 9.9% 23.8% 12.2% 9.5% 8.7%
New Westminster $380,000 216.4 0.8% 1.2% 10.7% 20.9% 40.1% 39.6% 57.6%
North Vancouver $452,100 184.0 0.1% -3.2% 7.0% 15.1% 28.6% 37.2% 46.7%
Pitt Meadows $307,100 181.5 0.4% 2.6% 10.9% 25.5% 23.1% 35.5% 32.9%
Port Coquitlam $301,600 178.8 -2.1% -2.9% 7.7% 20.8% 33.9% 29.9% 32.9%
Port Moody $472,100 196.7 -1.1% -0.6% 6.6% 23.5% 48.2% 60.8% 55.5%
Richmond $449,700 189.9 -0.4% 2.2% 8.6% 17.4% 29.2% 32.2% 46.3%
Squamish $361,200 173.9 1.0% 1.9% 9.2% 23.1% 64.5% 70.7% 52.8%
Tsawwassen $421,500 177.7 -1.4% 2.4% 7.9% 25.1% 40.6% 24.8% 40.9%
Vancouver East $437,800 241.5 -2.7% -0.5% 8.4% 21.3% 41.1% 46.4% 75.3%
Vancouver West $686,300 222.1 0.9% -0.8% 2.0% 17.1% 45.5% 45.1% 70.3%
West Vancouver $892,500 195.0 -0.8% -1.6% 4.8% 19.0% 53.4% 38.9% 51.5%
Whistler $383,100 125.6 3.9% 2.0% 9.0% 39.4% 83.6% 72.3% 8.6%
HOW TO READ THE TABLE:
• Benchmark Price: Estimated sale price of a benchmark property. Benchmarks represent a typical property within each market.
• Price Index: Index numbers estimate the percentage change in price on typical and constant quality properties over time. All figures are based on past sales.
• x Month/Year Change %: Percentage change of index over a period of x month(s)/year(s)
In January 2005, the indexes are set to 100. *
Townhome properties are similar to attached properties, a category that was used in the previous MLSLink HPI, but do not included duplexes.
Lower Mainland includes areas serviced by both Real Estate Board of Greater Vancouver & Fraser Valley Real Estate Board.
The above info is deemed reliable, but is not guaranteed. All dollar amounts in CDN.
* MLS®, Multiple Listing Service®, and all related graphics are trademarks of The Canadian Real Estate Association 2 of 14
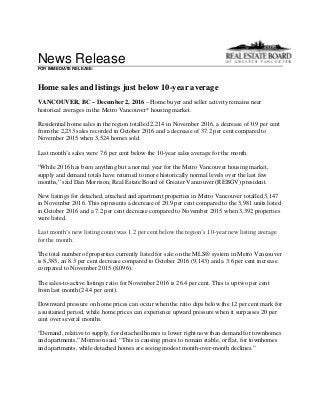
C:DATAMonthEndHpiexporthi_resgv-hpi2.tifGreaterVancouver
5YearTrend
60
110
160
210
260
310
Oct 2011
Dec 2011
Feb 2012
Apr 2012
Jun 2012
Aug 2012
Oct 2012
Dec 2012
Feb 2013
Apr 2013
Jun 2013
Aug 2013
Oct 2013
Dec 2013
Feb 2014
Apr 2014
Jun 2014
Aug 2014
Oct 2014
Dec 2014
Feb 2015
Apr 2015
Jun 2015
Aug 2015
Oct 2015
Dec 2015
Feb 2016
Apr 2016
Jun 2016
Aug 2016
Oct 2016
Price
Index
ResidentialDetachedTownhouseApartment
Jan2005HPI=100
11232016MLS®
SALESFacts
Burnaby
Coquitlam
Delta-South
Islands-Gulf
MapleRidge/PittMeadows
NewWestminster
NorthVancouver
PortCoquitlam
PortMoody/Belcarra
Richmond
Squamish
SunshineCoast
VancouverEast
VancouverWest
WestVancouver/HoweSound
Whistler/Pemberton
Detached4854355831361231065144177682615638
Attached3631100501126228551542744433376
Apartment164891204573865119141121414729613381,200
Detached$1,492,500$1,017,500$1,104,667n/a$719,500n/a$1,500,000$825,750n/a$1,530,000n/a$527,500$1,450,000$3,500,000$2,874,000n/a
Attached$751,000$649,000n/an/a$397,025n/a$863,500$554,850n/a$718,000n/an/a$810,000$1,174,000n/a$735,000n/a
Apartment$450,000$440,200n/an/a$265,000$377,750$507,500$290,000n/a$420,500n/an/a$451,500$663,000n/a$338,500
Detached44592141101461291561114365782215652
Attached52291404263217156814122830242403
Apartment15095160328674463416110510929911501,178
Detached$1,550,000$1,190,000$1,075,000n/a$717,500n/a$1,560,000$843,500n/a$1,563,000n/a$451,825$1,413,775$3,200,000$3,362,500n/a
Attached$660,000$620,000n/an/a$420,500n/a$825,000n/an/a$744,500n/an/a$928,099$1,129,800n/a$651,000n/a
Apartment$432,000$380,000n/an/a$295,000$370,000$500,400$304,950$432,500$433,750n/an/a$468,700$650,000n/a$428,750
Detached116108543145361024120192357414416582181,335
Attached85504077153834321102474768837636
Apartment2251081804010913440221988714045816301,553
Detached$1,405,000$1,044,000$1,032,500n/a$585,100$931,500$1,500,000$719,800$982,500$1,350,000$730,000$386,500$1,310,000$3,100,000$2,720,000n/a
Attached$579,950$590,750n/an/a$315,000n/a$718,700$449,900$514,900$616,600$489,450n/a$800,450$961,900n/a$580,000n/a
Apartment$419,500$321,000n/an/a$230,000$297,000$409,450$266,000$385,000$369,900n/an/a$372,500$585,000n/a$309,000
Detached1,1081,341596691,8493661,1945552871,6012759091,4311,52780320314,114
Attached7325231310733137447320221996191112416687693566,071
Apartment2,4771,40318905981,1301,2276753932,4311791121,6104,94421346318,044
Detached$1,610,000$1,230,000$1,190,191$446,500$720,000$1,091,500$1,639,000$865,000$1,300,000$1,685,000$840,000$489,950$1,526,000$3,500,400$3,200,000$1,385,000
Attached$676,500$675,000$670,000n/a$404,900$550,000$875,000$543,500$595,000$738,000$539,000$304,000$890,000$1,200,000$1,650,000$721,000n/a
Apartment$438,000$379,000$455,000n/a$239,500$358,450$475,000$287,000$443,000$410,250$340,000$285,000$445,000$645,000$818,000$310,000
Detached1,4941,489657481,6943591,4035533142,1873297001,8211,8981,00319016,139
Attached99056510207051534933631991,231229755378411042926,879
Apartment2,2291,10224703541,0281,2364863131,905155771,7365,12619629116,481
Detached$1,250,500$899,950$875,000$375,000$552,285$836,500$1,315,000$670,000$980,500$1,250,000$665,000$410,000$1,215,000$2,820,000$2,432,000$1,107,500
Attached$539,900$524,900$501,250n/a$318,950$460,000$693,900$420,000$452,150$578,000$429,900$270,000$738,000$958,000$1,230,000$566,750n/a
Apartment$395,000$324,900$367,250n/a$214,950$309,000$405,000$248,750$385,000$357,000$265,000$270,000$379,950$532,500$773,000$284,000
Note:MedianSellingPricesarenotreportedforareaswithlessthan20salesorfortheGulfIslands
Median
Selling
Price
Number
of
Sales
Median
Selling
Price
October
2016
November
2015
Jan.-
Nov.2016
Jan.-
Nov.2015
Median
Selling
Price
Number
of
Sales
Median
Selling
Price
Number
of
Sales
November
2016
Number
of
Sales
Median
Selling
Price
Number
of
Sales
November
2016
Year-to-date
Year-to-date
11232016MLS®
LISTINGSFacts
Burnaby
Coquitlam
Delta-South
Islands-Gulf
MapleRidge/PittMeadows
NewWestminster
NorthVancouver
PortCoquitlam
PortMoody/Belcarra
Richmond
Squamish
SunshineCoast
VancouverEast
VancouverWest
WestVancouver/HoweSound
Whistler/Pemberton
Detached9610164311624843121155284721212287171,208
Attached55352214117301822763394857431499
Apartment184951304598103372719428815839316411,440
Detached50%53%55%167%72%54%73%74%48%42%50%87%36%56%30%88%
Attached65%89%45%0%122%65%87%122%36%72%45%44%56%77%100%106%n/a
Apartment89%94%92%n/a100%74%83%138%70%73%43%175%93%75%81%93%
Detached1601236771663415657261913251233163119181,603
Attached605729074144330211182275491543668
Apartment20412221059101112583819922921049517431,710
Detached28%48%31%57%66%41%39%51%58%32%34%84%28%48%18%83%
Attached87%51%48%n/a57%43%74%57%71%58%64%171%52%33%40%98%n/a
Apartment74%78%76%n/a54%85%66%79%89%81%45%56%52%60%65%116%
Detached1011064711222410845211783262153166106191,291
Attached7350404513512719932073763642550
Apartment2071231404386107532925611614441021411,551
Detached115%102%115%300%119%150%94%91%95%108%109%119%94%99%77%95%
Attached116%100%100%n/a171%115%75%126%168%118%120%100%127%108%133%88%n/a
Apartment109%88%129%n/a93%127%125%75%76%77%73%117%97%112%76%73%
Detached2,2972,2711,1111292,5495621,9668964733,3484661,1203,0613,0081,85125625,364
Attached1,07770322758291735714442751,436297122636989993768,259
Apartment2,9441,69425506761,3911,5997584962,9342741112,0466,70430347622,661
Detached48%59%54%53%73%65%61%62%61%48%59%81%47%51%43%79%
Attached68%74%58%0%88%79%78%72%80%69%64%92%65%69%70%95%n/a
Apartment84%83%74%n/a88%81%77%89%79%83%65%101%79%74%70%97%
Detached2,1081,886739992,0464321,7846554332,9983951,0662,5553,0681,93731022,511
Attached1,25369111328412085964542261,5122771206671,1811283618,630
Apartment3,2531,65530106191,5581,7407774193,3051841162,3277,07934141324,087
Detached71%79%89%48%83%83%79%84%73%73%83%66%71%62%52%61%
Attached79%82%90%0%84%74%83%80%88%81%83%63%81%71%81%81%n/a
Apartment69%67%82%n/a57%66%71%63%75%58%84%66%75%72%57%70%
*Year-to-datelistingsrepresentacumulativetotaloflistingsratherthantotalactivelistings.
Number
of
Listings
November
2016
Number
of
Listings
%Salesto
Listings
Number
of
Listings
%Salesto
Listings
Number
of
Listings
%Salesto
Listings
October
2016
November
2015
Jan.-
Nov.2016
Jan.-
Nov.2015
%Salesto
Listings
Number
of
Listings
%Salesto
Listings
November
2016
Year-to-date*
Year-to-date*
Listing & Sales Activity Summary
Listings Sales
1 2 3 Col. 2 & 3 5 6 7 Col. 6 & 7 9 10 Col. 9 & 10
Nov Oct Nov Percentage Nov Oct Nov Percentage Sep 2015 - Sep 2016 - Percentage
2015 2016 2016 Variance 2015 2016 2016 Variance Nov 2015 Nov 2016 Variance
BURNABY % % %
DETACHED 101 160 96 -40.0 116 44 48 9.1 330 150 -54.5
ATTACHED 73 60 55 -8.3 85 52 36 -30.8 256 120 -53.1
APARTMENTS 207 204 184 -9.8 225 150 164 9.3 669 479 -28.4
COQUITLAM
DETACHED 106 123 101 -17.9 108 59 54 -8.5 347 176 -49.3
ATTACHED 50 57 35 -38.6 50 29 31 6.9 152 83 -45.4
APARTMENTS 123 122 95 -22.1 108 95 89 -6.3 326 263 -19.3
DELTA
DETACHED 47 67 64 -4.5 54 21 35 66.7 170 77 -54.7
ATTACHED 4 29 22 -24.1 4 14 10 -28.6 19 43 126.3
APARTMENTS 14 21 13 -38.1 18 16 12 -25.0 72 37 -48.6
MAPLE RIDGE/PITT MEADOWS
DETACHED 122 166 116 -30.1 145 110 83 -24.5 458 285 -37.8
ATTACHED 45 74 41 -44.6 77 42 50 19.0 227 137 -39.6
APARTMENTS 43 59 45 -23.7 40 32 45 40.6 99 121 22.2
NORTH VANCOUVER
DETACHED 108 156 84 -46.2 102 61 61 0.0 339 175 -48.4
ATTACHED 51 43 30 -30.2 38 32 26 -18.8 111 89 -19.8
APARTMENTS 107 112 103 -8.0 134 74 86 16.2 368 257 -30.2
NEW WESTMINSTER
DETACHED 24 34 24 -29.4 36 14 13 -7.1 91 44 -51.6
ATTACHED 13 14 17 21.4 15 6 11 83.3 45 23 -48.9
APARTMENTS 86 101 98 -3.0 109 86 73 -15.1 306 250 -18.3
PORT MOODY/BELCARRA
DETACHED 21 26 21 -19.2 20 15 10 -33.3 81 33 -59.3
ATTACHED 19 21 22 4.8 32 15 8 -46.7 60 43 -28.3
APARTMENTS 29 38 27 -28.9 22 34 19 -44.1 95 84 -11.6
PORT COQUITLAM
DETACHED 45 57 31 -45.6 41 29 23 -20.7 129 79 -38.8
ATTACHED 27 30 18 -40.0 34 17 22 29.4 97 57 -41.2
APARTMENTS 53 58 37 -36.2 40 46 51 10.9 119 150 26.1
RICHMOND
DETACHED 178 191 155 -18.8 192 61 65 6.6 562 205 -63.5
ATTACHED 93 118 76 -35.6 110 68 55 -19.1 326 183 -43.9
APARTMENTS 256 199 194 -2.5 198 161 141 -12.4 553 432 -21.9
SUNSHINE COAST
DETACHED 62 51 47 -7.8 74 43 41 -4.7 212 140 -34.0
ATTACHED 7 7 9 28.6 7 12 4 -66.7 19 26 36.8
APARTMENTS 6 9 8 -11.1 7 5 14 180.0 21 29 38.1
SQUAMISH
DETACHED 32 32 28 -12.5 35 11 14 27.3 95 44 -53.7
ATTACHED 20 22 33 50.0 24 14 15 7.1 67 39 -41.8
APARTMENTS 11 22 28 27.3 8 10 12 20.0 46 35 -23.9
VANCOUVER EAST
DETACHED 153 233 212 -9.0 144 65 77 18.5 437 204 -53.3
ATTACHED 37 54 48 -11.1 47 28 27 -3.6 147 81 -44.9
APARTMENTS 144 210 158 -24.8 140 109 147 34.9 451 368 -18.4
VANCOUVER WEST
DETACHED 166 163 122 -25.2 165 78 68 -12.8 453 206 -54.5
ATTACHED 63 91 57 -37.4 68 30 44 46.7 197 111 -43.7
APARTMENTS 410 495 393 -20.6 458 299 296 -1.0 1348 924 -31.5
WHISTLER/PEMBERTON
DETACHED 19 18 17 -5.6 18 15 15 0.0 63 54 -14.3
ATTACHED 42 43 31 -27.9 37 42 33 -21.4 98 105 7.1
APARTMENTS 41 43 41 -4.7 30 50 38 -24.0 91 128 40.7
WEST VANCOUVER/HOWE SOUND
DETACHED 106 119 87 -26.9 82 22 26 18.2 265 70 -73.6
ATTACHED 6 5 4 -20.0 8 2 4 100.0 25 8 -68.0
APARTMENTS 21 17 16 -5.9 16 11 13 18.2 61 39 -36.1
GRAND TOTALS
DETACHED 1290 1596 1205 -24.5 1332 648 633 -2.3 4032 1942 -51.8
ATTACHED 550 668 498 -25.4 636 403 376 -6.7 1846 1148 -37.8
APARTMENTS 1551 1710 1440 -15.8 1553 1178 1200 1.9 4625 3596 -22.2
ResidentialAverageSalePrices-January1977toNovember2016
0
200
400
600
800
1000
1200
1400
1600
1800
2000
1977197819791980198119821983198419851986198719881989199019911992199319941995199619971998199920002001200220032004200520062007200820092010201120122013201420152016
DETACHEDCONDOMINIUMATTACHEDAPARTMENTS
INTHOUSANDS($)
NOTE:From1977-1984condominiumaverageswerenotseparatedintoattached&apartment.
$763,331
$562,160
$1,612,469

Contenu connexe

En vedette

February 2016 REBGV Stats Mike Stewart Realtor
February 2016 REBGV Stats Mike Stewart RealtorFebruary 2016 REBGV Stats Mike Stewart Realtor
February 2016 REBGV Stats Mike Stewart RealtorMike Stewart
 
October 2015 Vancouver Real Estate Board Statistics Package Mike Stewart Realtor
October 2015 Vancouver Real Estate Board Statistics Package Mike Stewart RealtorOctober 2015 Vancouver Real Estate Board Statistics Package Mike Stewart Realtor
October 2015 Vancouver Real Estate Board Statistics Package Mike Stewart RealtorMike Stewart
 
June 2015 rebgv stats package mike stewart
June 2015 rebgv stats package mike stewartJune 2015 rebgv stats package mike stewart
June 2015 rebgv stats package mike stewartMike Stewart
 
September 2015 rebgv statistics package mike stewart
September 2015 rebgv statistics package mike stewartSeptember 2015 rebgv statistics package mike stewart
September 2015 rebgv statistics package mike stewartMike Stewart
 
January 2016 rebgv stats mike stewart realtor Corrected Feb 5 2016
January 2016 rebgv stats mike stewart realtor Corrected Feb 5 2016January 2016 rebgv stats mike stewart realtor Corrected Feb 5 2016
January 2016 rebgv stats mike stewart realtor Corrected Feb 5 2016Mike Stewart
 
May 2016 Real Estate Board of Greater Vancouver Statistics Package
May 2016 Real Estate Board of Greater Vancouver Statistics PackageMay 2016 Real Estate Board of Greater Vancouver Statistics Package
May 2016 Real Estate Board of Greater Vancouver Statistics PackageMike Stewart
 
REBGV Stats Package June 2016 Mike Stewart Vancouver Realtor
REBGV Stats Package June 2016 Mike Stewart Vancouver RealtorREBGV Stats Package June 2016 Mike Stewart Vancouver Realtor
REBGV Stats Package June 2016 Mike Stewart Vancouver RealtorMike Stewart
 
La población de europa
La población de europaLa población de europa
La población de europaeliseof
 

En vedette (8)

February 2016 REBGV Stats Mike Stewart Realtor
February 2016 REBGV Stats Mike Stewart RealtorFebruary 2016 REBGV Stats Mike Stewart Realtor
February 2016 REBGV Stats Mike Stewart Realtor
 
October 2015 Vancouver Real Estate Board Statistics Package Mike Stewart Realtor
October 2015 Vancouver Real Estate Board Statistics Package Mike Stewart RealtorOctober 2015 Vancouver Real Estate Board Statistics Package Mike Stewart Realtor
October 2015 Vancouver Real Estate Board Statistics Package Mike Stewart Realtor
 
June 2015 rebgv stats package mike stewart
June 2015 rebgv stats package mike stewartJune 2015 rebgv stats package mike stewart
June 2015 rebgv stats package mike stewart
 
September 2015 rebgv statistics package mike stewart
September 2015 rebgv statistics package mike stewartSeptember 2015 rebgv statistics package mike stewart
September 2015 rebgv statistics package mike stewart
 
January 2016 rebgv stats mike stewart realtor Corrected Feb 5 2016
January 2016 rebgv stats mike stewart realtor Corrected Feb 5 2016January 2016 rebgv stats mike stewart realtor Corrected Feb 5 2016
January 2016 rebgv stats mike stewart realtor Corrected Feb 5 2016
 
May 2016 Real Estate Board of Greater Vancouver Statistics Package
May 2016 Real Estate Board of Greater Vancouver Statistics PackageMay 2016 Real Estate Board of Greater Vancouver Statistics Package
May 2016 Real Estate Board of Greater Vancouver Statistics Package
 
REBGV Stats Package June 2016 Mike Stewart Vancouver Realtor
REBGV Stats Package June 2016 Mike Stewart Vancouver RealtorREBGV Stats Package June 2016 Mike Stewart Vancouver Realtor
REBGV Stats Package June 2016 Mike Stewart Vancouver Realtor
 
La población de europa
La población de europaLa población de europa
La población de europa
 

Plus de Mike Stewart

1_FINTRAC_clientinfo_2021.pdf
1_FINTRAC_clientinfo_2021.pdf1_FINTRAC_clientinfo_2021.pdf
1_FINTRAC_clientinfo_2021.pdfMike Stewart
 
Mike Stewart PREC Listing Contract
Mike Stewart PREC Listing ContractMike Stewart PREC Listing Contract
Mike Stewart PREC Listing ContractMike Stewart
 
November 2017 rebgv stats mike stewart real estate agent
November 2017 rebgv stats mike stewart real estate agentNovember 2017 rebgv stats mike stewart real estate agent
November 2017 rebgv stats mike stewart real estate agentMike Stewart
 
October 2017 REBGV Stats Mike Stewart Vancouver Realtor
October 2017 REBGV Stats Mike Stewart Vancouver RealtorOctober 2017 REBGV Stats Mike Stewart Vancouver Realtor
October 2017 REBGV Stats Mike Stewart Vancouver RealtorMike Stewart
 
September 2017 rebgv statistics package mike stewart realtor
September 2017 rebgv statistics package mike stewart realtorSeptember 2017 rebgv statistics package mike stewart realtor
September 2017 rebgv statistics package mike stewart realtorMike Stewart
 
August 2017 REBGV Stats Mike Stewart Realtor
August 2017 REBGV Stats Mike Stewart RealtorAugust 2017 REBGV Stats Mike Stewart Realtor
August 2017 REBGV Stats Mike Stewart RealtorMike Stewart
 
July 2017 Real Estate Board of Greater Vancouver Stats Package Mike Stewart r...
July 2017 Real Estate Board of Greater Vancouver Stats Package Mike Stewart r...July 2017 Real Estate Board of Greater Vancouver Stats Package Mike Stewart r...
July 2017 Real Estate Board of Greater Vancouver Stats Package Mike Stewart r...Mike Stewart
 
June 2017 REBGV Statistics Package
June 2017 REBGV Statistics PackageJune 2017 REBGV Statistics Package
June 2017 REBGV Statistics PackageMike Stewart
 
May 2017 REBGV Stats
May 2017 REBGV Stats May 2017 REBGV Stats
May 2017 REBGV Stats Mike Stewart
 
April 2017 Real Estate Board of Greater Vancouver Statistics Package with Charts
April 2017 Real Estate Board of Greater Vancouver Statistics Package with ChartsApril 2017 Real Estate Board of Greater Vancouver Statistics Package with Charts
April 2017 Real Estate Board of Greater Vancouver Statistics Package with ChartsMike Stewart
 
March 2017 Rebgv Stats Package Mike Stewart
March 2017 Rebgv Stats Package Mike StewartMarch 2017 Rebgv Stats Package Mike Stewart
March 2017 Rebgv Stats Package Mike StewartMike Stewart
 
REBGV Stats for December 2011 Courtesy Mike Stewart Vancouver Realtor
REBGV Stats for December 2011 Courtesy Mike Stewart Vancouver RealtorREBGV Stats for December 2011 Courtesy Mike Stewart Vancouver Realtor
REBGV Stats for December 2011 Courtesy Mike Stewart Vancouver RealtorMike Stewart
 
October 2011 REBGV Stats Mike Stewart
October 2011 REBGV Stats Mike StewartOctober 2011 REBGV Stats Mike Stewart
October 2011 REBGV Stats Mike StewartMike Stewart
 
REBGV Stats for Sept 2011 Mike Stewart
REBGV Stats for Sept 2011 Mike StewartREBGV Stats for Sept 2011 Mike Stewart
REBGV Stats for Sept 2011 Mike StewartMike Stewart
 

Plus de Mike Stewart (14)

1_FINTRAC_clientinfo_2021.pdf
1_FINTRAC_clientinfo_2021.pdf1_FINTRAC_clientinfo_2021.pdf
1_FINTRAC_clientinfo_2021.pdf
 
Mike Stewart PREC Listing Contract
Mike Stewart PREC Listing ContractMike Stewart PREC Listing Contract
Mike Stewart PREC Listing Contract
 
November 2017 rebgv stats mike stewart real estate agent
November 2017 rebgv stats mike stewart real estate agentNovember 2017 rebgv stats mike stewart real estate agent
November 2017 rebgv stats mike stewart real estate agent
 
October 2017 REBGV Stats Mike Stewart Vancouver Realtor
October 2017 REBGV Stats Mike Stewart Vancouver RealtorOctober 2017 REBGV Stats Mike Stewart Vancouver Realtor
October 2017 REBGV Stats Mike Stewart Vancouver Realtor
 
September 2017 rebgv statistics package mike stewart realtor
September 2017 rebgv statistics package mike stewart realtorSeptember 2017 rebgv statistics package mike stewart realtor
September 2017 rebgv statistics package mike stewart realtor
 
August 2017 REBGV Stats Mike Stewart Realtor
August 2017 REBGV Stats Mike Stewart RealtorAugust 2017 REBGV Stats Mike Stewart Realtor
August 2017 REBGV Stats Mike Stewart Realtor
 
July 2017 Real Estate Board of Greater Vancouver Stats Package Mike Stewart r...
July 2017 Real Estate Board of Greater Vancouver Stats Package Mike Stewart r...July 2017 Real Estate Board of Greater Vancouver Stats Package Mike Stewart r...
July 2017 Real Estate Board of Greater Vancouver Stats Package Mike Stewart r...
 
June 2017 REBGV Statistics Package
June 2017 REBGV Statistics PackageJune 2017 REBGV Statistics Package
June 2017 REBGV Statistics Package
 
May 2017 REBGV Stats
May 2017 REBGV Stats May 2017 REBGV Stats
May 2017 REBGV Stats
 
April 2017 Real Estate Board of Greater Vancouver Statistics Package with Charts
April 2017 Real Estate Board of Greater Vancouver Statistics Package with ChartsApril 2017 Real Estate Board of Greater Vancouver Statistics Package with Charts
April 2017 Real Estate Board of Greater Vancouver Statistics Package with Charts
 
March 2017 Rebgv Stats Package Mike Stewart
March 2017 Rebgv Stats Package Mike StewartMarch 2017 Rebgv Stats Package Mike Stewart
March 2017 Rebgv Stats Package Mike Stewart
 
REBGV Stats for December 2011 Courtesy Mike Stewart Vancouver Realtor
REBGV Stats for December 2011 Courtesy Mike Stewart Vancouver RealtorREBGV Stats for December 2011 Courtesy Mike Stewart Vancouver Realtor
REBGV Stats for December 2011 Courtesy Mike Stewart Vancouver Realtor
 
October 2011 REBGV Stats Mike Stewart
October 2011 REBGV Stats Mike StewartOctober 2011 REBGV Stats Mike Stewart
October 2011 REBGV Stats Mike Stewart
 
REBGV Stats for Sept 2011 Mike Stewart
REBGV Stats for Sept 2011 Mike StewartREBGV Stats for Sept 2011 Mike Stewart
REBGV Stats for Sept 2011 Mike Stewart
 

Dernier

Kohinoor Teiko Hinjewadi Phase 2 Pune E-Brochure.pdf
Kohinoor Teiko Hinjewadi Phase 2 Pune  E-Brochure.pdfKohinoor Teiko Hinjewadi Phase 2 Pune  E-Brochure.pdf
Kohinoor Teiko Hinjewadi Phase 2 Pune E-Brochure.pdfManishSaxena95
 
Listing Turkey - 2024 - May Featured Portfolio
Listing Turkey - 2024 - May Featured PortfolioListing Turkey - 2024 - May Featured Portfolio
Listing Turkey - 2024 - May Featured PortfolioListing Turkey
 
Kohinoor Courtyard One Wakad Pune | Elegant Living Spaces
Kohinoor Courtyard One Wakad Pune | Elegant Living SpacesKohinoor Courtyard One Wakad Pune | Elegant Living Spaces
Kohinoor Courtyard One Wakad Pune | Elegant Living Spacesaidasheikh47
 
Real Estate Finance and Investments (2019).pdf
Real Estate Finance and Investments (2019).pdfReal Estate Finance and Investments (2019).pdf
Real Estate Finance and Investments (2019).pdfZahraYusuf9
 
BPTP THE AMAARIO Luxury Project Invest Like Royalty in Sector 37D Gurgaon Dwa...
BPTP THE AMAARIO Luxury Project Invest Like Royalty in Sector 37D Gurgaon Dwa...BPTP THE AMAARIO Luxury Project Invest Like Royalty in Sector 37D Gurgaon Dwa...
BPTP THE AMAARIO Luxury Project Invest Like Royalty in Sector 37D Gurgaon Dwa...ApartmentWala1
 
construction material procurement in India
construction material procurement in Indiaconstruction material procurement in India
construction material procurement in Indiarohanindosup
 
Bridge & Elliot Ladner Floor Plans May 2024.pdf
Bridge & Elliot Ladner Floor Plans May 2024.pdfBridge & Elliot Ladner Floor Plans May 2024.pdf
Bridge & Elliot Ladner Floor Plans May 2024.pdfVickyAulakh1
 
Vanam At Purva Soukhyam Guduvanchery.pdf.pdf
Vanam At Purva Soukhyam Guduvanchery.pdf.pdfVanam At Purva Soukhyam Guduvanchery.pdf.pdf
Vanam At Purva Soukhyam Guduvanchery.pdf.pdfkratirudram
 
Eldeco Dwarka Project In Delhi-brochure.pdf.pdf
Eldeco Dwarka Project In Delhi-brochure.pdf.pdfEldeco Dwarka Project In Delhi-brochure.pdf.pdf
Eldeco Dwarka Project In Delhi-brochure.pdf.pdfkratirudram
 
Low Rate ✨➥9711108085▻✨Call Girls In Majnu Ka Tilla (Mt) (Delhi)
Low Rate ✨➥9711108085▻✨Call Girls In Majnu Ka Tilla (Mt) (Delhi)Low Rate ✨➥9711108085▻✨Call Girls In Majnu Ka Tilla (Mt) (Delhi)
Low Rate ✨➥9711108085▻✨Call Girls In Majnu Ka Tilla (Mt) (Delhi)delhi24hrs1
 
Cheap Rate ✨➥9711108085▻✨Call Girls In Connaught Place (Delhi)
Cheap Rate ✨➥9711108085▻✨Call Girls In Connaught Place (Delhi)Cheap Rate ✨➥9711108085▻✨Call Girls In Connaught Place (Delhi)
Cheap Rate ✨➥9711108085▻✨Call Girls In Connaught Place (Delhi)delhi24hrs1
 
Low Rate ✨➥9711108085▻✨Call Girls In East Of Kailash (E.K) (Delhi)
Low Rate ✨➥9711108085▻✨Call Girls In East Of Kailash (E.K) (Delhi)Low Rate ✨➥9711108085▻✨Call Girls In East Of Kailash (E.K) (Delhi)
Low Rate ✨➥9711108085▻✨Call Girls In East Of Kailash (E.K) (Delhi)delhi24hrs1
 
Jaipur Escorts 🥰 8617370543 Call Girls Offer VIP Hot Girls
Jaipur Escorts 🥰 8617370543 Call Girls Offer VIP Hot GirlsJaipur Escorts 🥰 8617370543 Call Girls Offer VIP Hot Girls
Jaipur Escorts 🥰 8617370543 Call Girls Offer VIP Hot GirlsDeepika Singh
 
Call girls in Shakti Nagar Delhi~8447779280°/=@/ Short 1500 Night 6000}ESCORT...
Call girls in Shakti Nagar Delhi~8447779280°/=@/ Short 1500 Night 6000}ESCORT...Call girls in Shakti Nagar Delhi~8447779280°/=@/ Short 1500 Night 6000}ESCORT...
Call girls in Shakti Nagar Delhi~8447779280°/=@/ Short 1500 Night 6000}ESCORT...asmaqueen5
 
Call girls In Rana Pratap Bagh {Delhi ↫8447779280↬Escort Service (Delhi)
Call girls In Rana Pratap Bagh {Delhi ↫8447779280↬Escort Service (Delhi)Call girls In Rana Pratap Bagh {Delhi ↫8447779280↬Escort Service (Delhi)
Call girls In Rana Pratap Bagh {Delhi ↫8447779280↬Escort Service (Delhi)asmaqueen5
 
BPTP THE AMAARIO For The Royals Of Tomorrow in Sector 37D Gurgaon Dwarka Expr...
BPTP THE AMAARIO For The Royals Of Tomorrow in Sector 37D Gurgaon Dwarka Expr...BPTP THE AMAARIO For The Royals Of Tomorrow in Sector 37D Gurgaon Dwarka Expr...
BPTP THE AMAARIO For The Royals Of Tomorrow in Sector 37D Gurgaon Dwarka Expr...ApartmentWala1
 
Low Density Living New Project in BPTP THE AMAARIO Sector 37D Gurgaon Haryana...
Low Density Living New Project in BPTP THE AMAARIO Sector 37D Gurgaon Haryana...Low Density Living New Project in BPTP THE AMAARIO Sector 37D Gurgaon Haryana...
Low Density Living New Project in BPTP THE AMAARIO Sector 37D Gurgaon Haryana...ApartmentWala1
 
SVN Live 5.6.24 Weekly Property Broadcast
SVN Live 5.6.24 Weekly Property BroadcastSVN Live 5.6.24 Weekly Property Broadcast
SVN Live 5.6.24 Weekly Property BroadcastSVN International Corp.
 
Kalpataru Exquisite Wakad Pune E-Brochure.pdf
Kalpataru Exquisite Wakad Pune  E-Brochure.pdfKalpataru Exquisite Wakad Pune  E-Brochure.pdf
Kalpataru Exquisite Wakad Pune E-Brochure.pdfManishSaxena95
 
Best Interior Design Services in Haldwani
Best Interior Design Services in HaldwaniBest Interior Design Services in Haldwani
Best Interior Design Services in HaldwaniGeomatrix
 

Dernier (20)

Kohinoor Teiko Hinjewadi Phase 2 Pune E-Brochure.pdf
Kohinoor Teiko Hinjewadi Phase 2 Pune  E-Brochure.pdfKohinoor Teiko Hinjewadi Phase 2 Pune  E-Brochure.pdf
Kohinoor Teiko Hinjewadi Phase 2 Pune E-Brochure.pdf
 
Listing Turkey - 2024 - May Featured Portfolio
Listing Turkey - 2024 - May Featured PortfolioListing Turkey - 2024 - May Featured Portfolio
Listing Turkey - 2024 - May Featured Portfolio
 
Kohinoor Courtyard One Wakad Pune | Elegant Living Spaces
Kohinoor Courtyard One Wakad Pune | Elegant Living SpacesKohinoor Courtyard One Wakad Pune | Elegant Living Spaces
Kohinoor Courtyard One Wakad Pune | Elegant Living Spaces
 
Real Estate Finance and Investments (2019).pdf
Real Estate Finance and Investments (2019).pdfReal Estate Finance and Investments (2019).pdf
Real Estate Finance and Investments (2019).pdf
 
BPTP THE AMAARIO Luxury Project Invest Like Royalty in Sector 37D Gurgaon Dwa...
BPTP THE AMAARIO Luxury Project Invest Like Royalty in Sector 37D Gurgaon Dwa...BPTP THE AMAARIO Luxury Project Invest Like Royalty in Sector 37D Gurgaon Dwa...
BPTP THE AMAARIO Luxury Project Invest Like Royalty in Sector 37D Gurgaon Dwa...
 
construction material procurement in India
construction material procurement in Indiaconstruction material procurement in India
construction material procurement in India
 
Bridge & Elliot Ladner Floor Plans May 2024.pdf
Bridge & Elliot Ladner Floor Plans May 2024.pdfBridge & Elliot Ladner Floor Plans May 2024.pdf
Bridge & Elliot Ladner Floor Plans May 2024.pdf
 
Vanam At Purva Soukhyam Guduvanchery.pdf.pdf
Vanam At Purva Soukhyam Guduvanchery.pdf.pdfVanam At Purva Soukhyam Guduvanchery.pdf.pdf
Vanam At Purva Soukhyam Guduvanchery.pdf.pdf
 
Eldeco Dwarka Project In Delhi-brochure.pdf.pdf
Eldeco Dwarka Project In Delhi-brochure.pdf.pdfEldeco Dwarka Project In Delhi-brochure.pdf.pdf
Eldeco Dwarka Project In Delhi-brochure.pdf.pdf
 
Low Rate ✨➥9711108085▻✨Call Girls In Majnu Ka Tilla (Mt) (Delhi)
Low Rate ✨➥9711108085▻✨Call Girls In Majnu Ka Tilla (Mt) (Delhi)Low Rate ✨➥9711108085▻✨Call Girls In Majnu Ka Tilla (Mt) (Delhi)
Low Rate ✨➥9711108085▻✨Call Girls In Majnu Ka Tilla (Mt) (Delhi)
 
Cheap Rate ✨➥9711108085▻✨Call Girls In Connaught Place (Delhi)
Cheap Rate ✨➥9711108085▻✨Call Girls In Connaught Place (Delhi)Cheap Rate ✨➥9711108085▻✨Call Girls In Connaught Place (Delhi)
Cheap Rate ✨➥9711108085▻✨Call Girls In Connaught Place (Delhi)
 
Low Rate ✨➥9711108085▻✨Call Girls In East Of Kailash (E.K) (Delhi)
Low Rate ✨➥9711108085▻✨Call Girls In East Of Kailash (E.K) (Delhi)Low Rate ✨➥9711108085▻✨Call Girls In East Of Kailash (E.K) (Delhi)
Low Rate ✨➥9711108085▻✨Call Girls In East Of Kailash (E.K) (Delhi)
 
Jaipur Escorts 🥰 8617370543 Call Girls Offer VIP Hot Girls
Jaipur Escorts 🥰 8617370543 Call Girls Offer VIP Hot GirlsJaipur Escorts 🥰 8617370543 Call Girls Offer VIP Hot Girls
Jaipur Escorts 🥰 8617370543 Call Girls Offer VIP Hot Girls
 
Call girls in Shakti Nagar Delhi~8447779280°/=@/ Short 1500 Night 6000}ESCORT...
Call girls in Shakti Nagar Delhi~8447779280°/=@/ Short 1500 Night 6000}ESCORT...Call girls in Shakti Nagar Delhi~8447779280°/=@/ Short 1500 Night 6000}ESCORT...
Call girls in Shakti Nagar Delhi~8447779280°/=@/ Short 1500 Night 6000}ESCORT...
 
Call girls In Rana Pratap Bagh {Delhi ↫8447779280↬Escort Service (Delhi)
Call girls In Rana Pratap Bagh {Delhi ↫8447779280↬Escort Service (Delhi)Call girls In Rana Pratap Bagh {Delhi ↫8447779280↬Escort Service (Delhi)
Call girls In Rana Pratap Bagh {Delhi ↫8447779280↬Escort Service (Delhi)
 
BPTP THE AMAARIO For The Royals Of Tomorrow in Sector 37D Gurgaon Dwarka Expr...
BPTP THE AMAARIO For The Royals Of Tomorrow in Sector 37D Gurgaon Dwarka Expr...BPTP THE AMAARIO For The Royals Of Tomorrow in Sector 37D Gurgaon Dwarka Expr...
BPTP THE AMAARIO For The Royals Of Tomorrow in Sector 37D Gurgaon Dwarka Expr...
 
Low Density Living New Project in BPTP THE AMAARIO Sector 37D Gurgaon Haryana...
Low Density Living New Project in BPTP THE AMAARIO Sector 37D Gurgaon Haryana...Low Density Living New Project in BPTP THE AMAARIO Sector 37D Gurgaon Haryana...
Low Density Living New Project in BPTP THE AMAARIO Sector 37D Gurgaon Haryana...
 
SVN Live 5.6.24 Weekly Property Broadcast
SVN Live 5.6.24 Weekly Property BroadcastSVN Live 5.6.24 Weekly Property Broadcast
SVN Live 5.6.24 Weekly Property Broadcast
 
Kalpataru Exquisite Wakad Pune E-Brochure.pdf
Kalpataru Exquisite Wakad Pune  E-Brochure.pdfKalpataru Exquisite Wakad Pune  E-Brochure.pdf
Kalpataru Exquisite Wakad Pune E-Brochure.pdf
 
Best Interior Design Services in Haldwani
Best Interior Design Services in HaldwaniBest Interior Design Services in Haldwani
Best Interior Design Services in Haldwani
 

November 2016 REBGV Stats Mike Stewart Vancouver Realtor