Mon optic
•Télécharger en tant que PPT, PDF•
0 j'aime•397 vues

The document outlines a strategy called OPTIC for reading and understanding graphs and charts. OPTIC is an acronym that stands for Overview, Parts, Title, Inference, and Conclusion. The strategy involves first getting an overview of the entire graph, then examining its individual parts, reading the title, making inferences from the data, and forming a conclusion. Examples are provided of using the OPTIC strategy to analyze different types of graphs, charts, and maps. Readers are then assigned a homework task that involves applying the OPTIC strategy to analyze their own chosen data visualization.

Recommandé
Contenu connexe
En vedette
En vedette (19)
Plus de Travis Klein
Plus de Travis Klein (20)
Dernier
Dernier (20)
Mon optic
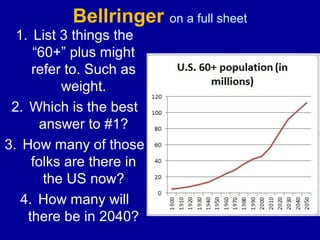
- 1. Bellringer on a full sheet 1. List 3 things the “60+” plus might refer to. Such as weight. 2. Which is the best answer to #1? 3. How many of those folks are there in the US now? 4. How many will there be in 2040?
- 2. A strategy to read graphs (or pictures) O verview P art s T it le I nf erence OR I nt errelat ionships C onclusion
- 3. A strategy to read graphs (or pictures) O verview P art s T it le I nf erence C onclusion
- 4. A strategy to read graphs (or pictures) O verview P art s T it le I nf erence C onclusion
- 5. A strategy to read graphs (or pictures) O verview P art s T it le I nf erence C onclusion
- 6. A strategy to read graphs (or pictures) O verview P art s T it le I nf erence C onclusion
- 7. A strategy to read graphs (or pictures) O verview P art s T it le I nf erence C onclusion
- 8. A strategy to read graphs (or pictures) O verview P art s T it le I nf erence C onclusion
- 9. A strategy to read graphs (or pictures) O verview P art s T it le I nf erence C onclusion
- 10. A strategy to read graphs (or pictures) O verview P art s T it le I nf erence C onclusion
- 11. A strategy to read graphs (or pictures) O verview P art s T it le I nf erence C onclusion
- 12. A strategy to read graphs (or pictures) O verview P art s T it le I nf erence C onclusion
- 13. A strategy to read graphs (or pictures) O verview P art s T it le I nf erence C onclusion Source: Associated Press
- 14. A strategy to read graphs (or pictures) O verview P art s T it le I nf erence C onclusion
- 15. A strategy to read graphs (or pictures) O verview P art s T it le I nf erence C onclusion
- 16. A strategy to read graphs (or pictures) O verview P art s T it le I nf erence C onclusion
- 17. 10 Quantitative Easing points • Find your own chart, graph or map • Use OPTIC to explain it • Email to travis.klein@tusd1.org, or bring in on flash drive by next Monday