
Recommandé
Contenu connexe
Plus de mlabuski
Plus de mlabuski (20)
Lesson 6 7 line graphs
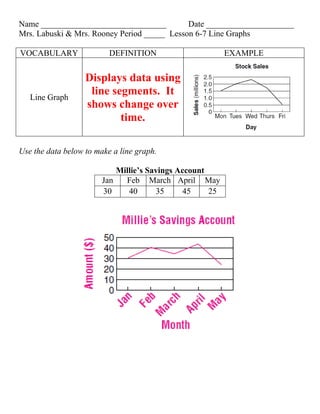
- 1. Name ______________________________ Date _____________________ Mrs. Labuski & Mrs. Rooney Period _____ Lesson 6-7 Line Graphs VOCABULARY DEFINITION EXAMPLE Displays data using Line Graph line segments. It shows change over time. Use the data below to make a line graph. Millie’s Savings Account Jan Feb March April May 30 40 35 45 25
- 2. Let’s practice reading a line graph. 1. In which year were the average weekly earnings in the United States the highest? 2000 2. In general, how did average weekly earnings in the United States change between 1970 and 2000? The earnings increased. 3. In which year did the average United States worker earn about $350 a week? 1990 Use the data below to make a line graph. US Minimum Wage Year Hourly Rate 1970 $1.20 1980 $3.10 1990 $3.80 2000 $5.15 5. Between which two years shown on the graph did the U.S. minimum wage change the least? 1980 and 1990 6. How has the hourly minimum wage changed in the U.S. since 1970? It has increased. Name ______________________________ Date _____________________
- 3. Mrs. Labuski & Mrs. Rooney Period _____ Lesson 6-7 Line Graphs VOCABULARY DEFINITION EXAMPLE Line Graph Use the data below to make a line graph. Millie’s Savings Account Jan Feb March April May 30 40 35 45 25 Let’s practice reading a line graph.
- 4. 1. In which year were the average weekly earnings in the United States the highest? ___________________________________ 2. In general, how did average weekly earnings in the United States change between 1970 and 2000? ________________________________ 3. In which year did the average United States worker earn about $350 a week? ___________ Use the data below to make a line graph. US Minimum Wage Year Hourly Rate 1970 $1.20 1980 $3.10 1990 $3.80 2000 $5.15 5. Between which two years shown on the graph did the U.S. minimum wage change the least? _____________________________________________________ 6. How has the hourly minimum wage changed in the U.S. since 1970? _________