SlideShare une entreprise Scribd logo
1  sur  6
Name _______________________________ Date ____________________
Mrs. Labuski & Mrs. Portsmore Period ____ Unit 12 Lesson 3 Frequency
Tables & Histograms
TB 6-5/ OC 177
VOCABULARY DEFINITION EXAMPLE
FREQUENCY
TABLE
Tells the number of
times an event,
category, or group
occurs
TYPES OF FRUIT
Fruit Frequency
Cumulative
Frequency
apple 5 5
banana 4 9
strawberry 2 11
CUMULATIVE
FREQUENCY
This column shows a
running total of all
frequencies.
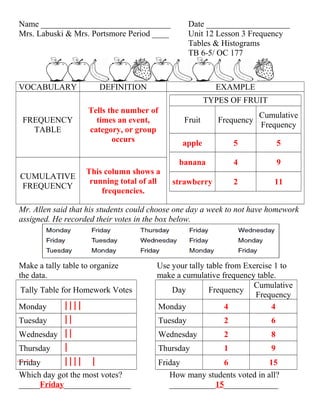
Mr. Allen said that his students could choose one day a week to not have homework
assigned. He recorded their votes in the box below.
Make a tally table to organize Use your tally table from Exercise 1 to
the data. make a cumulative frequency table.
Tally Table for Homework Votes Day Frequency
Cumulative
Frequency
Monday  Monday 4 4
Tuesday  Tuesday 2 6
Wednesday  Wednesday 2 8
Thursday  Thursday 1 9
Friday   Friday 6 15
Which day got the most votes? How many students voted in all?
_____Friday________________ ___________15_____________
Students listed the number of days they spent on vacation in one year.
Make a tally table with intervals of 5.
2, 18, 5, 15, 7, 10, 1, 10, 4, 16,
7, 11, 17, 3, 8, 14, 13, 10
Number of Vacation Days
1-5 
6-10  
11-15 
16-20 
HISTOGRAM
A bar graph that
shows the
number of data
itmes that occur
within each
interval
1. Choose an appropriate scale and
interval.
2. Draw a bar for the number of days
in each interval.
3. Title the graph and label the axes.
Number of Days spent on Vacation in one Year
7
6
5
4
3
2
1
0
1-5 6-10 11-15 16-20
Number of Vacation Days
Name _______________________________ Date ____________________
Mrs. Labuski & Mrs. Portsmore Period ____ Unit 12 Lesson 3 Frequency
Tables & Histograms
TB 6-5/ OC 177
VOCABULARY DEFINITION EXAMPLE
FREQUENCY
TABLE
TYPES OF FRUIT
Fruit Frequency
Cumulative
Frequency
CUMULATIVE
FREQUENCY
Mr. Allen said that his students could choose one day a week to not have homework assigned.
He recorded their votes in the box below.
Make a tally table to organize Use your tally table from Exercise 1 to
the data. make a cumulative frequency table.
Tally Table for Homework Votes Day Frequency
Cumulative
Frequency
Monday Monday
Tuesday Tuesday
Wednesday Wednesday
Thursday Thursday
Friday Friday
Which day got the most votes? How many students voted in all?
________________________ ________________________
Students listed the number of days they spent on vacation in one year.
Make a tally table with intervals of 5.
2, 18, 5, 15, 7, 10, 1, 10, 4, 16,
7, 11, 17, 3, 8, 14, 13, 10
HISTOGRAM
1. Choose an appropriate scale and
interval.
2. Draw a bar for the number of days
in each interval.
3. Title the graph and label the axes.
Unit 12 lesson 3 frequency tables & histograms

Contenu connexe

En vedette

61 exponential functions
61 exponential functions61 exponential functions
61 exponential functions
math126
 
The Exponential and natural log functions
The Exponential and natural log functionsThe Exponential and natural log functions
The Exponential and natural log functions
JJkedst
 
Frequency Tables - Statistics
Frequency Tables - StatisticsFrequency Tables - Statistics
Frequency Tables - Statistics
mscartersmaths
 
Exponential functions
Exponential functionsExponential functions
Exponential functions
Ron Eick
 
Exponential Functions
Exponential FunctionsExponential Functions
Exponential Functions
itutor
 

En vedette (13)

61 exponential functions
61 exponential functions61 exponential functions
61 exponential functions
 
Tutorials--Exponential Functions in Tabular and Graph Form
Tutorials--Exponential Functions in Tabular and Graph FormTutorials--Exponential Functions in Tabular and Graph Form
Tutorials--Exponential Functions in Tabular and Graph Form
 
Two way frequency tables
Two way frequency tablesTwo way frequency tables
Two way frequency tables
 
Lesson 14: Exponential Functions
Lesson 14: Exponential FunctionsLesson 14: Exponential Functions
Lesson 14: Exponential Functions
 
Frequency tables and pie charts constructing and questions
Frequency tables and pie charts   constructing and questionsFrequency tables and pie charts   constructing and questions
Frequency tables and pie charts constructing and questions
 
The Exponential and natural log functions
The Exponential and natural log functionsThe Exponential and natural log functions
The Exponential and natural log functions
 
Frequency Tables - Statistics
Frequency Tables - StatisticsFrequency Tables - Statistics
Frequency Tables - Statistics
 
Exponential functions
Exponential functionsExponential functions
Exponential functions
 
Exponential functions
Exponential functionsExponential functions
Exponential functions
 
Exponential Functions
Exponential FunctionsExponential Functions
Exponential Functions
 
Exponential functions
Exponential functionsExponential functions
Exponential functions
 
Frequency Tables, Frequency Distributions, and Graphic Presentation
Frequency Tables, Frequency Distributions, and Graphic PresentationFrequency Tables, Frequency Distributions, and Graphic Presentation
Frequency Tables, Frequency Distributions, and Graphic Presentation
 
1527 exponential functions
1527 exponential functions1527 exponential functions
1527 exponential functions
 

Similaire à Unit 12 lesson 3 frequency tables & histograms

Willie Evangelista - Presentation of data
Willie Evangelista -  Presentation of data Willie Evangelista -  Presentation of data
Willie Evangelista - Presentation of data
Willie Evangelista
 
Module 1 SLP 1I collected the data on the time.docx
Module 1 SLP 1I collected the data on the time.docxModule 1 SLP 1I collected the data on the time.docx
Module 1 SLP 1I collected the data on the time.docx
annandleola
 
Unit 12 lesson 1 2 statistics dot plots
Unit 12 lesson 1  2 statistics  dot plotsUnit 12 lesson 1  2 statistics  dot plots
Unit 12 lesson 1 2 statistics dot plots
mlabuski
 
2nd Alumni - CTJ - IBEU Conference - Assessing Outside the Box
2nd Alumni - CTJ - IBEU Conference - Assessing Outside the Box2nd Alumni - CTJ - IBEU Conference - Assessing Outside the Box
2nd Alumni - CTJ - IBEU Conference - Assessing Outside the Box
Frank Couto
 
Presentationofdata 120111034007-phpapp02
Presentationofdata 120111034007-phpapp02Presentationofdata 120111034007-phpapp02
Presentationofdata 120111034007-phpapp02
Alex Robianes Hernandez
 

Similaire à Unit 12 lesson 3 frequency tables & histograms (20)

Me write an exam ucr-wb
Me write an exam ucr-wbMe write an exam ucr-wb
Me write an exam ucr-wb
 
ORGANIZING DATA mathematics 7(4th quarter).pptx
ORGANIZING DATA mathematics 7(4th quarter).pptxORGANIZING DATA mathematics 7(4th quarter).pptx
ORGANIZING DATA mathematics 7(4th quarter).pptx
 
English III Orientation
English III OrientationEnglish III Orientation
English III Orientation
 
Willie Evangelista - Presentation of data
Willie Evangelista -  Presentation of data Willie Evangelista -  Presentation of data
Willie Evangelista - Presentation of data
 
Test corrections
Test correctionsTest corrections
Test corrections
 
Module 1 SLP 1I collected the data on the time.docx
Module 1 SLP 1I collected the data on the time.docxModule 1 SLP 1I collected the data on the time.docx
Module 1 SLP 1I collected the data on the time.docx
 
Introduction to probability
Introduction to probabilityIntroduction to probability
Introduction to probability
 
Homework Jan 11
Homework Jan 11Homework Jan 11
Homework Jan 11
 
Unit 12 lesson 1 2 statistics dot plots
Unit 12 lesson 1  2 statistics  dot plotsUnit 12 lesson 1  2 statistics  dot plots
Unit 12 lesson 1 2 statistics dot plots
 
MIKE'S IELTS - WRITING Step by Step - DOC THU
MIKE'S IELTS - WRITING Step by Step - DOC THUMIKE'S IELTS - WRITING Step by Step - DOC THU
MIKE'S IELTS - WRITING Step by Step - DOC THU
 
2nd Alumni - CTJ - IBEU Conference - Assessing Outside the Box
2nd Alumni - CTJ - IBEU Conference - Assessing Outside the Box2nd Alumni - CTJ - IBEU Conference - Assessing Outside the Box
2nd Alumni - CTJ - IBEU Conference - Assessing Outside the Box
 
(7) Lesson 4.3 - Add and Subtract Like Fractions
(7) Lesson 4.3 - Add and Subtract Like Fractions(7) Lesson 4.3 - Add and Subtract Like Fractions
(7) Lesson 4.3 - Add and Subtract Like Fractions
 
SemiDLL-CO2.Circle-Math 10-Quarter 1docx
SemiDLL-CO2.Circle-Math 10-Quarter 1docxSemiDLL-CO2.Circle-Math 10-Quarter 1docx
SemiDLL-CO2.Circle-Math 10-Quarter 1docx
 
Fractions
FractionsFractions
Fractions
 
Exam Writing Slideshare
Exam Writing SlideshareExam Writing Slideshare
Exam Writing Slideshare
 
Nameweeks 5 7 statistics islanddirectionsfor all c
Nameweeks 5 7 statistics islanddirectionsfor all cNameweeks 5 7 statistics islanddirectionsfor all c
Nameweeks 5 7 statistics islanddirectionsfor all c
 
Test Construction and Administering classroom examinations.pptx
Test Construction and Administering classroom examinations.pptxTest Construction and Administering classroom examinations.pptx
Test Construction and Administering classroom examinations.pptx
 
April 30 presentation
April 30 presentationApril 30 presentation
April 30 presentation
 
Presentationofdata 120111034007-phpapp02
Presentationofdata 120111034007-phpapp02Presentationofdata 120111034007-phpapp02
Presentationofdata 120111034007-phpapp02
 
Math 6 DLP_q1_week 1
Math 6 DLP_q1_week 1Math 6 DLP_q1_week 1
Math 6 DLP_q1_week 1
 

Plus de mlabuski

Team orion supply list 15 16
Team orion supply list 15 16Team orion supply list 15 16
Team orion supply list 15 16
mlabuski
 
Literature letter graphic organizer
Literature letter graphic organizerLiterature letter graphic organizer
Literature letter graphic organizer
mlabuski
 
Team orion supply list 15 16
Team orion supply list 15 16Team orion supply list 15 16
Team orion supply list 15 16
mlabuski
 
Literature letters revised
Literature letters revisedLiterature letters revised
Literature letters revised
mlabuski
 
Final exam review sheet # 2 2015
Final exam review sheet # 2 2015Final exam review sheet # 2 2015
Final exam review sheet # 2 2015
mlabuski
 
Final exam review sheet # 3 2015
Final exam review sheet # 3 2015Final exam review sheet # 3 2015
Final exam review sheet # 3 2015
mlabuski
 
Final exam review sheet # 1 2015
Final exam review sheet # 1 2015Final exam review sheet # 1 2015
Final exam review sheet # 1 2015
mlabuski
 
Lessons 12 13 merged
Lessons 12 13 mergedLessons 12 13 merged
Lessons 12 13 merged
mlabuski
 
Mod 5 lesson 12 13
Mod 5 lesson 12 13Mod 5 lesson 12 13
Mod 5 lesson 12 13
mlabuski
 
G6 m5-c-lesson 13-t
G6 m5-c-lesson 13-tG6 m5-c-lesson 13-t
G6 m5-c-lesson 13-t
mlabuski
 
G6 m5-c-lesson 13-s
G6 m5-c-lesson 13-sG6 m5-c-lesson 13-s
G6 m5-c-lesson 13-s
mlabuski
 
G6 m5-c-lesson 12-t
G6 m5-c-lesson 12-tG6 m5-c-lesson 12-t
G6 m5-c-lesson 12-t
mlabuski
 
G6 m5-c-lesson 12-s
G6 m5-c-lesson 12-sG6 m5-c-lesson 12-s
G6 m5-c-lesson 12-s
mlabuski
 
Mod 5 lesson 9
Mod 5 lesson 9Mod 5 lesson 9
Mod 5 lesson 9
mlabuski
 
G6 m5-b-lesson 9-t
G6 m5-b-lesson 9-tG6 m5-b-lesson 9-t
G6 m5-b-lesson 9-t
mlabuski
 
G6 m5-b-lesson 9-s
G6 m5-b-lesson 9-sG6 m5-b-lesson 9-s
G6 m5-b-lesson 9-s
mlabuski
 
Mod 5 lesson 8
Mod 5 lesson 8Mod 5 lesson 8
Mod 5 lesson 8
mlabuski
 

Plus de mlabuski (20)

Quiz week 1 & 2 study guide
Quiz week 1 & 2 study guideQuiz week 1 & 2 study guide
Quiz week 1 & 2 study guide
 
Quiz week 1 & 2 practice
Quiz week 1 & 2 practiceQuiz week 1 & 2 practice
Quiz week 1 & 2 practice
 
Welcome to social studies
Welcome to social studiesWelcome to social studies
Welcome to social studies
 
Team orion supply list 15 16
Team orion supply list 15 16Team orion supply list 15 16
Team orion supply list 15 16
 
Literature letter graphic organizer
Literature letter graphic organizerLiterature letter graphic organizer
Literature letter graphic organizer
 
Team orion supply list 15 16
Team orion supply list 15 16Team orion supply list 15 16
Team orion supply list 15 16
 
Literature letters revised
Literature letters revisedLiterature letters revised
Literature letters revised
 
Final exam review sheet # 2 2015
Final exam review sheet # 2 2015Final exam review sheet # 2 2015
Final exam review sheet # 2 2015
 
Final exam review sheet # 3 2015
Final exam review sheet # 3 2015Final exam review sheet # 3 2015
Final exam review sheet # 3 2015
 
Final exam review sheet # 1 2015
Final exam review sheet # 1 2015Final exam review sheet # 1 2015
Final exam review sheet # 1 2015
 
Lessons 12 13 merged
Lessons 12 13 mergedLessons 12 13 merged
Lessons 12 13 merged
 
Mod 5 lesson 12 13
Mod 5 lesson 12 13Mod 5 lesson 12 13
Mod 5 lesson 12 13
 
G6 m5-c-lesson 13-t
G6 m5-c-lesson 13-tG6 m5-c-lesson 13-t
G6 m5-c-lesson 13-t
 
G6 m5-c-lesson 13-s
G6 m5-c-lesson 13-sG6 m5-c-lesson 13-s
G6 m5-c-lesson 13-s
 
G6 m5-c-lesson 12-t
G6 m5-c-lesson 12-tG6 m5-c-lesson 12-t
G6 m5-c-lesson 12-t
 
G6 m5-c-lesson 12-s
G6 m5-c-lesson 12-sG6 m5-c-lesson 12-s
G6 m5-c-lesson 12-s
 
Mod 5 lesson 9
Mod 5 lesson 9Mod 5 lesson 9
Mod 5 lesson 9
 
G6 m5-b-lesson 9-t
G6 m5-b-lesson 9-tG6 m5-b-lesson 9-t
G6 m5-b-lesson 9-t
 
G6 m5-b-lesson 9-s
G6 m5-b-lesson 9-sG6 m5-b-lesson 9-s
G6 m5-b-lesson 9-s
 
Mod 5 lesson 8
Mod 5 lesson 8Mod 5 lesson 8
Mod 5 lesson 8
 

Unit 12 lesson 3 frequency tables & histograms

  • 1. Name _______________________________ Date ____________________ Mrs. Labuski & Mrs. Portsmore Period ____ Unit 12 Lesson 3 Frequency Tables & Histograms TB 6-5/ OC 177 VOCABULARY DEFINITION EXAMPLE FREQUENCY TABLE Tells the number of times an event, category, or group occurs TYPES OF FRUIT Fruit Frequency Cumulative Frequency apple 5 5 banana 4 9 strawberry 2 11 CUMULATIVE FREQUENCY This column shows a running total of all frequencies. Mr. Allen said that his students could choose one day a week to not have homework assigned. He recorded their votes in the box below. Make a tally table to organize Use your tally table from Exercise 1 to the data. make a cumulative frequency table. Tally Table for Homework Votes Day Frequency Cumulative Frequency Monday  Monday 4 4 Tuesday  Tuesday 2 6 Wednesday  Wednesday 2 8 Thursday  Thursday 1 9 Friday   Friday 6 15 Which day got the most votes? How many students voted in all? _____Friday________________ ___________15_____________
  • 2. Students listed the number of days they spent on vacation in one year. Make a tally table with intervals of 5. 2, 18, 5, 15, 7, 10, 1, 10, 4, 16, 7, 11, 17, 3, 8, 14, 13, 10 Number of Vacation Days 1-5  6-10   11-15  16-20  HISTOGRAM A bar graph that shows the number of data itmes that occur within each interval 1. Choose an appropriate scale and interval. 2. Draw a bar for the number of days in each interval. 3. Title the graph and label the axes. Number of Days spent on Vacation in one Year 7 6 5 4 3 2 1 0
  • 3. 1-5 6-10 11-15 16-20 Number of Vacation Days Name _______________________________ Date ____________________ Mrs. Labuski & Mrs. Portsmore Period ____ Unit 12 Lesson 3 Frequency Tables & Histograms TB 6-5/ OC 177 VOCABULARY DEFINITION EXAMPLE FREQUENCY TABLE TYPES OF FRUIT Fruit Frequency Cumulative Frequency CUMULATIVE FREQUENCY Mr. Allen said that his students could choose one day a week to not have homework assigned. He recorded their votes in the box below. Make a tally table to organize Use your tally table from Exercise 1 to the data. make a cumulative frequency table. Tally Table for Homework Votes Day Frequency Cumulative Frequency
  • 4. Monday Monday Tuesday Tuesday Wednesday Wednesday Thursday Thursday Friday Friday Which day got the most votes? How many students voted in all? ________________________ ________________________ Students listed the number of days they spent on vacation in one year. Make a tally table with intervals of 5. 2, 18, 5, 15, 7, 10, 1, 10, 4, 16, 7, 11, 17, 3, 8, 14, 13, 10 HISTOGRAM 1. Choose an appropriate scale and interval. 2. Draw a bar for the number of days in each interval. 3. Title the graph and label the axes.