SlideShare une entreprise Scribd logo
1  sur  5
Excel 2010
Below is a screen shot of a blank Excel window.

The Excel program can be used to gather and organize data, as an analytical tool (graphs and
charts), to maintain inventory, for budgets/financial needs, or to simply maintain a list of
names. Below is a break down on the parts of Excel and its terminology.

      A file in Excel is called a Workbook. A workbook is made up of Sheets (see lower left
      corner)


           Rows: numbered horizontal area
                                                     Columns: lettered vertical area


                Cell: one of the many rectangles that make up this portion of the
                window. They are named for the letter and number. Example: the
                highlighted cell in the upper left-hand corner is called cell A1.


       Sheet(s): act like pages in a book


                           Horizontal Scroll Bar: to move sheet left and right


             To add more sheets click this icon                                        Zoom

         To rename a sheet, double click and type new name

  Information Area: Excel will send you messages in this area of the window

  To move a sheet, click on the tab and drag it left or right
Tabs

                                                                        Box Launcher: click on this
                                                                        icon to see more less used
Ribbon: grey area                                                       commands


                                                    Command: icons that allow you to perform
                         Groups – related
                                                    tasks or make changes in the workbook
                         commands

                                                    Contextual Tab: This tab will appear if
                                                    an object is inserted and selected in
                                                    your sheet (page). It allows you to edit
                                                    the inserted image or object.


                                          Formula Bar: Shows you what is exactly in each cell.


 Name Bar: Shows you which cell you are in (or is highlighted)

                                    Fill Series: Type in your first (sometimes first and
                                    second) value(s) in a cell. Then select the cell(s) and
                                    click on the little square in the lower right corner of
                                    the cell. Drag down or to the right to fill cells.

                                         Height and Width: Two ways…

                                            1.) Right click the cell and select column width or Row
                                               Height. Adjust as you wish.
                                            2.) Double click on the line between the column letter
                                               you want to adjust and the next column letter. For
                                               example. To adjust column D, click on the line
                                               between D and E. To adjust row 3, click and drag on
                                               the between the 3 and the 4.

                         To delete a column or row: Right click on the letter or number you
                         want to remove. Right click and then select delete.


       Never skip rows or columns! Adjust spacing my making the cells larger or smaller
To Create a Graph using your Excel Data


To create a graph you must remember what needs to be included to properly display your
data in a way that can be read and analyzed.

Remember to think about TAILS and DRY MIX


      T- Title            D- Dependent Variable             M- Manipulated (Ind) Variable
      A- Axis             R- Responding variable            I-Independent variable
      I- Intervals        Y- Y Axis                         X- X Axis
      L- Labels
      S- Scale


                                               Column A is for data you want on the x-axis

                                                     This is your Independent Variable


                                               Column B is for data you want on your y-axis

                                                     This is your Dependent Variable


      Include a brief but fully descriptive heading at the top of each column explaining the
      data.

      Include units of measurement. As long as you include them in the column heading you
      do not have to list them after each data value. In fact you do not want to include
      them in an Excel data table as it will show up on your graph.

      Convert all data in the “Column A” to text. First, highlight the cells your data will fill.
      Select the Home Tab. Select Text in the Number Group. Then input your data. Be
      sure the blue triangle shows up in the upper left corner of each cell you add data to.
Step 1

 Click on A1, holding down the left mouse key and
 select your entire data table (click and drag)


Step 2

 Click the Insert Tab. Select the Chart you want to
 use (for a line or bar graph). This example will be for
 a line graph


Step 3

 When you select your graph it will appear in the
 middle of your data sheet. Click on the edge of the
 entire graph to select it and click on the command
 Move Chart Location then click on “New Sheet”. Later
 remember to rename that new sheet “Graph”.


Step 4

 In your new sheet, select the graph.
 Then click on Design under the Chart
 Contextual Tab. Click the Arrow on the
 right side of the Chart Layouts and
 choose the graph example that best fits
 your needs.
Step 5

 You will see the graph now has additional
 information and needs editing.

 Click on and delete the Legend or Key, you
 don’t need one for this graph. (You will
 need a key on some graphs).


Step 6

 You will see the graph now has additional information and needs editing.

 Edit the graph to fulfill the requirements of your assignment. This is when you can
 adjust your font color/size, graph colors, etc.


Step 7         Print Preview icon

 Printing

 Use the Print Preview command to view and edit your graph before printing. Set the page
 orientation to Landscape in Page Setup. On the Header/Footer tab, use Custom Footer to
 enter your full name, the project title and current date.

Contenu connexe

Tendances

Excel Tutorials - Finding & Removing the Duplicate Values
Excel Tutorials - Finding & Removing the Duplicate ValuesExcel Tutorials - Finding & Removing the Duplicate Values
Excel Tutorials - Finding & Removing the Duplicate ValuesMerve Nur Taş
 
MS Excel Learning for PPC Google AdWords Training Course
MS Excel Learning for PPC Google AdWords Training CourseMS Excel Learning for PPC Google AdWords Training Course
MS Excel Learning for PPC Google AdWords Training CourseRanjan Jena
 
Ms excel ppt
Ms excel pptMs excel ppt
Ms excel pptSuraj Jha
 
Excel formulas with-example-narration
Excel formulas with-example-narrationExcel formulas with-example-narration
Excel formulas with-example-narrationBelinda Prahl
 
Microsoft excel tutorial06
Microsoft excel tutorial06Microsoft excel tutorial06
Microsoft excel tutorial06Alam Khan
 
Micosoft Office Excel short cut keys
Micosoft Office  Excel short cut keysMicosoft Office  Excel short cut keys
Micosoft Office Excel short cut keysPeddi Kishore
 
MIRCROSOFT EXCEL- brief and useful for beginners by RISHABH BANSAL
MIRCROSOFT EXCEL- brief and useful for beginners by RISHABH BANSALMIRCROSOFT EXCEL- brief and useful for beginners by RISHABH BANSAL
MIRCROSOFT EXCEL- brief and useful for beginners by RISHABH BANSALRishabh Bansal
 
Excel2002
Excel2002Excel2002
Excel2002pprinik
 
Excel short cut keys and tips remaining
Excel short cut keys and tips remainingExcel short cut keys and tips remaining
Excel short cut keys and tips remainingNitin Aggarwal
 
Lesson 16 Working With Charts
Lesson 16   Working With ChartsLesson 16   Working With Charts
Lesson 16 Working With Chartsguevarra_2000
 
Experiment parts technology2008
Experiment parts technology2008Experiment parts technology2008
Experiment parts technology2008rylempty
 

Tendances (20)

Functions and Charts in Microsoft Excel
Functions and Charts in Microsoft ExcelFunctions and Charts in Microsoft Excel
Functions and Charts in Microsoft Excel
 
Excel Tutorials - Finding & Removing the Duplicate Values
Excel Tutorials - Finding & Removing the Duplicate ValuesExcel Tutorials - Finding & Removing the Duplicate Values
Excel Tutorials - Finding & Removing the Duplicate Values
 
MS Excel Learning for PPC Google AdWords Training Course
MS Excel Learning for PPC Google AdWords Training CourseMS Excel Learning for PPC Google AdWords Training Course
MS Excel Learning for PPC Google AdWords Training Course
 
Ms excel ppt
Ms excel pptMs excel ppt
Ms excel ppt
 
Excel tips and tricks you should try
Excel tips and tricks you should tryExcel tips and tricks you should try
Excel tips and tricks you should try
 
MS Excel Tips & Tricks
MS Excel Tips & TricksMS Excel Tips & Tricks
MS Excel Tips & Tricks
 
MS Excel Basics
 MS Excel Basics MS Excel Basics
MS Excel Basics
 
Excel formulas with-example-narration
Excel formulas with-example-narrationExcel formulas with-example-narration
Excel formulas with-example-narration
 
Presentation Excel
Presentation ExcelPresentation Excel
Presentation Excel
 
Intermediate Excel
Intermediate Excel Intermediate Excel
Intermediate Excel
 
Microsoft excel tutorial06
Microsoft excel tutorial06Microsoft excel tutorial06
Microsoft excel tutorial06
 
Microsoft excel tutorial06
Microsoft excel tutorial06Microsoft excel tutorial06
Microsoft excel tutorial06
 
Micosoft Office Excel short cut keys
Micosoft Office  Excel short cut keysMicosoft Office  Excel short cut keys
Micosoft Office Excel short cut keys
 
MIRCROSOFT EXCEL- brief and useful for beginners by RISHABH BANSAL
MIRCROSOFT EXCEL- brief and useful for beginners by RISHABH BANSALMIRCROSOFT EXCEL- brief and useful for beginners by RISHABH BANSAL
MIRCROSOFT EXCEL- brief and useful for beginners by RISHABH BANSAL
 
Excel training
Excel  training Excel  training
Excel training
 
Excel
ExcelExcel
Excel
 
Excel2002
Excel2002Excel2002
Excel2002
 
Excel short cut keys and tips remaining
Excel short cut keys and tips remainingExcel short cut keys and tips remaining
Excel short cut keys and tips remaining
 
Lesson 16 Working With Charts
Lesson 16   Working With ChartsLesson 16   Working With Charts
Lesson 16 Working With Charts
 
Experiment parts technology2008
Experiment parts technology2008Experiment parts technology2008
Experiment parts technology2008
 

En vedette

Psych ch.3 pre-test
Psych ch.3 pre-testPsych ch.3 pre-test
Psych ch.3 pre-testJake Jensen
 
Andellac2013
Andellac2013Andellac2013
Andellac2013hmnava
 
Boletin mercedespostventa
Boletin mercedespostventaBoletin mercedespostventa
Boletin mercedespostventahmnava
 
Presentatie Broekerveiling Museum voor Stichting de Waaier
Presentatie Broekerveiling Museum voor Stichting de WaaierPresentatie Broekerveiling Museum voor Stichting de Waaier
Presentatie Broekerveiling Museum voor Stichting de WaaierDanny Steigerwald
 
Introducing adon3d
Introducing adon3dIntroducing adon3d
Introducing adon3dSV Hegde
 
Opening sequence storyboard
Opening sequence storyboardOpening sequence storyboard
Opening sequence storyboardShaun96Elsworth
 
World tour, hungary
World tour, hungaryWorld tour, hungary
World tour, hungaryYgor Aguiar
 

En vedette (8)

Psych ch.3 pre-test
Psych ch.3 pre-testPsych ch.3 pre-test
Psych ch.3 pre-test
 
Andellac2013
Andellac2013Andellac2013
Andellac2013
 
Boletin mercedespostventa
Boletin mercedespostventaBoletin mercedespostventa
Boletin mercedespostventa
 
Presentatie Broekerveiling Museum voor Stichting de Waaier
Presentatie Broekerveiling Museum voor Stichting de WaaierPresentatie Broekerveiling Museum voor Stichting de Waaier
Presentatie Broekerveiling Museum voor Stichting de Waaier
 
Introducing adon3d
Introducing adon3dIntroducing adon3d
Introducing adon3d
 
Opening sequence storyboard
Opening sequence storyboardOpening sequence storyboard
Opening sequence storyboard
 
Evaluation Question 2
Evaluation Question 2 Evaluation Question 2
Evaluation Question 2
 
World tour, hungary
World tour, hungaryWorld tour, hungary
World tour, hungary
 

Similaire à Excel screen shot info 2

Excel 2003 tutorial 2
Excel 2003 tutorial 2Excel 2003 tutorial 2
Excel 2003 tutorial 2catacata1976
 
Getting started with_microsoft_excel
Getting started with_microsoft_excelGetting started with_microsoft_excel
Getting started with_microsoft_excelPratiksha Mhatre
 
Formatting Numbers Grade IV.pptx
Formatting Numbers Grade IV.pptxFormatting Numbers Grade IV.pptx
Formatting Numbers Grade IV.pptxbintetariq8
 
MS Excel and Visual Basic Applications.pptx
MS Excel and Visual Basic Applications.pptxMS Excel and Visual Basic Applications.pptx
MS Excel and Visual Basic Applications.pptxsurekha1287
 
Introduction to Excel
Introduction to ExcelIntroduction to Excel
Introduction to ExcelNajma Alam
 
Excel presentation
Excel presentationExcel presentation
Excel presentationDUSPviz
 
Excel Tutorials
Excel TutorialsExcel Tutorials
Excel TutorialsLUZ PINGOL
 
Module 6 component of excel chart
Module 6 component of excel chartModule 6 component of excel chart
Module 6 component of excel chartDr. Shalini Pandey
 
Correlations and Scatterplots MS Excel Lesson 2 Grade 8.ppt
Correlations and Scatterplots MS Excel Lesson 2 Grade 8.pptCorrelations and Scatterplots MS Excel Lesson 2 Grade 8.ppt
Correlations and Scatterplots MS Excel Lesson 2 Grade 8.pptJoshuaCasas7
 
Excel Lesson 15
Excel Lesson 15Excel Lesson 15
Excel Lesson 15wyork
 

Similaire à Excel screen shot info 2 (20)

Excel 2003 tutorial 2
Excel 2003 tutorial 2Excel 2003 tutorial 2
Excel 2003 tutorial 2
 
Excel Basics.ppt
Excel Basics.pptExcel Basics.ppt
Excel Basics.ppt
 
Getting started with_microsoft_excel
Getting started with_microsoft_excelGetting started with_microsoft_excel
Getting started with_microsoft_excel
 
Ms excel ppt
Ms excel pptMs excel ppt
Ms excel ppt
 
Formatting Numbers Grade IV.pptx
Formatting Numbers Grade IV.pptxFormatting Numbers Grade IV.pptx
Formatting Numbers Grade IV.pptx
 
Excel
ExcelExcel
Excel
 
MS Excel and Visual Basic Applications.pptx
MS Excel and Visual Basic Applications.pptxMS Excel and Visual Basic Applications.pptx
MS Excel and Visual Basic Applications.pptx
 
Introduction to Excel
Introduction to ExcelIntroduction to Excel
Introduction to Excel
 
excell.pdf
excell.pdfexcell.pdf
excell.pdf
 
Excel presentation
Excel presentationExcel presentation
Excel presentation
 
Excel booklet
Excel bookletExcel booklet
Excel booklet
 
Excel Tutorials
Excel TutorialsExcel Tutorials
Excel Tutorials
 
Excel
ExcelExcel
Excel
 
Module 6 component of excel chart
Module 6 component of excel chartModule 6 component of excel chart
Module 6 component of excel chart
 
Lab 4 Excel Basics.ppt
Lab 4 Excel Basics.pptLab 4 Excel Basics.ppt
Lab 4 Excel Basics.ppt
 
Lab 4 excel basics
Lab 4 excel basicsLab 4 excel basics
Lab 4 excel basics
 
Print16
Print16Print16
Print16
 
Correlations and Scatterplots MS Excel Lesson 2 Grade 8.ppt
Correlations and Scatterplots MS Excel Lesson 2 Grade 8.pptCorrelations and Scatterplots MS Excel Lesson 2 Grade 8.ppt
Correlations and Scatterplots MS Excel Lesson 2 Grade 8.ppt
 
Excel Lesson 15
Excel Lesson 15Excel Lesson 15
Excel Lesson 15
 
MS Excel 2010 tutorial 4
MS Excel 2010 tutorial 4MS Excel 2010 tutorial 4
MS Excel 2010 tutorial 4
 

Dernier

Artificial Intelligence Chap.5 : Uncertainty
Artificial Intelligence Chap.5 : UncertaintyArtificial Intelligence Chap.5 : Uncertainty
Artificial Intelligence Chap.5 : UncertaintyKhushali Kathiriya
 
Apidays New York 2024 - Scaling API-first by Ian Reasor and Radu Cotescu, Adobe
Apidays New York 2024 - Scaling API-first by Ian Reasor and Radu Cotescu, AdobeApidays New York 2024 - Scaling API-first by Ian Reasor and Radu Cotescu, Adobe
Apidays New York 2024 - Scaling API-first by Ian Reasor and Radu Cotescu, Adobeapidays
 
How to Troubleshoot Apps for the Modern Connected Worker
How to Troubleshoot Apps for the Modern Connected WorkerHow to Troubleshoot Apps for the Modern Connected Worker
How to Troubleshoot Apps for the Modern Connected WorkerThousandEyes
 
AWS Community Day CPH - Three problems of Terraform
AWS Community Day CPH - Three problems of TerraformAWS Community Day CPH - Three problems of Terraform
AWS Community Day CPH - Three problems of TerraformAndrey Devyatkin
 
Platformless Horizons for Digital Adaptability
Platformless Horizons for Digital AdaptabilityPlatformless Horizons for Digital Adaptability
Platformless Horizons for Digital AdaptabilityWSO2
 
Apidays New York 2024 - The value of a flexible API Management solution for O...
Apidays New York 2024 - The value of a flexible API Management solution for O...Apidays New York 2024 - The value of a flexible API Management solution for O...
Apidays New York 2024 - The value of a flexible API Management solution for O...apidays
 
Introduction to Multilingual Retrieval Augmented Generation (RAG)
Introduction to Multilingual Retrieval Augmented Generation (RAG)Introduction to Multilingual Retrieval Augmented Generation (RAG)
Introduction to Multilingual Retrieval Augmented Generation (RAG)Zilliz
 
Web Form Automation for Bonterra Impact Management (fka Social Solutions Apri...
Web Form Automation for Bonterra Impact Management (fka Social Solutions Apri...Web Form Automation for Bonterra Impact Management (fka Social Solutions Apri...
Web Form Automation for Bonterra Impact Management (fka Social Solutions Apri...Jeffrey Haguewood
 
Polkadot JAM Slides - Token2049 - By Dr. Gavin Wood
Polkadot JAM Slides - Token2049 - By Dr. Gavin WoodPolkadot JAM Slides - Token2049 - By Dr. Gavin Wood
Polkadot JAM Slides - Token2049 - By Dr. Gavin WoodJuan lago vázquez
 
Navigating the Deluge_ Dubai Floods and the Resilience of Dubai International...
Navigating the Deluge_ Dubai Floods and the Resilience of Dubai International...Navigating the Deluge_ Dubai Floods and the Resilience of Dubai International...
Navigating the Deluge_ Dubai Floods and the Resilience of Dubai International...Orbitshub
 
Mcleodganj Call Girls 🥰 8617370543 Service Offer VIP Hot Model
Mcleodganj Call Girls 🥰 8617370543 Service Offer VIP Hot ModelMcleodganj Call Girls 🥰 8617370543 Service Offer VIP Hot Model
Mcleodganj Call Girls 🥰 8617370543 Service Offer VIP Hot ModelDeepika Singh
 
Why Teams call analytics are critical to your entire business
Why Teams call analytics are critical to your entire businessWhy Teams call analytics are critical to your entire business
Why Teams call analytics are critical to your entire businesspanagenda
 
Vector Search -An Introduction in Oracle Database 23ai.pptx
Vector Search -An Introduction in Oracle Database 23ai.pptxVector Search -An Introduction in Oracle Database 23ai.pptx
Vector Search -An Introduction in Oracle Database 23ai.pptxRemote DBA Services
 
Connector Corner: Accelerate revenue generation using UiPath API-centric busi...
Connector Corner: Accelerate revenue generation using UiPath API-centric busi...Connector Corner: Accelerate revenue generation using UiPath API-centric busi...
Connector Corner: Accelerate revenue generation using UiPath API-centric busi...DianaGray10
 
Apidays New York 2024 - Accelerating FinTech Innovation by Vasa Krishnan, Fin...
Apidays New York 2024 - Accelerating FinTech Innovation by Vasa Krishnan, Fin...Apidays New York 2024 - Accelerating FinTech Innovation by Vasa Krishnan, Fin...
Apidays New York 2024 - Accelerating FinTech Innovation by Vasa Krishnan, Fin...apidays
 
Corporate and higher education May webinar.pptx
Corporate and higher education May webinar.pptxCorporate and higher education May webinar.pptx
Corporate and higher education May webinar.pptxRustici Software
 
Strategies for Landing an Oracle DBA Job as a Fresher
Strategies for Landing an Oracle DBA Job as a FresherStrategies for Landing an Oracle DBA Job as a Fresher
Strategies for Landing an Oracle DBA Job as a FresherRemote DBA Services
 
Architecting Cloud Native Applications
Architecting Cloud Native ApplicationsArchitecting Cloud Native Applications
Architecting Cloud Native ApplicationsWSO2
 
Strategize a Smooth Tenant-to-tenant Migration and Copilot Takeoff
Strategize a Smooth Tenant-to-tenant Migration and Copilot TakeoffStrategize a Smooth Tenant-to-tenant Migration and Copilot Takeoff
Strategize a Smooth Tenant-to-tenant Migration and Copilot Takeoffsammart93
 
Biography Of Angeliki Cooney | Senior Vice President Life Sciences | Albany, ...
Biography Of Angeliki Cooney | Senior Vice President Life Sciences | Albany, ...Biography Of Angeliki Cooney | Senior Vice President Life Sciences | Albany, ...
Biography Of Angeliki Cooney | Senior Vice President Life Sciences | Albany, ...Angeliki Cooney
 

Dernier (20)

Artificial Intelligence Chap.5 : Uncertainty
Artificial Intelligence Chap.5 : UncertaintyArtificial Intelligence Chap.5 : Uncertainty
Artificial Intelligence Chap.5 : Uncertainty
 
Apidays New York 2024 - Scaling API-first by Ian Reasor and Radu Cotescu, Adobe
Apidays New York 2024 - Scaling API-first by Ian Reasor and Radu Cotescu, AdobeApidays New York 2024 - Scaling API-first by Ian Reasor and Radu Cotescu, Adobe
Apidays New York 2024 - Scaling API-first by Ian Reasor and Radu Cotescu, Adobe
 
How to Troubleshoot Apps for the Modern Connected Worker
How to Troubleshoot Apps for the Modern Connected WorkerHow to Troubleshoot Apps for the Modern Connected Worker
How to Troubleshoot Apps for the Modern Connected Worker
 
AWS Community Day CPH - Three problems of Terraform
AWS Community Day CPH - Three problems of TerraformAWS Community Day CPH - Three problems of Terraform
AWS Community Day CPH - Three problems of Terraform
 
Platformless Horizons for Digital Adaptability
Platformless Horizons for Digital AdaptabilityPlatformless Horizons for Digital Adaptability
Platformless Horizons for Digital Adaptability
 
Apidays New York 2024 - The value of a flexible API Management solution for O...
Apidays New York 2024 - The value of a flexible API Management solution for O...Apidays New York 2024 - The value of a flexible API Management solution for O...
Apidays New York 2024 - The value of a flexible API Management solution for O...
 
Introduction to Multilingual Retrieval Augmented Generation (RAG)
Introduction to Multilingual Retrieval Augmented Generation (RAG)Introduction to Multilingual Retrieval Augmented Generation (RAG)
Introduction to Multilingual Retrieval Augmented Generation (RAG)
 
Web Form Automation for Bonterra Impact Management (fka Social Solutions Apri...
Web Form Automation for Bonterra Impact Management (fka Social Solutions Apri...Web Form Automation for Bonterra Impact Management (fka Social Solutions Apri...
Web Form Automation for Bonterra Impact Management (fka Social Solutions Apri...
 
Polkadot JAM Slides - Token2049 - By Dr. Gavin Wood
Polkadot JAM Slides - Token2049 - By Dr. Gavin WoodPolkadot JAM Slides - Token2049 - By Dr. Gavin Wood
Polkadot JAM Slides - Token2049 - By Dr. Gavin Wood
 
Navigating the Deluge_ Dubai Floods and the Resilience of Dubai International...
Navigating the Deluge_ Dubai Floods and the Resilience of Dubai International...Navigating the Deluge_ Dubai Floods and the Resilience of Dubai International...
Navigating the Deluge_ Dubai Floods and the Resilience of Dubai International...
 
Mcleodganj Call Girls 🥰 8617370543 Service Offer VIP Hot Model
Mcleodganj Call Girls 🥰 8617370543 Service Offer VIP Hot ModelMcleodganj Call Girls 🥰 8617370543 Service Offer VIP Hot Model
Mcleodganj Call Girls 🥰 8617370543 Service Offer VIP Hot Model
 
Why Teams call analytics are critical to your entire business
Why Teams call analytics are critical to your entire businessWhy Teams call analytics are critical to your entire business
Why Teams call analytics are critical to your entire business
 
Vector Search -An Introduction in Oracle Database 23ai.pptx
Vector Search -An Introduction in Oracle Database 23ai.pptxVector Search -An Introduction in Oracle Database 23ai.pptx
Vector Search -An Introduction in Oracle Database 23ai.pptx
 
Connector Corner: Accelerate revenue generation using UiPath API-centric busi...
Connector Corner: Accelerate revenue generation using UiPath API-centric busi...Connector Corner: Accelerate revenue generation using UiPath API-centric busi...
Connector Corner: Accelerate revenue generation using UiPath API-centric busi...
 
Apidays New York 2024 - Accelerating FinTech Innovation by Vasa Krishnan, Fin...
Apidays New York 2024 - Accelerating FinTech Innovation by Vasa Krishnan, Fin...Apidays New York 2024 - Accelerating FinTech Innovation by Vasa Krishnan, Fin...
Apidays New York 2024 - Accelerating FinTech Innovation by Vasa Krishnan, Fin...
 
Corporate and higher education May webinar.pptx
Corporate and higher education May webinar.pptxCorporate and higher education May webinar.pptx
Corporate and higher education May webinar.pptx
 
Strategies for Landing an Oracle DBA Job as a Fresher
Strategies for Landing an Oracle DBA Job as a FresherStrategies for Landing an Oracle DBA Job as a Fresher
Strategies for Landing an Oracle DBA Job as a Fresher
 
Architecting Cloud Native Applications
Architecting Cloud Native ApplicationsArchitecting Cloud Native Applications
Architecting Cloud Native Applications
 
Strategize a Smooth Tenant-to-tenant Migration and Copilot Takeoff
Strategize a Smooth Tenant-to-tenant Migration and Copilot TakeoffStrategize a Smooth Tenant-to-tenant Migration and Copilot Takeoff
Strategize a Smooth Tenant-to-tenant Migration and Copilot Takeoff
 
Biography Of Angeliki Cooney | Senior Vice President Life Sciences | Albany, ...
Biography Of Angeliki Cooney | Senior Vice President Life Sciences | Albany, ...Biography Of Angeliki Cooney | Senior Vice President Life Sciences | Albany, ...
Biography Of Angeliki Cooney | Senior Vice President Life Sciences | Albany, ...
 

Excel screen shot info 2

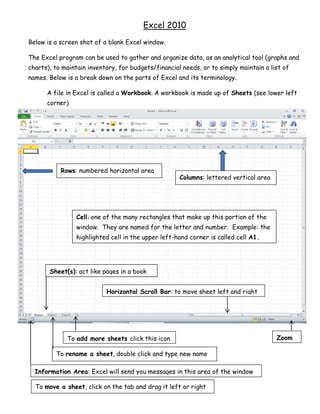
  • 1. Excel 2010 Below is a screen shot of a blank Excel window. The Excel program can be used to gather and organize data, as an analytical tool (graphs and charts), to maintain inventory, for budgets/financial needs, or to simply maintain a list of names. Below is a break down on the parts of Excel and its terminology. A file in Excel is called a Workbook. A workbook is made up of Sheets (see lower left corner) Rows: numbered horizontal area Columns: lettered vertical area Cell: one of the many rectangles that make up this portion of the window. They are named for the letter and number. Example: the highlighted cell in the upper left-hand corner is called cell A1. Sheet(s): act like pages in a book Horizontal Scroll Bar: to move sheet left and right To add more sheets click this icon Zoom To rename a sheet, double click and type new name Information Area: Excel will send you messages in this area of the window To move a sheet, click on the tab and drag it left or right
  • 2. Tabs Box Launcher: click on this icon to see more less used Ribbon: grey area commands Command: icons that allow you to perform Groups – related tasks or make changes in the workbook commands Contextual Tab: This tab will appear if an object is inserted and selected in your sheet (page). It allows you to edit the inserted image or object. Formula Bar: Shows you what is exactly in each cell. Name Bar: Shows you which cell you are in (or is highlighted) Fill Series: Type in your first (sometimes first and second) value(s) in a cell. Then select the cell(s) and click on the little square in the lower right corner of the cell. Drag down or to the right to fill cells. Height and Width: Two ways… 1.) Right click the cell and select column width or Row Height. Adjust as you wish. 2.) Double click on the line between the column letter you want to adjust and the next column letter. For example. To adjust column D, click on the line between D and E. To adjust row 3, click and drag on the between the 3 and the 4. To delete a column or row: Right click on the letter or number you want to remove. Right click and then select delete. Never skip rows or columns! Adjust spacing my making the cells larger or smaller
  • 3. To Create a Graph using your Excel Data To create a graph you must remember what needs to be included to properly display your data in a way that can be read and analyzed. Remember to think about TAILS and DRY MIX T- Title D- Dependent Variable M- Manipulated (Ind) Variable A- Axis R- Responding variable I-Independent variable I- Intervals Y- Y Axis X- X Axis L- Labels S- Scale Column A is for data you want on the x-axis This is your Independent Variable Column B is for data you want on your y-axis This is your Dependent Variable Include a brief but fully descriptive heading at the top of each column explaining the data. Include units of measurement. As long as you include them in the column heading you do not have to list them after each data value. In fact you do not want to include them in an Excel data table as it will show up on your graph. Convert all data in the “Column A” to text. First, highlight the cells your data will fill. Select the Home Tab. Select Text in the Number Group. Then input your data. Be sure the blue triangle shows up in the upper left corner of each cell you add data to.
  • 4. Step 1 Click on A1, holding down the left mouse key and select your entire data table (click and drag) Step 2 Click the Insert Tab. Select the Chart you want to use (for a line or bar graph). This example will be for a line graph Step 3 When you select your graph it will appear in the middle of your data sheet. Click on the edge of the entire graph to select it and click on the command Move Chart Location then click on “New Sheet”. Later remember to rename that new sheet “Graph”. Step 4 In your new sheet, select the graph. Then click on Design under the Chart Contextual Tab. Click the Arrow on the right side of the Chart Layouts and choose the graph example that best fits your needs.
  • 5. Step 5 You will see the graph now has additional information and needs editing. Click on and delete the Legend or Key, you don’t need one for this graph. (You will need a key on some graphs). Step 6 You will see the graph now has additional information and needs editing. Edit the graph to fulfill the requirements of your assignment. This is when you can adjust your font color/size, graph colors, etc. Step 7 Print Preview icon Printing Use the Print Preview command to view and edit your graph before printing. Set the page orientation to Landscape in Page Setup. On the Header/Footer tab, use Custom Footer to enter your full name, the project title and current date.