SlideShare une entreprise Scribd logo
1  sur  4
Basic Statistics 2011
Module 3

     Levels of Measurement
     Uses and Applications of Statistics
Objectives: At the end of the module, the students are expected to:

    1. Identify the level of measurement the data belong.
    2. Realize the uses and application of Statistics in real life.

Levels of Measurement
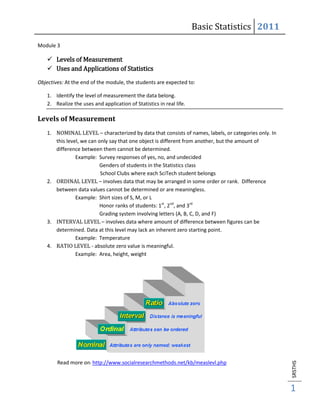
    1. NOMINAL LEVEL – characterized by data that consists of names, labels, or categories only. In
       this level, we can only say that one object is different from another, but the amount of
       difference between them cannot be determined.
                Example: Survey responses of yes, no, and undecided
                           Genders of students in the Statistics class
                           School Clubs where each SciTech student belongs
    2. ORDINAL LEVEL – involves data that may be arranged in some order or rank. Difference
       between data values cannot be determined or are meaningless.
                Example: Shirt sizes of S, M, or L
                           Honor ranks of students: 1st, 2nd, and 3rd
                           Grading system involving letters (A, B, C, D, and F)
    3. INTERVAL LEVEL – involves data where amount of difference between figures can be
       determined. Data at this level may lack an inherent zero starting point.
                Example: Temperature
    4. RATIO LEVEL - absolute zero value is meaningful.
                Example: Area, height, weight


        Read more on: http://www.socialresearchmethods.net/kb/measlevl.php
                                                                                                      SRSTHS


                                                                                                      1
Basic Statistics 2011
    A. Classify the following variables/data as to whether they are qualitative (QL) or
       quantitative (QN). Write also the level of measurement whether nominal (N), ordinal (O),
       interval (I), or ratio (R).

                                                                  QN/QL            Level/Scale

        1. Color of the eye
        2. Number of books in the library
        3. Position in the company
        4. Number of students enrolled in StaRSci
        5. Student ID Number
        6. Age
        7. Rank of Students
        8. Temperature in Santa Rosa
        9. Number of votes
        10. Religion

    B. Identify the level of dependent variable measurement (nominal, ordinal, interval, or ratio)
       implied by the statement.

        1. You asked congressmen if the money they have received from PACs is more than
        $100,000, between $50,000 and $100,000, or less than $50,000.

        2. You asked congress about the primary source of their PAC money: Labor unions,
        corporations, medical associations, or civil rights groups.

        3. You checked the congressional record to see how many times in the past year each
        congressman was absent from a roll call vote.

        4. You asked people on the street to rate their own congressman on a 1 - 7 Likert scale.

        5. You asked congressmen to indicate whether they are Republican, Democrat, or
        Independent.

        6. You asked people on the street to rate their own congressman as very liberal, slightly
        liberal, moderate, slightly conservative or very conservative.

        7. You asked each congressman how many years s/he had been in congress.

        8. You asked congressmen: Of the following issues, rank order the top three in
        importance: gas prices, war in Iraq, war in Afghanistan, urban crime, domestic poverty,
        subprime mortgage crisis.

Source: http://www.brainmass.com/homework-help/business/business-analysis/255911
                                                                                                     SRSTHS


                                                                                                     2
Basic Statistics 2011
Level of Measurement Practice Exercises online
http://courses.csusm.edu/soc201kb/exercises.htm

Uses and Application of Statistics
       Statistics plays a vital role in many fields of human activity. The applications of statistics have
grown so that practically every field of study now benefits in some way from the use of statistical
methods.

        Statistics helps in determining the existing position of per capita income, unemployment,
        population growth rate, housing, schooling, and medical facilities in a country.
        Manufacturers provide better products at lower costs through the use of statistical quality
        control techniques.
        Diseases are controlled through analyses designed to anticipate epidemics.
        Endangered species of fish and other wildlife are protected through regulations and laws that
        react to statistical estimates of changing population sizes.
        By pointing to lower fatality rates, legislators can better justify laws such as those governing air
        pollution, auto inspections, seat belt and air bag use, and drunk driving.

There are a lot more examples but that will be left for you to discover.

More information in:

http://www.emathzone.com/tutorials/basic-statistics/functions-or-uses-of-statistics.html

http://www.emathzone.com/tutorials/basic-statistics/importance-of-statistics-in-different-fields.html

http://www.scribd.com/doc/3530536/Applications-of-Statistics

http://www.stat.auckland.ac.nz/~wild/ChanceEnc/Ch01.usesstat.pdf

Abuses of Statistics
                                                As educated and responsible member of society, you
                                                should hone your ability to recognize distorted statistical
                                                data and learn to interpret undistorted data intelligently.
                                                You should be aware and critical to misleading and
                                                deceptive claims, such as those commonly associated with
                                                polls, graphs, and averages.

                                                More examples on:

                                                http://www.econoclass.com/misleadingstats.html

                                                http://faculty.atu.edu/mfinan/2043/section31.pdf
                                                                                                               SRSTHS


                                                                                                               3
Basic Statistics 2011

Assignment:
     1. Why do students like you need to study Statistics?
     2. Watch TV tonight or read the newspaper. Identify at least three commercials, shows, or
        segments which mentioned some kind of statistics. (example: the text poll in TV Patrol
        which asked “Do you think Pacquiao deserved his victory?”)
     3. What profession do you intend to pursue after high school? How do you think can Statistics
        be used in the field of your interest? Enumerate applications of statistics to your field of
        interest.
     4. Who do you think can benefit from the statistics given below? How can it be useful to them?


                                                                                                       SRSTHS


                                                                                                       4

Contenu connexe

Tendances

Unpublished study indicates high chance of fraud in thousands of tests of enem
Unpublished study indicates high chance of fraud in thousands of tests of enemUnpublished study indicates high chance of fraud in thousands of tests of enem
Unpublished study indicates high chance of fraud in thousands of tests of enemCaveon Test Security
 
Modelling Conformity of Nigeria’s Recent Population Censuses With Benford’s D...
Modelling Conformity of Nigeria’s Recent Population Censuses With Benford’s D...Modelling Conformity of Nigeria’s Recent Population Censuses With Benford’s D...
Modelling Conformity of Nigeria’s Recent Population Censuses With Benford’s D...inventionjournals
 
How to handle government related questions.
How to handle government related questions.How to handle government related questions.
How to handle government related questions.Kyle Guzik
 
Chapter 1 introduction to statistics
Chapter 1 introduction to statisticsChapter 1 introduction to statistics
Chapter 1 introduction to statisticsJohn Carlo Catacutan
 
Lesson 3 basic terms in statistics
Lesson 3 basic terms in statisticsLesson 3 basic terms in statistics
Lesson 3 basic terms in statisticsMaris Ganace
 
Module 1 statistics
Module 1   statisticsModule 1   statistics
Module 1 statisticsdionesioable
 
lecture 1 applied econometrics and economic modeling
lecture 1 applied econometrics and economic modelinglecture 1 applied econometrics and economic modeling
lecture 1 applied econometrics and economic modelingstone55
 
Estadística Aplicada a la Investigación
Estadística Aplicada a la InvestigaciónEstadística Aplicada a la Investigación
Estadística Aplicada a la InvestigaciónSistemadeEstudiosMed
 

Tendances (10)

Unpublished study indicates high chance of fraud in thousands of tests of enem
Unpublished study indicates high chance of fraud in thousands of tests of enemUnpublished study indicates high chance of fraud in thousands of tests of enem
Unpublished study indicates high chance of fraud in thousands of tests of enem
 
Statistics and probability lesson 4
Statistics and probability lesson 4Statistics and probability lesson 4
Statistics and probability lesson 4
 
1.5
1.51.5
1.5
 
Modelling Conformity of Nigeria’s Recent Population Censuses With Benford’s D...
Modelling Conformity of Nigeria’s Recent Population Censuses With Benford’s D...Modelling Conformity of Nigeria’s Recent Population Censuses With Benford’s D...
Modelling Conformity of Nigeria’s Recent Population Censuses With Benford’s D...
 
How to handle government related questions.
How to handle government related questions.How to handle government related questions.
How to handle government related questions.
 
Chapter 1 introduction to statistics
Chapter 1 introduction to statisticsChapter 1 introduction to statistics
Chapter 1 introduction to statistics
 
Lesson 3 basic terms in statistics
Lesson 3 basic terms in statisticsLesson 3 basic terms in statistics
Lesson 3 basic terms in statistics
 
Module 1 statistics
Module 1   statisticsModule 1   statistics
Module 1 statistics
 
lecture 1 applied econometrics and economic modeling
lecture 1 applied econometrics and economic modelinglecture 1 applied econometrics and economic modeling
lecture 1 applied econometrics and economic modeling
 
Estadística Aplicada a la Investigación
Estadística Aplicada a la InvestigaciónEstadística Aplicada a la Investigación
Estadística Aplicada a la Investigación
 

En vedette

Mean, Median, Mode: Measures of Central Tendency
Mean, Median, Mode: Measures of Central Tendency Mean, Median, Mode: Measures of Central Tendency
Mean, Median, Mode: Measures of Central Tendency Jan Nah
 
Measures of central tendency
Measures of central tendencyMeasures of central tendency
Measures of central tendencyChie Pegollo
 
Counting techniques
Counting techniquesCounting techniques
Counting techniquesChie Pegollo
 
Presentationofdatamod6b
Presentationofdatamod6bPresentationofdatamod6b
Presentationofdatamod6bChie Pegollo
 
Measurement in social science research
Measurement in social science research Measurement in social science research
Measurement in social science research Yagnesh sondarva
 
Simple understanding of biostatistics
Simple understanding of biostatisticsSimple understanding of biostatistics
Simple understanding of biostatisticsHamdi Alhakimi
 
Measures of dispersion
Measures of dispersion Measures of dispersion
Measures of dispersion Self-employed
 
Counting Technique, Permutation, Combination
Counting Technique, Permutation, CombinationCounting Technique, Permutation, Combination
Counting Technique, Permutation, CombinationChie Pegollo
 
Nonparametric tests
Nonparametric testsNonparametric tests
Nonparametric testsArun Kumar
 
Parametric and non parametric test
Parametric and non parametric testParametric and non parametric test
Parametric and non parametric testAjay Malpani
 
Lesson Plan- Measures of Central tendency of Data
Lesson Plan- Measures of Central tendency of DataLesson Plan- Measures of Central tendency of Data
Lesson Plan- Measures of Central tendency of DataElton John Embodo
 
Parametric vs Nonparametric Tests: When to use which
Parametric vs Nonparametric Tests: When to use whichParametric vs Nonparametric Tests: When to use which
Parametric vs Nonparametric Tests: When to use whichGönenç Dalgıç
 
Measure OF Central Tendency
Measure OF Central TendencyMeasure OF Central Tendency
Measure OF Central TendencyIqrabutt038
 
Graphical Representation of data
Graphical Representation of dataGraphical Representation of data
Graphical Representation of dataJijo K Mathew
 
Application of Biostatistics
Application of BiostatisticsApplication of Biostatistics
Application of BiostatisticsJippy Jack
 

En vedette (20)

Mean, Median, Mode: Measures of Central Tendency
Mean, Median, Mode: Measures of Central Tendency Mean, Median, Mode: Measures of Central Tendency
Mean, Median, Mode: Measures of Central Tendency
 
Measures of central tendency
Measures of central tendencyMeasures of central tendency
Measures of central tendency
 
Counting techniques
Counting techniquesCounting techniques
Counting techniques
 
Presentationofdatamod6b
Presentationofdatamod6bPresentationofdatamod6b
Presentationofdatamod6b
 
Measurement in social science research
Measurement in social science research Measurement in social science research
Measurement in social science research
 
Berd 5-6
Berd 5-6Berd 5-6
Berd 5-6
 
Simple understanding of biostatistics
Simple understanding of biostatisticsSimple understanding of biostatistics
Simple understanding of biostatistics
 
Use of Statistics in real life
Use of Statistics in real lifeUse of Statistics in real life
Use of Statistics in real life
 
Measures of dispersion
Measures of dispersion Measures of dispersion
Measures of dispersion
 
Counting Technique, Permutation, Combination
Counting Technique, Permutation, CombinationCounting Technique, Permutation, Combination
Counting Technique, Permutation, Combination
 
Nonparametric tests
Nonparametric testsNonparametric tests
Nonparametric tests
 
Non parametric tests
Non parametric testsNon parametric tests
Non parametric tests
 
Parametric and non parametric test
Parametric and non parametric testParametric and non parametric test
Parametric and non parametric test
 
Normal distribution stat
Normal distribution statNormal distribution stat
Normal distribution stat
 
Lesson Plan- Measures of Central tendency of Data
Lesson Plan- Measures of Central tendency of DataLesson Plan- Measures of Central tendency of Data
Lesson Plan- Measures of Central tendency of Data
 
Parametric vs Nonparametric Tests: When to use which
Parametric vs Nonparametric Tests: When to use whichParametric vs Nonparametric Tests: When to use which
Parametric vs Nonparametric Tests: When to use which
 
Non-Parametric Tests
Non-Parametric TestsNon-Parametric Tests
Non-Parametric Tests
 
Measure OF Central Tendency
Measure OF Central TendencyMeasure OF Central Tendency
Measure OF Central Tendency
 
Graphical Representation of data
Graphical Representation of dataGraphical Representation of data
Graphical Representation of data
 
Application of Biostatistics
Application of BiostatisticsApplication of Biostatistics
Application of Biostatistics
 

Similaire à Module 3

1) Minimum 10 full pages (No word count per page)- Follow the 3 x
1) Minimum 10 full pages (No word count per page)- Follow the 3 x 1) Minimum 10 full pages (No word count per page)- Follow the 3 x
1) Minimum 10 full pages (No word count per page)- Follow the 3 x AbbyWhyte974
 
1) Minimum 10 full pages (No word count per page)- Follow the 3 x
1) Minimum 10 full pages (No word count per page)- Follow the 3 x 1) Minimum 10 full pages (No word count per page)- Follow the 3 x
1) Minimum 10 full pages (No word count per page)- Follow the 3 x MartineMccracken314
 
Stat11t Chapter1
Stat11t Chapter1Stat11t Chapter1
Stat11t Chapter1gueste87a4f
 
12Levels of MeasurementNameInstitutional
12Levels of MeasurementNameInstitutional12Levels of MeasurementNameInstitutional
12Levels of MeasurementNameInstitutionalEttaBenton28
 
12Levels of MeasurementNameInstitutional
12Levels of MeasurementNameInstitutional12Levels of MeasurementNameInstitutional
12Levels of MeasurementNameInstitutionalChantellPantoja184
 
Identify the types of graphsand statistics that areappropr
Identify the types of graphsand statistics that areapproprIdentify the types of graphsand statistics that areappropr
Identify the types of graphsand statistics that areapproprMalikPinckney86
 
Meaning and Importance of Statistics
Meaning and Importance of StatisticsMeaning and Importance of Statistics
Meaning and Importance of StatisticsFlipped Channel
 
Impact of Medication Administration Errors on Leukemia.docx
Impact of Medication Administration Errors on Leukemia.docxImpact of Medication Administration Errors on Leukemia.docx
Impact of Medication Administration Errors on Leukemia.docxstudywriters
 
1. week 1
1. week 11. week 1
1. week 1renz50
 
what is statistics? Mc Graw Hills/Irwin
what is statistics? Mc Graw Hills/Irwinwhat is statistics? Mc Graw Hills/Irwin
what is statistics? Mc Graw Hills/IrwinMaryam Xahra
 
Class lecture notes # 2 (statistics for research)
Class lecture notes # 2 (statistics for research)Class lecture notes # 2 (statistics for research)
Class lecture notes # 2 (statistics for research)Harve Abella
 
Statistics for Managers notes.pdf
Statistics for Managers notes.pdfStatistics for Managers notes.pdf
Statistics for Managers notes.pdfVelujv
 
Introduce Statistics ppt
Introduce Statistics pptIntroduce Statistics ppt
Introduce Statistics pptJustynOwen
 
Statistics / Quantitative Techniques Study Material
Statistics / Quantitative Techniques Study MaterialStatistics / Quantitative Techniques Study Material
Statistics / Quantitative Techniques Study MaterialPrabal Chakraborty
 

Similaire à Module 3 (20)

Lecture notes on STS 102
Lecture notes on STS 102Lecture notes on STS 102
Lecture notes on STS 102
 
1) Minimum 10 full pages (No word count per page)- Follow the 3 x
1) Minimum 10 full pages (No word count per page)- Follow the 3 x 1) Minimum 10 full pages (No word count per page)- Follow the 3 x
1) Minimum 10 full pages (No word count per page)- Follow the 3 x
 
1) Minimum 10 full pages (No word count per page)- Follow the 3 x
1) Minimum 10 full pages (No word count per page)- Follow the 3 x 1) Minimum 10 full pages (No word count per page)- Follow the 3 x
1) Minimum 10 full pages (No word count per page)- Follow the 3 x
 
Brm unit iii - cheet sheet
Brm   unit iii - cheet sheetBrm   unit iii - cheet sheet
Brm unit iii - cheet sheet
 
Statistics Exericse 29
Statistics Exericse 29Statistics Exericse 29
Statistics Exericse 29
 
Stat11t chapter1
Stat11t chapter1Stat11t chapter1
Stat11t chapter1
 
Stat11t Chapter1
Stat11t Chapter1Stat11t Chapter1
Stat11t Chapter1
 
12Levels of MeasurementNameInstitutional
12Levels of MeasurementNameInstitutional12Levels of MeasurementNameInstitutional
12Levels of MeasurementNameInstitutional
 
12Levels of MeasurementNameInstitutional
12Levels of MeasurementNameInstitutional12Levels of MeasurementNameInstitutional
12Levels of MeasurementNameInstitutional
 
Identify the types of graphsand statistics that areappropr
Identify the types of graphsand statistics that areapproprIdentify the types of graphsand statistics that areappropr
Identify the types of graphsand statistics that areappropr
 
Meaning and Importance of Statistics
Meaning and Importance of StatisticsMeaning and Importance of Statistics
Meaning and Importance of Statistics
 
Impact of Medication Administration Errors on Leukemia.docx
Impact of Medication Administration Errors on Leukemia.docxImpact of Medication Administration Errors on Leukemia.docx
Impact of Medication Administration Errors on Leukemia.docx
 
1. week 1
1. week 11. week 1
1. week 1
 
what is statistics? Mc Graw Hills/Irwin
what is statistics? Mc Graw Hills/Irwinwhat is statistics? Mc Graw Hills/Irwin
what is statistics? Mc Graw Hills/Irwin
 
Chap001
Chap001Chap001
Chap001
 
Class lecture notes # 2 (statistics for research)
Class lecture notes # 2 (statistics for research)Class lecture notes # 2 (statistics for research)
Class lecture notes # 2 (statistics for research)
 
Statistics for Managers notes.pdf
Statistics for Managers notes.pdfStatistics for Managers notes.pdf
Statistics for Managers notes.pdf
 
Windshield survey
Windshield surveyWindshield survey
Windshield survey
 
Introduce Statistics ppt
Introduce Statistics pptIntroduce Statistics ppt
Introduce Statistics ppt
 
Statistics / Quantitative Techniques Study Material
Statistics / Quantitative Techniques Study MaterialStatistics / Quantitative Techniques Study Material
Statistics / Quantitative Techniques Study Material
 

Plus de Chie Pegollo

Plus de Chie Pegollo (11)

Sampling techniquesmod5
Sampling techniquesmod5Sampling techniquesmod5
Sampling techniquesmod5
 
Measuresofcentraltendencygrpdata
MeasuresofcentraltendencygrpdataMeasuresofcentraltendencygrpdata
Measuresofcentraltendencygrpdata
 
Presentationofdatamod6b
Presentationofdatamod6bPresentationofdatamod6b
Presentationofdatamod6b
 
presentation of data
presentation of datapresentation of data
presentation of data
 
Data gathering
Data gatheringData gathering
Data gathering
 
Abuses of statistics
Abuses of statisticsAbuses of statistics
Abuses of statistics
 
Abuses Of Statistics
Abuses Of StatisticsAbuses Of Statistics
Abuses Of Statistics
 
 
Module 2
Module 2Module 2
Module 2
 
Basic Statistics
Basic  StatisticsBasic  Statistics
Basic Statistics
 
Basic statistics
Basic statisticsBasic statistics
Basic statistics
 

Dernier

CNv6 Instructor Chapter 6 Quality of Service
CNv6 Instructor Chapter 6 Quality of ServiceCNv6 Instructor Chapter 6 Quality of Service
CNv6 Instructor Chapter 6 Quality of Servicegiselly40
 
TrustArc Webinar - Stay Ahead of US State Data Privacy Law Developments
TrustArc Webinar - Stay Ahead of US State Data Privacy Law DevelopmentsTrustArc Webinar - Stay Ahead of US State Data Privacy Law Developments
TrustArc Webinar - Stay Ahead of US State Data Privacy Law DevelopmentsTrustArc
 
Raspberry Pi 5: Challenges and Solutions in Bringing up an OpenGL/Vulkan Driv...
Raspberry Pi 5: Challenges and Solutions in Bringing up an OpenGL/Vulkan Driv...Raspberry Pi 5: Challenges and Solutions in Bringing up an OpenGL/Vulkan Driv...
Raspberry Pi 5: Challenges and Solutions in Bringing up an OpenGL/Vulkan Driv...Igalia
 
Understanding Discord NSFW Servers A Guide for Responsible Users.pdf
Understanding Discord NSFW Servers A Guide for Responsible Users.pdfUnderstanding Discord NSFW Servers A Guide for Responsible Users.pdf
Understanding Discord NSFW Servers A Guide for Responsible Users.pdfUK Journal
 
EIS-Webinar-Prompt-Knowledge-Eng-2024-04-08.pptx
EIS-Webinar-Prompt-Knowledge-Eng-2024-04-08.pptxEIS-Webinar-Prompt-Knowledge-Eng-2024-04-08.pptx
EIS-Webinar-Prompt-Knowledge-Eng-2024-04-08.pptxEarley Information Science
 
Bajaj Allianz Life Insurance Company - Insurer Innovation Award 2024
Bajaj Allianz Life Insurance Company - Insurer Innovation Award 2024Bajaj Allianz Life Insurance Company - Insurer Innovation Award 2024
Bajaj Allianz Life Insurance Company - Insurer Innovation Award 2024The Digital Insurer
 
Histor y of HAM Radio presentation slide
Histor y of HAM Radio presentation slideHistor y of HAM Radio presentation slide
Histor y of HAM Radio presentation slidevu2urc
 
Slack Application Development 101 Slides
Slack Application Development 101 SlidesSlack Application Development 101 Slides
Slack Application Development 101 Slidespraypatel2
 
2024: Domino Containers - The Next Step. News from the Domino Container commu...
2024: Domino Containers - The Next Step. News from the Domino Container commu...2024: Domino Containers - The Next Step. News from the Domino Container commu...
2024: Domino Containers - The Next Step. News from the Domino Container commu...Martijn de Jong
 
🐬 The future of MySQL is Postgres 🐘
🐬  The future of MySQL is Postgres   🐘🐬  The future of MySQL is Postgres   🐘
🐬 The future of MySQL is Postgres 🐘RTylerCroy
 
Breaking the Kubernetes Kill Chain: Host Path Mount
Breaking the Kubernetes Kill Chain: Host Path MountBreaking the Kubernetes Kill Chain: Host Path Mount
Breaking the Kubernetes Kill Chain: Host Path MountPuma Security, LLC
 
Exploring the Future Potential of AI-Enabled Smartphone Processors
Exploring the Future Potential of AI-Enabled Smartphone ProcessorsExploring the Future Potential of AI-Enabled Smartphone Processors
Exploring the Future Potential of AI-Enabled Smartphone Processorsdebabhi2
 
Scaling API-first – The story of a global engineering organization
Scaling API-first – The story of a global engineering organizationScaling API-first – The story of a global engineering organization
Scaling API-first – The story of a global engineering organizationRadu Cotescu
 
Axa Assurance Maroc - Insurer Innovation Award 2024
Axa Assurance Maroc - Insurer Innovation Award 2024Axa Assurance Maroc - Insurer Innovation Award 2024
Axa Assurance Maroc - Insurer Innovation Award 2024The Digital Insurer
 
Driving Behavioral Change for Information Management through Data-Driven Gree...
Driving Behavioral Change for Information Management through Data-Driven Gree...Driving Behavioral Change for Information Management through Data-Driven Gree...
Driving Behavioral Change for Information Management through Data-Driven Gree...Enterprise Knowledge
 
Handwritten Text Recognition for manuscripts and early printed texts
Handwritten Text Recognition for manuscripts and early printed textsHandwritten Text Recognition for manuscripts and early printed texts
Handwritten Text Recognition for manuscripts and early printed textsMaria Levchenko
 
Finology Group – Insurtech Innovation Award 2024
Finology Group – Insurtech Innovation Award 2024Finology Group – Insurtech Innovation Award 2024
Finology Group – Insurtech Innovation Award 2024The Digital Insurer
 
08448380779 Call Girls In Civil Lines Women Seeking Men
08448380779 Call Girls In Civil Lines Women Seeking Men08448380779 Call Girls In Civil Lines Women Seeking Men
08448380779 Call Girls In Civil Lines Women Seeking MenDelhi Call girls
 
Artificial Intelligence: Facts and Myths
Artificial Intelligence: Facts and MythsArtificial Intelligence: Facts and Myths
Artificial Intelligence: Facts and MythsJoaquim Jorge
 
Powerful Google developer tools for immediate impact! (2023-24 C)
Powerful Google developer tools for immediate impact! (2023-24 C)Powerful Google developer tools for immediate impact! (2023-24 C)
Powerful Google developer tools for immediate impact! (2023-24 C)wesley chun
 

Dernier (20)

CNv6 Instructor Chapter 6 Quality of Service
CNv6 Instructor Chapter 6 Quality of ServiceCNv6 Instructor Chapter 6 Quality of Service
CNv6 Instructor Chapter 6 Quality of Service
 
TrustArc Webinar - Stay Ahead of US State Data Privacy Law Developments
TrustArc Webinar - Stay Ahead of US State Data Privacy Law DevelopmentsTrustArc Webinar - Stay Ahead of US State Data Privacy Law Developments
TrustArc Webinar - Stay Ahead of US State Data Privacy Law Developments
 
Raspberry Pi 5: Challenges and Solutions in Bringing up an OpenGL/Vulkan Driv...
Raspberry Pi 5: Challenges and Solutions in Bringing up an OpenGL/Vulkan Driv...Raspberry Pi 5: Challenges and Solutions in Bringing up an OpenGL/Vulkan Driv...
Raspberry Pi 5: Challenges and Solutions in Bringing up an OpenGL/Vulkan Driv...
 
Understanding Discord NSFW Servers A Guide for Responsible Users.pdf
Understanding Discord NSFW Servers A Guide for Responsible Users.pdfUnderstanding Discord NSFW Servers A Guide for Responsible Users.pdf
Understanding Discord NSFW Servers A Guide for Responsible Users.pdf
 
EIS-Webinar-Prompt-Knowledge-Eng-2024-04-08.pptx
EIS-Webinar-Prompt-Knowledge-Eng-2024-04-08.pptxEIS-Webinar-Prompt-Knowledge-Eng-2024-04-08.pptx
EIS-Webinar-Prompt-Knowledge-Eng-2024-04-08.pptx
 
Bajaj Allianz Life Insurance Company - Insurer Innovation Award 2024
Bajaj Allianz Life Insurance Company - Insurer Innovation Award 2024Bajaj Allianz Life Insurance Company - Insurer Innovation Award 2024
Bajaj Allianz Life Insurance Company - Insurer Innovation Award 2024
 
Histor y of HAM Radio presentation slide
Histor y of HAM Radio presentation slideHistor y of HAM Radio presentation slide
Histor y of HAM Radio presentation slide
 
Slack Application Development 101 Slides
Slack Application Development 101 SlidesSlack Application Development 101 Slides
Slack Application Development 101 Slides
 
2024: Domino Containers - The Next Step. News from the Domino Container commu...
2024: Domino Containers - The Next Step. News from the Domino Container commu...2024: Domino Containers - The Next Step. News from the Domino Container commu...
2024: Domino Containers - The Next Step. News from the Domino Container commu...
 
🐬 The future of MySQL is Postgres 🐘
🐬  The future of MySQL is Postgres   🐘🐬  The future of MySQL is Postgres   🐘
🐬 The future of MySQL is Postgres 🐘
 
Breaking the Kubernetes Kill Chain: Host Path Mount
Breaking the Kubernetes Kill Chain: Host Path MountBreaking the Kubernetes Kill Chain: Host Path Mount
Breaking the Kubernetes Kill Chain: Host Path Mount
 
Exploring the Future Potential of AI-Enabled Smartphone Processors
Exploring the Future Potential of AI-Enabled Smartphone ProcessorsExploring the Future Potential of AI-Enabled Smartphone Processors
Exploring the Future Potential of AI-Enabled Smartphone Processors
 
Scaling API-first – The story of a global engineering organization
Scaling API-first – The story of a global engineering organizationScaling API-first – The story of a global engineering organization
Scaling API-first – The story of a global engineering organization
 
Axa Assurance Maroc - Insurer Innovation Award 2024
Axa Assurance Maroc - Insurer Innovation Award 2024Axa Assurance Maroc - Insurer Innovation Award 2024
Axa Assurance Maroc - Insurer Innovation Award 2024
 
Driving Behavioral Change for Information Management through Data-Driven Gree...
Driving Behavioral Change for Information Management through Data-Driven Gree...Driving Behavioral Change for Information Management through Data-Driven Gree...
Driving Behavioral Change for Information Management through Data-Driven Gree...
 
Handwritten Text Recognition for manuscripts and early printed texts
Handwritten Text Recognition for manuscripts and early printed textsHandwritten Text Recognition for manuscripts and early printed texts
Handwritten Text Recognition for manuscripts and early printed texts
 
Finology Group – Insurtech Innovation Award 2024
Finology Group – Insurtech Innovation Award 2024Finology Group – Insurtech Innovation Award 2024
Finology Group – Insurtech Innovation Award 2024
 
08448380779 Call Girls In Civil Lines Women Seeking Men
08448380779 Call Girls In Civil Lines Women Seeking Men08448380779 Call Girls In Civil Lines Women Seeking Men
08448380779 Call Girls In Civil Lines Women Seeking Men
 
Artificial Intelligence: Facts and Myths
Artificial Intelligence: Facts and MythsArtificial Intelligence: Facts and Myths
Artificial Intelligence: Facts and Myths
 
Powerful Google developer tools for immediate impact! (2023-24 C)
Powerful Google developer tools for immediate impact! (2023-24 C)Powerful Google developer tools for immediate impact! (2023-24 C)
Powerful Google developer tools for immediate impact! (2023-24 C)
 

Module 3

  • 1. Basic Statistics 2011 Module 3  Levels of Measurement  Uses and Applications of Statistics Objectives: At the end of the module, the students are expected to: 1. Identify the level of measurement the data belong. 2. Realize the uses and application of Statistics in real life. Levels of Measurement 1. NOMINAL LEVEL – characterized by data that consists of names, labels, or categories only. In this level, we can only say that one object is different from another, but the amount of difference between them cannot be determined. Example: Survey responses of yes, no, and undecided Genders of students in the Statistics class School Clubs where each SciTech student belongs 2. ORDINAL LEVEL – involves data that may be arranged in some order or rank. Difference between data values cannot be determined or are meaningless. Example: Shirt sizes of S, M, or L Honor ranks of students: 1st, 2nd, and 3rd Grading system involving letters (A, B, C, D, and F) 3. INTERVAL LEVEL – involves data where amount of difference between figures can be determined. Data at this level may lack an inherent zero starting point. Example: Temperature 4. RATIO LEVEL - absolute zero value is meaningful. Example: Area, height, weight Read more on: http://www.socialresearchmethods.net/kb/measlevl.php SRSTHS 1
  • 2. Basic Statistics 2011 A. Classify the following variables/data as to whether they are qualitative (QL) or quantitative (QN). Write also the level of measurement whether nominal (N), ordinal (O), interval (I), or ratio (R). QN/QL Level/Scale 1. Color of the eye 2. Number of books in the library 3. Position in the company 4. Number of students enrolled in StaRSci 5. Student ID Number 6. Age 7. Rank of Students 8. Temperature in Santa Rosa 9. Number of votes 10. Religion B. Identify the level of dependent variable measurement (nominal, ordinal, interval, or ratio) implied by the statement. 1. You asked congressmen if the money they have received from PACs is more than $100,000, between $50,000 and $100,000, or less than $50,000. 2. You asked congress about the primary source of their PAC money: Labor unions, corporations, medical associations, or civil rights groups. 3. You checked the congressional record to see how many times in the past year each congressman was absent from a roll call vote. 4. You asked people on the street to rate their own congressman on a 1 - 7 Likert scale. 5. You asked congressmen to indicate whether they are Republican, Democrat, or Independent. 6. You asked people on the street to rate their own congressman as very liberal, slightly liberal, moderate, slightly conservative or very conservative. 7. You asked each congressman how many years s/he had been in congress. 8. You asked congressmen: Of the following issues, rank order the top three in importance: gas prices, war in Iraq, war in Afghanistan, urban crime, domestic poverty, subprime mortgage crisis. Source: http://www.brainmass.com/homework-help/business/business-analysis/255911 SRSTHS 2
  • 3. Basic Statistics 2011 Level of Measurement Practice Exercises online http://courses.csusm.edu/soc201kb/exercises.htm Uses and Application of Statistics Statistics plays a vital role in many fields of human activity. The applications of statistics have grown so that practically every field of study now benefits in some way from the use of statistical methods. Statistics helps in determining the existing position of per capita income, unemployment, population growth rate, housing, schooling, and medical facilities in a country. Manufacturers provide better products at lower costs through the use of statistical quality control techniques. Diseases are controlled through analyses designed to anticipate epidemics. Endangered species of fish and other wildlife are protected through regulations and laws that react to statistical estimates of changing population sizes. By pointing to lower fatality rates, legislators can better justify laws such as those governing air pollution, auto inspections, seat belt and air bag use, and drunk driving. There are a lot more examples but that will be left for you to discover. More information in: http://www.emathzone.com/tutorials/basic-statistics/functions-or-uses-of-statistics.html http://www.emathzone.com/tutorials/basic-statistics/importance-of-statistics-in-different-fields.html http://www.scribd.com/doc/3530536/Applications-of-Statistics http://www.stat.auckland.ac.nz/~wild/ChanceEnc/Ch01.usesstat.pdf Abuses of Statistics As educated and responsible member of society, you should hone your ability to recognize distorted statistical data and learn to interpret undistorted data intelligently. You should be aware and critical to misleading and deceptive claims, such as those commonly associated with polls, graphs, and averages. More examples on: http://www.econoclass.com/misleadingstats.html http://faculty.atu.edu/mfinan/2043/section31.pdf SRSTHS 3
  • 4. Basic Statistics 2011 Assignment: 1. Why do students like you need to study Statistics? 2. Watch TV tonight or read the newspaper. Identify at least three commercials, shows, or segments which mentioned some kind of statistics. (example: the text poll in TV Patrol which asked “Do you think Pacquiao deserved his victory?”) 3. What profession do you intend to pursue after high school? How do you think can Statistics be used in the field of your interest? Enumerate applications of statistics to your field of interest. 4. Who do you think can benefit from the statistics given below? How can it be useful to them? SRSTHS 4