Team 16 business plan submission (financial appendix)
1. Key Assumption
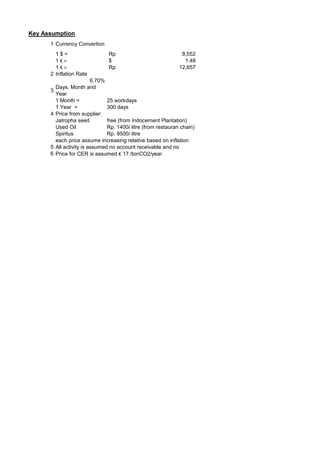
1 Currency Convertion
1$= Rp 8,552
1€= $ 1.48
1€= Rp 12,657
2 Inflation Rate
6.70%
Days, Month and
3
Year
1 Month = 25 workdays
1 Year = 300 days
4 Price from supplier:
Jatropha seed free (from Indocement Plantation)
Used Oil Rp. 1400/ litre (from restauran chain)
Spiritus Rp. 9500/ litre
each price assume increasing relative based on inflation
5 All activity is assumed no account receivable and no
6 Price for CER is assumed € 17 /tonCO2/year
2. 1$= Rp 8,552
1€= $ 1.48
1€= Rp 12,657
Initial Fee per CDM Project € 75,000 = $ 111,000 =
0 1 2 3
Baseline Emission 1,610 1,610 1,610
Project Emission 0 0 0
Leakage 0 0 0
Emission Reduction 1,610 1,610 1,610
Baseline emission
Household 2,146
CO2 dari penggunaan minyak tanah per keluarga 0.75 ton/CO2 per year
= 300
emission per year 1,610 ton CO2
Project Emission
Luas lahan Jathropa 170 ha = 1,700,000
hasil per m2 0.19 liter/year
Total hasil plant oil 321,970 liter/year
Penggunaan per kepala keluarga per tahun 150 liter/year
Jumlah kepala keluarga yang dapat disupplai 2,146 kepala keluarga
Emission per year 0.00
kebutuhan untuk :
321,970
321,970
321,970
Protos User 1,600 3,300 5,000 6,500
Fuel Suplly needs 240,000 495,000 750,000 975,000
Used Oil needs 300,000 350,000 428,030 653,030
Spiritus requirement/week/household 0.7 litre
Spiritus needs 58,240 120,120 182,000 236,600
3. Rp 949,272,000
4 5
1,610 1,610 tonCO2 per year
0 0 tonCO2 per year
0 0 tonCO2 per year
1,610 1,610 tonCO2 per year
lt/year
m2
8,000
1,200,000 liter/year
878,030 liter/year
291,200 litre/year
7. 1$= Rp 8,552
1€= $ 1.48
1€= Rp 12,657
Initial Fee per CDM Project € 75,000
0
Baseline Emission
Project Emission
Leakage
Emission Reduction
used oil 100 lt
gassoline 1 lt
biodiesel 1 lt
used oil (100%) 1 lt
Suplly needs
Used oil Capacity
Leakage: jarak ke majalengka dari citeureup
(per hari) 120
Total jarak tempuh per tahun 36,000
gassoline
Leakage from program 7
8. = $ 111,000 = Rp 949,272,000
Year
1 2 3 4 5
690 805 984 1,502 2,019 tonCO2 per year
150 175 214 326 438 tonCO2 per year
7 10 15 23 35 tonCO2 per year
533 620 755 1,153 1,547 tonCO2 per year
= 80 biodiesel (liters)
= 2.3 kg CO2
= 0.4991 kg CO2
= 0 kg CO2
240,000 495,000 750,000 975,000 1,200,000 1,200,000 (Lt/year)
300,000 350,000 428,030 653,030 878,030 878,030 (Lt/year)
km
km
1 km = 0.19 kg CO2
ton CO2
10. 05-05-11
Biokraftstoffe 1$ = 8,552 Rp Notes
10:36 PM
Cost of Revenues inflasi = 6.70%
Years 1 to 5 € 1.00 = $ 1.48
(Rp) € 1.00 = 12,657 Rp
Year 1 Year 2 Year 3 Year 4 Year 5
Revenue 3,283,344,080 4,922,532,936 6,477,684,815 8,694,956,965 11,185,660,347
Cost of Revenue
Protos 42,760
COGM per Unit ($) 50 50 50 50 50
COGM per Unit (Rp) 427,600 427,600 427,600 427,600 427,600
Discount for retail/cooperative ($) 3 3 3 3 3
Discount for retail/cooperative (Rp) 25,656 25,656 25,656 25,656 25,656
Subsidy for user per Unit ($) 15 15 15 15 15
Subsidy for user per Unit (Rp) 128,280 128,280 128,280 128,280 128,280
Transportation cost per unit 200 213 228 0 0
Total Direct Costs per Unit (Rp) 581,736 581,749 581,764 581,536 581,536
Unit Sales 1,600 1,700 1,700 1,500 1,500
Total Direct Costs 930,777,600 988,973,980 988,998,286 872,304,000 872,304,000
% of Revenue 28.35% 20.09% 15.27% 10.03% 7.80%
Gross margin -240% -240% -240% -240% -240%
Jatropha Oil
Price of Jatropha seed from partner 0 0 0 0 0
Processing & Transportation Cost per unit 1,500 1,601 1,708 1,822 1,944
Total Direct Costs per Unit 1,500 1,601 1,708 1,822 1,944
Unit Sales 321,970 321,970 321,970 321,970 321,970
Total Direct Costs 482,954,545 515,312,500 549,838,438 586,677,613 625,985,013
% of Revenue 14.71% 10.47% 8.49% 6.75% 5.60%
Gross margin 57.14% 57.14% 57.14% 57.14% 57.14%
Used Oil
Price of Used Oil from source 1400 1494 1594 1701 1815
Transportation cost from source 200 213 228 243 259
Distribution cost to buyer & consumen 200 213 228 243 259
Filtering cost 10 11 11 12 13
Total Direct Costs per Unit 1810 1931 2061 2199 2346
Unit Sales 300,000 350,000 428,030 653,030 878,030
Total Direct Costs 543,000,000 675,944,500 882,027,103 1,435,837,090 2,059,898,196
% of Revenue 16.54% 13.73% 13.62% 16.51% 18.42%
Gross margin 48.29% 48.29% 48.29% 48.29% 48.29%
Spiritus
Price from supplier 9,500 10,137 10,816 11,540 12,313
Distribution cost 200 213 228 243 259
Total Direct Costs per Unit 9,700 10,350 11,043 11,783 12,573
Unit Sales 58,240 120,120 182,000 236,600 291,200
Total Direct Costs 564,928,000 1,243,229,988 2,009,888,481 2,787,916,311 3,661,177,482
% of Revenue 17.21% 25.26% 31.03% 32.06% 32.73%
Gross margin 3.00% 3.00% 3.00% 3.00% 3.00%
CDM Project
Auditor fee ($) 20,000 20,000 20,000 20,000
Auditor fee (Rp) 171,040,000 171,040,000 171,040,000 171,040,000
Total CDM Project Cost 0 171,040,000 171,040,000 171,040,000 171,040,000
All other costs % of Revenue 0.5% 16,416,720 24,612,665 32,388,424 43,474,785 55,928,302
Total Cost of Revenues 2,538,076,866 3,619,113,633 4,634,180,731 5,897,249,799 7,446,332,993
% of Revenue 77.3% 73.5% 71.5% 67.8% 66.6%
Cost of Revenues by Months & Quarters
(Rp)
Year 1 Year 2 Year 3 Year 4 Year 5
Month 1 195,377,035 250,090,244 319,032,844 411,243,677 525,618,942
Month 2 195,377,035 250,090,244 319,032,844 411,243,677 525,618,942
Month 3 195,377,035 250,090,244 319,032,844 411,243,677 525,618,942
Total 1st Quarter 586,131,106 750,270,731 957,098,531 1,233,731,030 1,576,856,825
Month 4 195,377,035 250,090,244 319,032,844 411,243,677 525,618,942
Month 5 195,377,035 250,090,244 319,032,844 411,243,677 525,618,942
Month 6 195,377,035 250,090,244 319,032,844 411,243,677 525,618,942
Total 2nd Quarter 586,131,106 750,270,731 957,098,531 1,233,731,030 1,576,856,825
Month 7 195,377,035 250,090,244 319,032,844 411,243,677 525,618,942
Month 8 195,377,035 250,090,244 319,032,844 411,243,677 525,618,942
Month 9 195,377,035 250,090,244 319,032,844 411,243,677 525,618,942
Total 3rd Quarter 586,131,106 750,270,731 957,098,531 1,233,731,030 1,576,856,825
Month 10 195,377,035 250,090,244 319,032,844 411,243,677 525,618,942
Month 11 195,377,035 250,090,244 319,032,844 411,243,677 525,618,942
Month 12 388,929,479 868,120,951 1,124,819,449 1,373,569,357 1,664,524,634
Total 4th Quarter 779,683,549 1,368,301,438 1,762,885,137 2,196,056,710 2,715,762,518
Total for year 2,538,076,866 3,619,113,633 4,634,180,731 5,897,249,799 7,446,332,993
11. 05-05-11
Biokraftstoffe 1 $ = 8,552 Rp Notes 10:36 PM
Operating Expenses inflasi = 6.70%
Years 1 to 5 € 1.00 = $ 1.48
(Rp) € 1.00 = 12,657 Rp
Year 1 Year 2 Year 3 Year 4 Year 5
Net Revenues 3,283,344,080 4,922,532,936 6,477,684,815 8,694,956,965 11,185,660,347 Activities Year 1 Year 2 Year 3 Year 4 Year 5
Promotion Activities 58,293,360 60,693,360 60,693,360 55,893,360 55,893,360
Sales & Marketing Marketing tools 2,940,000 2,940,000 2,940,000 2,940,000 2,940,000
Drivers Training for Trainers 900,000 900,000 900,000 900,000 900,000
Salaries and Benefits 118,800,000 126,759,600 135,252,493 144,314,410 153,983,476 Total 62,133,360 64,533,360 64,533,360 59,733,360 59,733,360
Commissions % of Revenue 5.00% 164,167,204 246,126,647 323,884,241 434,747,848 559,283,017
Promotion Activities 58,293,360 60,693,360 60,693,360 55,893,360 55,893,360
Marketing Tools 2,940,000 2,940,000 2,940,000 2,940,000 2,940,000
Training for Trainer 900,000 900,000 900,000 900,000 900,000
Total Sales and Marketing 345,100,564 437,419,607 523,670,094 638,795,619 772,999,853
% of Revenue 10.5% 8.9% 8.1% 7.3% 6.9%
General, Operational & Administration
Drivers Promotion Activity YEAR 1
Salaries and Benefits 423,450,000 451,821,150 490,802,608 523,686,383 568,688,973 Program Period Target buyers (per period) Target buyers (year) Jumlah
Depreciation 64,141,414 5,808,081 8,087,121 10,366,162 10,366,162 Bundling system
Every month 84 1008
Rent Office 60,000,000 64,020,000 68,309,340 72,886,066 77,769,432 82,979,984 With Regular promotion 40,320,000
Utilities 12,000,000 12,804,000 13,661,868 14,577,213 15,553,886 Cooking competition Every 6 month 25 50 2,000,000
Total General,Op & Administration 559,591,414 534,453,231 580,860,937 621,515,823 672,378,453 Food bazaar in Independence day Once a year 50 50 4,300,000
% of Revenue 17.0% 10.9% 9.0% 7.1% 6.0% Microfinance program Every 4 month 132 396 9,504,000
Membership Every month 3 36 630,000
All other expenses % of Revenue 0.50% 16,416,720 24,612,665 32,388,424 43,474,785 55,928,302 Member get Member Every month 5 60 1,539,360
Total Operating Expenses 921,108,699 996,485,502 1,136,919,455 1,303,786,227 1,501,306,608 TOTAL NUMBER OF BUYERS YEAR 1 1600 buyers 58,293,360
% of Revenue 28.1% 20.2% 17.6% 15.0% 13.4% YEAR 2
Program Period Target buyers (per period) Target buyers (year) Jumlah
Allocation of Operating Expenses between: Bundling system Every month 84 1008 40,320,000
Variable 781,127,284 910,013,421 1,043,021,126 1,202,116,786 1,393,777,128 With Regular promotion
% of Total Operating Expense 85.16% 91.68% 92.05% 92.47% 93.08% Cooking competition Every 6 month 25 50 2,000,000
Fixed 136,141,414 82,632,081 90,058,329 97,829,441 103,689,480 Food bazaar in Independence day Once a year 50 50 4,300,000
% of Total Operating Expense 14.84% 8.32% 7.95% 7.53% 6.92% Microfinance program Every 4 month 165 496 11,904,000
Total 917,268,699 992,645,502 1,133,079,455 1,299,946,227 1,497,466,608 Membership Every month 3 36 630,000
Member get Member Every month 5 60 1,539,360
TOTAL NUMBER OF BUYERS YEAR 2 1700 buyers
60,693,360
12. Sales & Marketing by Months & Quarters YEAR 3 05-05-11
10:36 PM
(Rp) Program Period Target buyers (per period) Target buyers (year) Jumlah
Year 1 Year 2 Year 3 Year 4 Year 5 Bundling system Every month 84 1008 40,320,000
Month 1 26,565,281 30,226,842 36,051,239 44,546,300 54,564,222 With Regular promotion
Month 2 26,565,281 30,226,842 36,051,239 44,546,300 54,564,222 Cooking competition Every 6 month 25 50 2,000,000
Month 3 26,565,281 30,226,842 36,051,239 44,546,300 54,564,222 Food bazaar in Independence day Once a year 50 50 4,300,000
Total 1st Quarter 79,695,843 90,680,526 108,153,718 133,638,900 163,692,665 Microfinance program Every 4 month 165 496 11,904,000
Month 4 26,565,281 30,226,842 36,051,239 44,546,300 54,564,222 Membership Every month 3 36 630,000
Month 5 26,565,281 30,226,842 36,051,239 44,546,300 54,564,222 Member get Member Every month 5 60 1,539,360
TOTAL NUMBER OF BUYERS YEAR 3 1700 buyers
Month 6 26,565,281 30,226,842 36,051,239 44,546,300 54,564,222 60,693,360
Total 2nd Quarter 79,695,843 90,680,526 108,153,718 133,638,900 163,692,665 YEAR 4
Month 7 26,565,281 30,226,842 36,051,239 44,546,300 54,564,222 Program Period Target buyers (per period) Target buyers (year) Jumlah
Month 8 26,565,281 30,226,842 36,051,239 44,546,300 54,564,222 Bundling system Every month 84 1008 40,320,000
Month 9 26,565,281 30,226,842 36,051,239 44,546,300 54,564,222 With Regular promotion
Total 3rd Quarter 79,695,843 90,680,526 108,153,718 133,638,900 163,692,665 Cooking competition Every 6 month 25 50 2,000,000
Month 10 26,565,281 30,226,842 36,051,239 44,546,300 54,564,222 Food bazaar in Independence day Once a year 50 50 4,300,000
Month 11 26,565,281 30,226,842 36,051,239 44,546,300 54,564,222 Microfinance program Every 4 month 98 296 7,104,000
Month 12 52,882,473 104,924,344 127,106,460 148,786,319 172,793,414 Membership Every month 3 36 630,000
Total 4th Quarter 106,013,035 165,378,028 199,208,939 237,878,919 281,921,857 Member get Member Every month 5 60 1,539,360
TOTAL NUMBER OF BUYERS YEAR 3 1500 buyers
Total for year 345,100,564 437,419,607 523,670,094 638,795,619 772,999,853 55,893,360
YEAR 5
Program Period Target buyers (per period) Target buyers (year) Jumlah
General,Operational and Administrative by Months & Quarters Bundling system Every month 84 1008 40,320,000
(Rp) With Regular promotion
Year 1 Year 2 Year 3 Year 4 Year 5 Cooking competition Every 6 month 25 50 2,000,000
Month 1 43,076,438 36,932,120 39,988,453 43,341,297 47,461,596 Food bazaar in Independence day Once a year 50 50 4,300,000
Month 2 43,076,438 36,932,120 39,988,453 43,341,297 47,461,596 Microfinance program Every 4 month 98 296 7,104,000
Month 3 43,076,438 36,932,120 39,988,453 43,341,297 47,461,596 Membership Every month 3 36 630,000
Total 1st Quarter 129,229,315 110,796,360 119,965,358 130,023,890 142,384,789 Member get Member Every month 5 60 1,539,360
TOTAL NUMBER OF BUYERS YEAR 3 1500 buyers
Month 4 43,076,438 36,932,120 39,988,453 43,341,297 47,461,596 55,893,360
Month 5 43,076,438 36,932,120 39,988,453 43,341,297 47,461,596
Month 6 43,076,438 36,932,120 39,988,453 43,341,297 47,461,596
Total 2nd Quarter 129,229,315 110,796,360 119,965,358 130,023,890 142,384,789
Month 7 43,076,438 36,932,120 39,988,453 43,341,297 47,461,596
Month 8 43,076,438 36,932,120 39,988,453 43,341,297 47,461,596
Month 9 43,076,438 36,932,120 39,988,453 43,341,297 47,461,596
Total 3rd Quarter 129,229,315 110,796,360 119,965,358 130,023,890 142,384,789
Month 10 43,076,438 36,932,120 39,988,453 43,341,297 47,461,596
Month 11 43,076,438 36,932,120 39,988,453 43,341,297 47,461,596
Month 12 85,750,593 128,199,911 140,987,958 144,761,562 150,300,893
Total 4th Quarter 171,903,470 202,064,151 220,964,863 231,444,155 245,224,086
Total for year 559,591,414 534,453,231 580,860,937 621,515,823 672,378,453
13. 05-05-11
10:36 PM
Biokraftstoffe 1$ = 8,552 Rp Notes
Personnel inflasi = 6.70%
Years 1 to 5 € 1.00 = $ 1.48
(Rp) € 1.00 = 12,657 Rp
Year 1 Year 2 Year 3 Year 4 Year 5
Net Revenues 3,283,344,080 4,922,532,936 6,477,684,815 8,694,956,965 11,185,660,347
Sales & Marketing
Marketing Manager 36,000,000 38,412,000 40,985,604 43,731,639 46,661,659
Customer service 9,000,000 9,603,000 10,246,401 10,932,910 11,665,415
Tech support 18,000,000 19,206,000 20,492,802 21,865,820 23,330,830
Sales Person 45,000,000 48,015,000 51,232,005 54,664,549 58,327,074
Total Salary 108,000,000 115,236,000 122,956,812 131,194,918 139,984,978
Benefits
Percent (%) 10% 10% 10% 10% 10%
Total benefit costs 10,800,000 11,523,600 12,295,681 13,119,492 13,998,498
Total S & M Compensation 118,800,000 126,759,600 135,252,493 144,314,410 153,983,476
% of Revenue 3.6% 2.6% 2.1% 1.7% 1.4%
General & Administration
Chief Executive Officer 48,000,000 51,216,000 54,647,472 58,308,853 62,215,546
Chief Financial Officer 36,000,000 38,412,000 40,985,604 43,731,639 46,661,659
HR Manager 36,000,000 38,412,000 40,985,604 43,731,639 46,661,659
HR Staff 21,000,000 22,407,000 23,908,269 25,510,123 27,219,301
Accounting 42,000,000 44,814,000 47,816,538 51,020,246 54,438,603
Clerks and admin personnel 42,000,000 44,814,000 47,816,538 51,020,246 54,438,603
Total Salary 225,000,000 240,075,000 256,160,025 273,322,747 291,635,371
Benefits
Percent (%) 10% 10% 10% 10% 10%
Total benefit costs 22,500,000 24,007,500 25,616,003 27,332,275 29,163,537
Total G & A Compensation 247,500,000 264,082,500 281,776,028 300,655,021 320,798,908
% of Revenue 7.5% 5.4% 4.3% 3.5% 2.9%