2. Fishbone Diagram (cause and effect)
3rd Largest Cause Largest Influence
Cause Cause
Cause
Cause
Cause
Effect
Cause Cause
Cause Cause
Least Influence 2nd Largest Influence
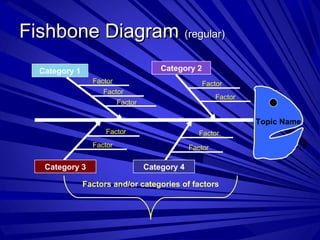
Factors and/or categories of factors
Notes de l'éditeur
Enter the names of the categories in the “Category” boxes. If you do not have categories, you can delete the category boxes. You can copy, cut, and paste any of the arrows or figures as needed to meet the needs of your own diagram.
Enter the names of the categories in the “Influence” boxes. You can copy, cut, and paste any of the arrows or figures as needed to meet the needs of your own diagram.