SlideShare une entreprise Scribd logo
1  sur  14
Télécharger pour lire hors ligne
International Gambling Studies, Vol. 3, No. 1, June 2003


Know When to Hold Them: Applying the Customer
Lifetime Value Concept to Casino Table Gaming


LISA WATSON & SUDHIR H. KALE
Bond University, Queensland, Australia


ABSTRACT This article considers the impact of relationship marketing in the casino gaming
industry. It illustrates how ‘customer lifetime value’ (LTV)—the estimated profitability of a
customer over the course of his or her entire relationship with a company—can be uniquely and
successfully applied to improve casino profitability. Findings indicate that increasing customer
retention rates for prime customers and upgrading middle-tier customers to higher-volume betting
tiers can both significantly increase long-term casino profits. Implementation of such a strategy
also reduces a casino’s reliance on the high-risk ‘junket’ segment for achieving targeted revenues
and profits.


Introduction
The phrase ‘customer relationship management’ (CRM) first entered the man-
agement and marketing literature just over a decade ago. It has since been well
documented that relationship marketing efforts are only worthwhile to a firm if
those relationships endure (Reinartz and Kumar, 2000). In order for CRM to be
profitable, companies must be able to retain customers over long periods of time.
In fact, a mere 5% increase in customer retention can, depending on industry,
lead to a 25% to 85% increase in profitability (Reichheld, 1996). This ‘leverage’
or ‘loyalty effect’ can be attributed to long-term decreases in costs of servicing
established customers and long-term increases in customer revenues. The under-
lying premise is that the long-term retention of customers significantly impacts
on a company’s net present values. Customer lifetime value (LTV) is the
estimated profitability of a customer over the course of his or her entire
relationship with a company. A recent study by Deloitte Consulting (as cited in
Fredericks, 2001) shows that companies who understand customer value are 60%
more profitable than those that do not. Thus, understanding and correctly
applying LTV is an important factor in increasing a company’s profits.
   Creating long-term relationships with customers can be a costly undertaking.
In 1999, companies spent an estimated US$34 billion on CRM services alone
(Sheth and Sisodia, 2001). CRM practice implies that it is financially worthwhile
for the company to form relationships with its customers. Before making
significant outlays on CRM-related products, companies must be certain that
they are going to reap the rewards for their customer retention efforts through
higher profits. This is where the concept of LTV becomes extremely important.
LTV uses basic profitability measures to calculate the profit potential of cus-
tomers over time. Most companies find that 20% to 40% of their customers are

ISSN 1445-9795 print/1479-4276 online/03/010089-13  2003 Taylor & Francis Ltd
DOI: 10.1080/1445979032000093842
90 L. Watson & S. H. Kale

not profitable at all or are only marginally profitable. Conversely, 20% of a firm’s
customers usually account for about 80% of the firm’s profitability. LTV can be
used to determine which of a company’s customer segments are most profitable.
Armed with this information, a business can decide where best to allocate
resources in forging long-term customer relationships.
   Currently, findings regarding the effect of customer retention on increased
profitability are rather volatile. Reichheld’s (1996) study alone offered a 60%
variation in results. This variation could be impacted by the differences in the
types of relationships and customers across industries. Thus, as has previously
been established, consideration of the ‘loyalty effect’ across industries is war-
ranted (McDougall, 2001). This article illustrates how LTV can be uniquely and
successfully applied within the casino gaming industry. We first discuss the
structural characteristics of the industry that make it appropriate for successfully
applying CRM and LTV. A set of sample LTV calculations for two table games
are then presented to demonstrate the significant impact that correctly targeted
allocation of CRM resources can have on improving casino profitability. Finally,
managerial implications and directions for future research are offered.

Usefulness of Applying CRM and LTV to the Casino Gaming Industry
CRM is meant to create long-term mutually beneficial relationships with cus-
tomers by developing stronger customer loyalty and reducing supplier
transaction costs (Davids, 1999). This customer-focused business model also goes
by the various names of relationship marketing, real-time marketing, customer
intimacy, and a variety of other terms.
   Cahners In-stat Group (2001) projects that total CRM software application
revenues will increase from US$9.4 billion worldwide by the end of 2001, to
approximately US$30.6 billion in 2005. However, a study conducted by Insight
Technology Group and CRM Insights in the year 2000 showed that 75% of CRM
programs were yielding little or no benefits for their companies (Turchan and
Mateus, 2001). Sheth and Sisodia (2001) report that 60% to 80% of CRM projects
do not achieve their goals, and between 30% and 50% fail outright! Rather than
jumping headlong into an expensive CRM program, it is crucial to determine
whether forming long-term customer relationships is an appropriate strategy for
increasing a firm’s profits.
   LTV is the profitability of a company’s customers over the lifetime of their
relationship. To successfully apply LTV, a company should be able to meet a few
basic criteria. First, it must be in the best interests of a company to form
long-term relationships with its customers. Second, customers must be able to be
measured and separated with respect to their profitability to the company.
Finally, in order to be able to manoeuvre customer profitability, services must be
able to be differentiated across customers. The casino industry meets each of
these three criteria.


Forming Long-term Relationships with Customers
Long-term relationships are not financially beneficial in all industries (Berger
and Nasr, 1998; McDougall, 2001). We shall examine the nature of the casino
industry, using the Australian gaming market as an illustration, to assess
whether casinos could benefit from cost/benefits-driven CRM analysis.
Customer Lifetime Value Concept to Casino Table Gaming   91

   Industries that can benefit from CRM have four common characteristics. The
first is that they have to have high customer retention rates. Because casinos in
Australia hold regional monopolies and demand for gaming is relatively inelas-
tic (Productivity Commission, 2000), it is reasonable to conclude that retention
rates of casino customers would be relatively high. Even in the United States or
Europe, where several casinos could be clustered within a given geographic
area, CRM programs such as players’ cards or loyalty cards have met with
considerable success (Nash, 2001).
   Secondly, industries suitable to CRM have to bear significantly higher costs to
attract new customers than to retain existing ones (McDougall, 2001). The
number of consistent casino table games players in the industry is quite low
(Australia’s Productivity Commission reported that only 18% of casino table
gamers played more than once a month). Coupling this casino table gaming
statistic with information about regionalisation and inelastic demand, it is
reasonable to conclude that the cost of retaining existing casino table gaming
customers is far lower than attracting new ones.
   The third characteristic is the ability to calculate profit at a customer level.
Casinos routinely calculate profitability at a customer level by knowing
what games customers play, the house advantage, customers’ average bets, and
for how long they play. Finally, CRM-appropriate industries have the ability
to easily segment customers based on volume and profitability. Casinos
clearly base segmentation on volume and profitability, as evidenced by the
familiar terms ‘high-roller’ and ‘whale’ used to describe extremely high-volume
customers. Because gaming profit is based on a theoretical house win over the
long term, high customer betting volume is directly correlated to high profit
potential.
   Thus casino table gaming seems ideally suited to the application of CRM
principles in order to increase profits. Yet not many casinos around the world
have explicitly adopted the LTV approach in designing their marketing strategy
for table gamers. With table games revenues steadily declining in relation to
slots, it is vital that casinos manage their table games with a clear mandate of
retaining their best customers.
   The one area where casinos excel in applying CRM strategies is in the slot
machine (gaming machine) market. Loyalty program cards allow for sophisti-
cated tracking of customer spending in order to analyse their potential LTV and
tailor individual future marketing efforts towards profitable prospects. Harrah’s
offers a good example of successful use of a ‘slot club’ loyalty program
(Ashbrook-Nickell, 2002). A player’s slot club card transfers customer data to a
central database. The data collected include such things as the number and types
of machines played, amount spent on each machine, number of individual
wagers and average bets. A software program then uses all collected information
to develop a detailed profile of every customer that can be used to determine
potential future profits. The data compiled in the process can subsequently be
used to develop tailored marketing programs, including appropriate segment-
level incentives for customers, and promotional programs customised toward a
specific segment. While casinos have tried to extend these techniques to table
gaming, results have been slow in coming. A better understanding of table
customer segments and their LTV potential may help casino managers to
develop more relevant and precisely targeted promotional programs for that
market.
92 L. Watson & S. H. Kale

Segmenting Casino Gaming Customers
Implicit in understanding customer value is the realisation that companies do
not have to serve all customer segments equally well. Keller Johnson (2002,
p. 14) reinforces this sentiment by advising that ‘an enterprise should not raise
customer-service levels across the board. Instead, it should provide better service
to customers with higher L[T]V.’ More profitable segments should earn better
service than less profitable ones. In other words, a cost/benefit analysis of
improving services to retain different types of casino customers should be
conducted using house odds and player betting habits. As was suggested in the
previous section and will be numerically demonstrated, casinos can easily
measure the current and projected profitability of its various customer segments.
Revenue calculations are based on a player’s average bet, hands per hour and
length of play (Makens and Bowen, 1994). Direct incentives or ‘comps’ may then
be subtracted from this figure to determine a customer’s profitability. Therefore,
making determinations about relative value of casino table game customers is
relatively elementary.
   Serving different customers with different levels of service first requires the
ability to divide customers into different tiers. Zeithaml et al. (2001) offer criteria
for creating a tiered customer segmentation system. First, they stress that usage
is not the only criterion for creating meaningful tiers. They emphasise that
profitability is an even more important criterion. This concept is uniquely dealt
with in the gaming industry because of the implicit relationship between high
volume and profitability. There are four conditions under which creating tiered
customer segments becomes viable. A company must first be able to determine
different and identifiable segment profiles. For example, the high-roller segment
generally gambles in extremely large volume and expects significant perks and
discounts from casinos interested in its business (MacDonald, 2001). Next,
different tiers must view service quality differently. Again, high-rollers expect a
significantly different level of service compared to the average once-a-month
low-betting casino table player. Third, the impact of improved service quality on
profitability varies greatly across tiers. High-rollers are currently offered incred-
ibly high levels of service across the industry. Offering them even higher service
levels could potentially erode profitability, while offering other segments im-
proved services could increase their spending, and hence the casino’s
profitability. Finally, different factors drive incidence and volume of new busi-
ness across tiers. For example, the type or amount of perks offered to a junket
may influence business from high-rollers, while seasonal tourism may impact
business from more casual customers. By appreciating these differences across
segments, casinos are better able to adequately separate customers into different
tiers.
   We have developed a two-by-two taxonomy of casino customer segments
based on customer profitability and level of relationship with the casino. While
the data used for describing the various segments (and used as the basis of our
computations in Tables 1 and 2) are industry-wide aggregate data for the whole
of Australia, the conceptual underpinning of the segments identified here should
be applicable to all casinos regardless of location. Individual casinos can input
their own figures as to segment size and average bet in order to arrive at the
LTV of each segment and the dollar value of increased retention across the four
Customer Lifetime Value Concept to Casino Table Gaming   93

segments. Figure 1 depicts the four identified customer segments for table
games.
   ‘Prime customers’ represent the casino’s most desirable target customers. This
segment includes high-volume gamblers usually comprised of brand-loyal indi-
viduals with a high net worth. They are often local and are the casino’s most
frequent gamblers. Their main gaming interests lie in table games.
   ‘Mobile customers’ (sometimes known in the gaming context as ‘tier-2 and
tier-3 premium players’) comprise less than 1% of a casino’s customer base, but
are also the highest volume customers (Productivity Commission, 2000). This
segment chooses providers on a transaction-by-transaction basis. Customers
constituting this segment negotiate heavily for extremely high levels of added
service before committing their business to any casino. These added services can
cost as much as 50% to 70% of the theoretical house winnings based on player
turnover (MacDonald, 2001). Thus, from the standpoint of the casino, the process
and level of cost is similar to winning a new high-volume customer with every
transaction. Junkets and a few individual high-net-worth international players
also fall into this segment.
   ‘Valued customers of tomorrow’ would include the majority of the 18% of
table gamers who gamble more than once per month. Players falling in this
category in Australia are generally 18 to 24-year-old males (Productivity Com-
mission, 2000). In relation to their cohorts, these individuals have above average
net worth and a serious interest in gaming. They are also likely to be local and
frequent customers. While their volume of gambling is quite high, their individ-
ual average bets are at a far lower level in comparison with prime customers. It
is possible that some customers in this segment could become prime customers
as their net worth increases over time.
   ‘Incidental customers’ are usually the curious and casual gamblers who are
not really interested in gaming. They would include the occasional gambler who
bets less than once a month. Often they are there more as spectators, or to
partake of other services offered by a casino such as the bars, shows or
restaurants. Undesirables often fall into this segment as well, those who act
inappropriately and disturb more valuable clientele.


Applying Service Differentiation to Casino Table Gaming Segments
Having determined that a      company is able to identify meaningful customer
segments, it then needs to    consider the development of appropriate customer
service tiers to suit those   segments. Zeithaml et al. (2001) consider a tiered
service system appropriate    when seven criteria exist.

1. Service resources are limited. This should reasonably apply to any hospitality
   organisation delivering services to customers and the casino industry is no
   exception.
2. Customers want different service levels. Casino patrons’ service expectations
   increase as their betting volumes increase. The existence of high-roller clubs
   and VIP rooms in casinos is evidence that customer tiers already exist in
   casinos. MacDonald (2001) reports that many mobile high-rollers will nego-
   tiate for the highest possible levels of service from competing casinos because
   they believe they deserve the highest customer tier status.
Table 1. LTV calculations and impact of increased retention rates across segments

                                                           6-deck Blackjack                                                  Baccarat
Game played
Betting assumptions                         PC            MC             VCT             IC            PC             MC                VCT      IC

Average relationship length (years)         8              6               6             3              8              6                  6       3
Attrition rate                            12.5%          16.7%           16.7%         33.3%          12.5%          16.7%              16.7%   33.3%
Retention rate                            87.5%          83.3%           83.3%         66.7%          87.5%          83.3%              83.3%   66.7%
                                                                                                                                                         94 L. Watson & S. H. Kale


House advantage                           0.50%          0.50%           0.50%         0.50%          1.25%          1.25%              1.25%   1.25%
Average number of visits per year*         104              2              24             2            104              2                 24       2
Average hours of play per visit              3             48               3             1              3             48                  3       1
Number of hands played per hour             54             54              54            54            100            100                100     100
Average bet per hand ($)                   200           5,000             25            10            200           5,000                25      10
Average % of takings spent on service      20%            50%            10%             5%            20%            50%               10%      5%
Average LTV per customer (AU$)          $107,827.20    $388,800.00     $2,624.40       $15.39      $499,200.00    $1,800,000.0      $12,150.0   $71.25
% of customer base*                       2.5%            0.5%           15%            82%           2.5%           0.5%               15%     82%
% of total revenue                        53.4%          38.5%           7.8%           0.3%          53.4%          38.5%              7.8%    0.3%
Effects of increases in retention
1%—increased revenue per customer        $9,376.28      $24,817.02      $167.51         $0.48       $43,408.70     $114,893.62       $775.53     $2.20
2%—increased revenue per customer       $20,538.51      $53,018.18      $357.87         $0.98       $95,085.71     $245,454.55       1,656.82    $4.55
5%—increased revenue per customer       $71,884.80     $166,628.57     $1,124.74        $2.72      $332,800.00     $771,428.57      $5,207.14   $12.57
1%—increase in total game revenue          4.6%           2.5%           0.5%           0.0%           4.6%           2.5%              0.5%    0.0%
2%—increase in total game revenue         10.2%           5.3%           1.1%           0.0%          10.2%           5.3%              1.1%    0.0%
5%—increase in total game revenue         35.6%          16.5%           3.3%           0.0%          35.6%          16.5%              3.3%    0.0%

*Figures estimated from the Australian National Gaming Survey conducted in April 1999 by the Productivity Commission (2000).
Customer Lifetime Value Concept to Casino Table Gaming   95

3. Customers are willing to pay for different service levels. Following MacDon-
   ald’s discussion, currently customers who play higher betting amounts in the
   hope of winning big believe that they are also paying for a higher level of
   added service.
4. Customers define value differently. Some customers may consider the benefit
   they receive from gambling to be different from others. For instance, among
   regular Australian gamblers, 66% cite the ‘dream of winning’ as a reason for
   gambling, while 65% cite social reasons and entertainment (Productivity
   Commission, 2000). The perceived value in gambling thus differs across
   punters.
5. Customers can be separated from each other. Casinos generally separate
   customers based on betting volume. They may also distinguish regular local
   customers from other incidental or mobile customers based on visit fre-
   quency.
6. Service differentials can lead to upgrade. A low-betting customer who enjoys
   gambling may begin to spend more money at a casino if she sees that she can
   start receiving better service (e.g. high-roller club membership) in exchange
   for increased bets.
7. Finally, customers can be accessed as groups or individuals. Individual
   high-volume betters are known individually to casino managers, and may
   thus be recognised as fitting into the ‘high-roller’ customer segment, based on
   betting volume. Because casino table gamers are already segmented into at
   least two distinct tiers, applying LTV and CRM is an appropriate strategy for
   reaching these customers.

  Having established the appropriateness of CRM in the context of a casino, we
shall now demonstrate how a casino’s bottom-line can vary dramatically based
on retention levels across the four segments. We reiterate that though the
calculations for this article are based on aggregate data, individual casino
operators can engage in a similar exercise for strategic insights into their table
games operations.


Applying CRM and LTV to the Casino Table Gaming: An Example
Wyner (1996) points out that there are three basic ways in which a firm can
increase its revenues. The first and most commonly recognised method of
increasing revenues and profits is to engage new customers (also known as
conquest marketing). Another method of increasing revenues is to encourage
increased spending by existing customers. This method would involve achieving
customer tier upgrades as discussed in the previous section. This option is
feasible within the gaming market as statistics indicate that participation in
casino gambling increases with income and age (Productivity Commission,
2000). The third option, the maintenance of existing customer spending while
reducing transaction costs, should intuitively be the least costly source of
revenue. By maintaining longer relationships with existing customers, the LTV
of those customers increases exponentially. Understanding and exploiting this
facet of CRM can significantly increase the profit potential of the service
provider. This section discusses the revenue streams from the four main cus-
tomer segments identified in this paper. Table 1 provides numerical evidence to
illustrate the profit-building power of long-term customers in table gaming.
96 L. Watson & S. H. Kale

Increasing Customer Retention Rates
A casino’s gross profits increase substantially by simply extending the life span
of its relationship with certain customers. Calculations use estimates of relation-
ship lengths, theoretical revenues, servicing costs, and percentage of customer
base, so as to determine the profitability of each table games customer segment.
Figures used here are based on aggregated published sources as well as on
discussions with three casino managers in Australia. Some figures will vary
across individual casinos. The relationship length and size of each segment
would vary among individual casinos based on location, catchment area, and
competition. By simply substituting the aggregate figures used here with their
property-specific data, individual operators can evaluate their unique LTV
implications across the four segments.
   Table 1 suggests that in the case of table gaming, the traditional marketing
principle that 80% of a firm’s revenue comes from 20% of its customers may not
necessarily hold, at least at the aggregate level. Instead, according to the
calculations, a mere 3% of table games customers can generate approximately
90% of all table games revenues! Also, the ‘prime customers’ segment generates
approximately 53% of all table revenues. Of course, these data do not account for
short-term wins or losses, but are based on long-term statistical odds. In this
example we have assumed that the distribution of player types remain the same
across table games, and therefore profit ratios between segments also remain
consistent across all table games.
   Let us now examine how the application of LTV to increasing customer
retention rates affects a casino’s revenues. Customer retention rates are calcu-
lated based on the number of customers lost from a given segment each year. If
one out of every eight customers in a segment is lost each year, the attrition rate
is 12.5%, thereby making the retention rate for the segment 87.5%. An increase
in retention is equivalent to increasing the average life span of that customer
segment. As a customer’s life span increases, so will his or her revenue and
profit generation for the casino. Calculations indicate that increasing the average
retention rate of ‘prime customers’ (PC) by just 2% will yield an average increase
of 10% in overall table revenues. Even more interesting, the revenue increase
generated by increased retention is not linear; an average 5% increase in PC
retention will draw in excess of a 35% increase in overall table games’ revenues.
   The ‘mobile customers’ segment (MC) provides a different perspective of how
retention can influence LTV of customer segments. This segment is less
significant to the casino’s long-term bottom line than the PC segment. Increases
in retention rates among this segment will not provide profit increases as high
as equivalent retention increases in the PC segment. For example, a 2% increase
in retention in the MC segment will increase overall table revenues by only 5%,
or half as much as the same retention increase in the PC segment. However, the
influence of this segment on casino operations should not be underestimated.
The calculations shown here are average long-term takings based on odds and
do not allow for big wins or losses on the part of the MCs in the short-term. The
short-term fluctuations in cash flow of the casino caused by these customers can
be significant. The MGM-Mirage, Hilton, and most recently Harrah’s (or The
Rio, more particularly) have all fallen foul of low-hold percentages as a result of
poor win rates brought about by dealing high-limit Baccarat to a select few
(predominantly Asian) customers (MacDonald, 2001).
Customer Lifetime Value Concept to Casino Table Gaming                            97

Table 2. LTV comparison table with a 5% tier upgrade in the VCT segment

                                                                 (A) Original position

Betting assumptions                                  PC            MC             VCT            IC

Average length of relationship (years)             8                 6               6            3
Attrition rate                                  12.5%             16.7%           16.7%        33.3%
Retention rate                                  87.5%             83.3%           83.3%        66.7%
House advantage                                 0.50%             0.50%           0.50%        0.50%
Average number of visits per year*                104                 2             24             2
Average hours of play per visit                     3                48              3             1
Number of hands played per hour                    54                54             54            54
Average bet per hand ($)                          200              5,000            25           10
Average % of takings spent on service            20%               50%             10%           5%
Average LTV per customer                       $107,827          $388,800         $2,624         $15
% of customer base*                              2.5%              0.5%           15.0%        82.0%
% of total revenue                              53.4%             38.5%            7.8%         0.3%
Effects of increases in retention
1%—increased profit per customer                     $9,376        $24,817          $168          $0
2%—increased profit per customer                    $20,539        $53,018          $358          $1
5%—increased profit per customer                    $71,885       $166,629         $1,125         $3
1%—increase in total game revenue                    4.6%           2.5%           0.5%         0.0%
2%—increase in total game revenue                   10.2%          5.3%            1.1%         0.0%
5%—increase in total game revenue                   35.6%          16.5%           3.3%         0.0%

                                                              (B) 5% Conversion
Betting assumptions            PC        CPC         All PC       MC        CVCT      VCT      All VCT    IC

Average length of
  relationship (years)              8        4          6           6          4         6         5        3
Attrition rate                   12.5%    25.0%      18.8%       16.7%      25.0%     16.7%     20.8%    33.3%
Retention rate                   87.5%    75.0%      81.3%       83.3%      75.0%     83.3%     79.2%    66.7%
House advantage                  0.50%    0.50%      0.50%       0.50%      0.50%     0.50%     0.50%    0.50%
Average number of
  visits per year*                 104     104        104          2         24         24       24        2
Average hours of play
  per visit                         3        3            3        48         3            3      3        1
Number of hands played
  per hour                         54       54        54           54        54         54       54       54
Average bet per hand               200     200        200         5,000      25         25       25       10
Average % of takings spent
  on service                      20%      20%        20%         50%       10%       10%       10%       5%
Average LTV per
  customer                      $107,827 $53,914     $80,870    $388,800    $1,750 $2,624      $2,187      $15
% of customer base*               2.5%    0.75%       3.25%       0.5%      0.75% 14.25%       15.00%    82.0%
% of total revenue               49.5%    7.43%      56.95%      35.7%      0.24% 6.87%        7.11%      0.2%
Revenue increase through
5% conversion                      8%
Effects of increases in retention
1%—increased profit per customer                      $11,623     $24,817                        $240      $0
2%—increased profit per customer                      $25,227     $53,018                        $510      $1
5%—increased profit per customer                      $85,363    $166,629                       $1,562     $3
1%—increase in total game revenue                      7.5%        2.3%                         0.7%     0.0%
2%—increase in total game revenue                     16.2%        4.9%                         1.5%     0.0%
5%—increase in total game revenue                     55.0%       15.3%                         4.6%     0.0%

* Figures estimated from the Australian National Gaming Survey conducted in April 1999 by the
Productivity Commission (2000).
98 L. Watson & S. H. Kale

   The cost of servicing these customers is also extremely high compared to other
segments and the overall size of the segment is quite small. Therefore, reducing
reliance on MCs for maintaining overall casino profitability would be worth-
while. As Lucas et al. (2002, p. 75) warn in a recent article, ‘Many casino
executives assume that the high-roller segment is inherently profitable. Combine
that assumption with a misunderstanding of gaming mathematics and you have
the makings of a downward profit spiral.’
   Increasing the relationship life of ‘valued customers of tomorrow’ (VCT)
would increase casino revenues by only 1%. Therefore, it is not immediately
obvious why a casino might want to put effort into servicing this segment.
However, as will be discussed shortly, a significant profit opportunity still exists
in servicing customers in the VCT segment if they can be upgraded to a more
profitable customer segment.
   ‘Incidental customers’ (IC), despite making up the majority of customers, seem
to provide very little value to a casino in terms of revenues. According to
relationship marketing theory, ICs should only be retained so long as the casino
is breaking even in servicing them. This segment has its utility to a casino in that
it makes the property look busy, thereby enhancing the ambience of the
establishment. Also, customers in this segment may spend their money in casino
bars, restaurants, gift-shops, and theatres, thus providing revenues for high-mar-
gin supplementary businesses on the property.


Upgrading Customers to More Profitable Customer Segments
Table 2 illustrates the comparative effect on revenues of converting 5% of the
VCT segment into PCs. It is assumed that the customer life span of converted
VCTs (CVCTs) would be four years, or half of the life span of a PC. They would
then spend the next four years as converted PCs (CPCs). This implies that
conversion would take place halfway through their overall average life span.
VCTs have relatively similar profiles to PCs. The only major difference lies in the
average size of their bets. Because PCs offer clear opportunities for profit
increases through increased retention, it stands to reason that upgrading VCTs
to PCs should offer a prime opportunity to further increase revenues. Relation-
ship building with the VCT segment, through the creation of appropriate service
tiers, should lead to upgrades to the PC level. Conversion of only 5% of VCTs
(labeled as CVCTs in Table 2) into PCs over a four-year period would increase
table hold by 8% without any increase in retention rates. By then increasing
overall PC retention rate by an average of 2%, the overall increase in casino table
games revenue would be 16%, an extra 6% over that gained without VCT
conversions.
   As in the previous example, revenues resulting from retention are not linear.
Increasing overall PC retention by 5%, after the 5% VCT conversion, can lead to
an incredible 55% increase in table game revenue. Not only do revenues increase
as conversion of VCTs increases, the percentage of revenue derived from MCs
also drops, thus reducing the casino’s reliance on them for income. Applying the
concepts of CRM and customer service tiers thus offers a simple yet compelling
approach to substantially increase casino table takings.
Customer Lifetime Value Concept to Casino Table Gaming     99


               Figure 1. Taxonomy of casino customer segments


Managerial Implications and Directions for Future Research
Wyner (1999) maintains that three elements are needed to appreciate and
practically apply the notion of customer profitability: the concept and its
measurement, its link to strategy and business design, and the implementation
issues that accompany it. The simple calculations presented in the previous
section meet these three criteria and offer salient strategic insights for casino
operators. Findings indicate that increasing PC retention rates and upgrading
VCTs to PCs can substantially increase a casino’s table takings. By successfully
converting 5% of VCTs to PCs, casino tables can increase their revenues by an
average of 8%. VCTs closely resemble PCs in terms of gaming frequency. The
more transactions or experience customers have with a company, the more likely
they will be to repurchase (Bolton et al., 2000). With proper understanding of
their VCT customer base, table operators should be able to determine which
VCTs have the best potential for conversion. Because VCTs’ disposable incomes
increase over time, conversion may be slow. It is important to learn to recognise
VCTs with high conversion potential and to groom them slowly over time to
become future PCs. This can be achieved through customer relationship man-
agement and the development of meaningful service tiers for various segments.
   Customers remain loyal because of the value they receive from a company
(Reichheld, 1994). However, a wide range of features that change over time drive
the value that each segment receives. Individual casinos must understand the
different benefits their customers derive from their services and determine how
elements of their services differ in terms of customers’ value perceptions. They
should then develop services to best meet individual customer segment needs,
while still offering tiered incentives for upgrades by VCTs (Zeithaml et al., 2001).
The drivers of the service benefits given to the PC tier should include elements
that add value for both current PCs and VCTs to provide incentive to upgrade.
   More in-depth knowledge of the customers in each segment is required in
order to develop these service tiers. Zeithaml et al. (2001) suggest that becoming
100 L. Watson & S. H. Kale

a customer expert through technology will aid in achieving increased incidence
and volume of business from a middle-tier segment such as VCT. Casinos have
tremendous opportunity to monitor customers at the mid-range betting tables in
order to look for regulars and track their spending habits. Astute and selective
player development is crucial to tier upgrade success. A thorough understand-
ing of gaming motives, perceptions of value, and service requirements across
segments would allow casinos to maximise the effectiveness of service tier
systems. These improved systems would, in turn, lead to higher customer
retention and increased profitability.
   Data relating customer spending to psychographic and demographic profiles
are still sparse in the casino industry. Understanding segment composition along
personality dimensions—as well activities, interests, and opinions (AIOs) and
demographics—would enable casino executives to have a 360-degree picture of
their target markets. Such a composite picture will enable casinos to better tailor
their service experience so that it is in line with their customers’ preferences and
expectations. Such service-based differentiation will not only guarantee survival
in a turbulent and increasingly competitive industry; it will also enhance
customer retention and thus improve the bottom line.


Summary
This article considered the impact of LTV analysis on table games within the
casino gaming industry. Based on a customer’s average bet and betting fre-
quency, we disaggregated the table gaming market into four distinct customer
segments. We then calculated LTV for each of the segments using aggregated
industry estimates. The impact of increasing customer retention on revenues was
then examined. Further analysis considered the influence on casino revenues of
upgrading the ‘valued customers of tomorrow’ to ‘prime customers’. The two
segments that provide the best opportunities for increased profitability are the
VCTs and PCs. By increasing PC customer retention and by upgrading VCTs to
PCs, not only do the casino’s profits increase, its dependence on MCs for
revenues also proportionately decreases. This drastically reduces the risks MCs
can pose to the short-term cash flow and long-term survival of a casino.
   At a time when many casinos are busy building or refurbishing multi-million
dollar facilities to cater exclusively to ‘mobile customers’, this article espouses a
fresh and less risky perspective. Casinos do not necessarily have to engage in
one-upmanship to woo the fickle-minded high-rollers. Findings from this article,
as well as earlier writings by MacDonald (2001) and Lucas et al. (2002) have
established that the ‘mobile customers’ are not as attractive to a casino as was
previously believed. We have demonstrated how a casino can wean its depen-
dence on the MCs and still accomplish its bottom-line objectives by focusing on
retention of less-risky segments instead.


References
Ashbrook-Nickell, J. 2002. ‘Welcome to Harrah’s’, Business 2.0, April issue [http://
  www.business2.com/articles/mag/0,1640,38619,FF.html].
Berger, P.D. and Nasr, N.I. 1998. ‘Customer lifetime value: Marketing models and applications’,
  Journal of Interactive Marketing, 12, pp. 17–30.
Bolton, R.N., Kannan, P.K. and Bramlett, M.D. 2000. ‘Implications of loyalty program membership
Customer Lifetime Value Concept to Casino Table Gaming                101

  and service experiences for customer retention and value’, Journal of the Academy of Marketing
  Science, 28, pp. 95–108.
Cahners In-stat Group 2001. The 3 Faces of CRM: Analysis of the Worldwide Customer Relationship
  Management Marketplace, Part 3: Interactive CRM. Report Number EC01–07ST: pp. 1–36.
Davids, M. 1999. ‘How to avoid the 10 biggest mistakes in CRM’, The Journal of Business Strategy, 20,
  pp. 22–6.
Dowling, G.R. and Uncles, M. 1997. ‘Do customer loyalty programs really work?’, Sloan Management
  Review, 38(4), pp. 71–82.
Fredericks, J. 2001. ‘Connecting customer loyalty to financial results’, Marketing Management, 10(1),
  pp. 26–32.
Keller Johnson, L. 2002. ‘The real value of customer loyalty’, Sloan Management Review, 43(2),
  pp. 14–17.
Lucas, A.F., Kilby, J. and Santos, J. 2002. ‘Assessing the profitability of premium players’, Cornell
  Hotel and Restaurant Administration Quarterly, 43(3), pp. 65–78.
MacDonald, A. 2001. ‘Dealing with high-rollers’, posted 18 March [http://urbino.net/articles/].
Makens, J.C. and Bowen, J.T. 1994. ‘Junket reps and casino marketing’, The Cornell HRA Quarterly,
  35(5), pp. 63–9.
McDougall, G. 2001. ‘Customer retention strategies: When do they pay-off?’, Services Marketing
  Quarterly, 22(1), pp. 39–55.
Nash, K. 2001. ‘Casinos hit jackpot with customer data’, Computerworld, 2 July, p. 17.
Productivity Commission 2000. Australia’s Gambling Industries, Australian Government, catalogue
  number 9927661 [http://www.pc.gov.au/inquiry/gambling/].
Reichheld, F.F. 1994. ‘Loyalty and the renaissance of marketing’, Marketing Management, 2(4),
  pp. 10–22.
Reichheld, F.F. 1996. The Loyalty Effect. Harvard Business School Press, Boston, MA.
Reinartz, W.J. and Kumar, V. 2000. ‘On the profitability of long-life customers in a non-contractual
  setting: An empirical investigation and implications for marketing’, Journal of Marketing, 64,
  pp. 17–35.
Sheth, J.N. and Sisodia, R.S. 2001. ‘High performance marketing’, Marketing Management, 10(3),
  pp. 18–23.
Turchan, M.P. and Mateus, P. 2001. ‘The value of relationships’, Journal of Business Strategy, 22(6),
  pp. 29–32.
Wyner, G.A. 1996. ‘Customer valuation: Linking behavior and economics’, Marketing Research, 8,
  pp. 36–8.
Wyner, G.A. 1999. ‘Customer profitability’, Marketing Management, 8, pp. 8–9.
Zeithaml, V.A., Rust, R.T. and Lemon, K.N. 2001. ‘The customer pyramid: Creating and serving
  profitable customers’, California Management Review, 43, pp. 118–42.
3whentohold

Contenu connexe

Tendances

Techathon Idea Paper
Techathon Idea PaperTechathon Idea Paper
Techathon Idea PaperDillip kumar
 
CaseStudyPaper
CaseStudyPaperCaseStudyPaper
CaseStudyPaperKaran Shah
 
Customer relationship management
Customer relationship managementCustomer relationship management
Customer relationship managementPrashant Arsul
 
Balance Transfers White Paper
Balance Transfers White PaperBalance Transfers White Paper
Balance Transfers White PaperExperian
 
Managing claims by Vesuvio Labs
Managing claims by Vesuvio LabsManaging claims by Vesuvio Labs
Managing claims by Vesuvio Labspedro caetano
 
Transaction_Scoring - WVK MasterCard
Transaction_Scoring - WVK MasterCardTransaction_Scoring - WVK MasterCard
Transaction_Scoring - WVK MasterCardWestley Koenen
 
Recency/Frequency and Predictive Analytics in the gaming industry
Recency/Frequency and Predictive Analytics in the gaming industryRecency/Frequency and Predictive Analytics in the gaming industry
Recency/Frequency and Predictive Analytics in the gaming industryQualex Asia
 
Marketing Research Fall 2004
Marketing Research Fall 2004Marketing Research Fall 2004
Marketing Research Fall 2004Randy Brandt
 
ISACA Puget Sound November 2002 - CRM Security & Controls
ISACA Puget Sound November 2002 - CRM Security & ControlsISACA Puget Sound November 2002 - CRM Security & Controls
ISACA Puget Sound November 2002 - CRM Security & Controlsprosenzw69
 
Prepaid customer segmentation in telecommunications: An overview of common pr...
Prepaid customer segmentation in telecommunications: An overview of common pr...Prepaid customer segmentation in telecommunications: An overview of common pr...
Prepaid customer segmentation in telecommunications: An overview of common pr...Exacaster
 
What’s driving HOTEL LOYALTY membership
What’s driving HOTEL LOYALTY membershipWhat’s driving HOTEL LOYALTY membership
What’s driving HOTEL LOYALTY membershipHOTEL NEWS NOW (STR)
 
2008 Wireless Providers and Advocacy
2008 Wireless Providers and Advocacy2008 Wireless Providers and Advocacy
2008 Wireless Providers and Advocacy22squared
 
2008 Wireless Providers and Advocacy
2008 Wireless Providers and Advocacy2008 Wireless Providers and Advocacy
2008 Wireless Providers and AdvocacyBrandon Murphy
 
Real Trends Mergers & Acquisitions White Paper
Real Trends Mergers & Acquisitions White PaperReal Trends Mergers & Acquisitions White Paper
Real Trends Mergers & Acquisitions White PaperKeller Williams Careers
 
Customer Relationship Management and Banking Sector Market Share performance
Customer Relationship Management and Banking Sector Market Share performanceCustomer Relationship Management and Banking Sector Market Share performance
Customer Relationship Management and Banking Sector Market Share performanceinventionjournals
 
Relationship marketing practices and customer loyalty
Relationship marketing practices and customer loyaltyRelationship marketing practices and customer loyalty
Relationship marketing practices and customer loyaltyAlexander Decker
 
Why simply the best isn’t always right
Why simply the best isn’t always rightWhy simply the best isn’t always right
Why simply the best isn’t always rightTNS
 
Tns - Why simply the best isn't always right
Tns - Why simply the best isn't always rightTns - Why simply the best isn't always right
Tns - Why simply the best isn't always rightGabriella Bergaglio
 
Trade Credit Insurance White Paper December 2008
Trade Credit Insurance White Paper   December 2008Trade Credit Insurance White Paper   December 2008
Trade Credit Insurance White Paper December 2008jlebendig
 

Tendances (20)

Techathon Idea Paper
Techathon Idea PaperTechathon Idea Paper
Techathon Idea Paper
 
CaseStudyPaper
CaseStudyPaperCaseStudyPaper
CaseStudyPaper
 
Customer relationship management
Customer relationship managementCustomer relationship management
Customer relationship management
 
Balance Transfers White Paper
Balance Transfers White PaperBalance Transfers White Paper
Balance Transfers White Paper
 
Managing claims by Vesuvio Labs
Managing claims by Vesuvio LabsManaging claims by Vesuvio Labs
Managing claims by Vesuvio Labs
 
Transaction_Scoring - WVK MasterCard
Transaction_Scoring - WVK MasterCardTransaction_Scoring - WVK MasterCard
Transaction_Scoring - WVK MasterCard
 
Recency/Frequency and Predictive Analytics in the gaming industry
Recency/Frequency and Predictive Analytics in the gaming industryRecency/Frequency and Predictive Analytics in the gaming industry
Recency/Frequency and Predictive Analytics in the gaming industry
 
Marketing Research Fall 2004
Marketing Research Fall 2004Marketing Research Fall 2004
Marketing Research Fall 2004
 
Driving Profitability in the New Model Bank
Driving Profitability in the New Model BankDriving Profitability in the New Model Bank
Driving Profitability in the New Model Bank
 
ISACA Puget Sound November 2002 - CRM Security & Controls
ISACA Puget Sound November 2002 - CRM Security & ControlsISACA Puget Sound November 2002 - CRM Security & Controls
ISACA Puget Sound November 2002 - CRM Security & Controls
 
Prepaid customer segmentation in telecommunications: An overview of common pr...
Prepaid customer segmentation in telecommunications: An overview of common pr...Prepaid customer segmentation in telecommunications: An overview of common pr...
Prepaid customer segmentation in telecommunications: An overview of common pr...
 
What’s driving HOTEL LOYALTY membership
What’s driving HOTEL LOYALTY membershipWhat’s driving HOTEL LOYALTY membership
What’s driving HOTEL LOYALTY membership
 
2008 Wireless Providers and Advocacy
2008 Wireless Providers and Advocacy2008 Wireless Providers and Advocacy
2008 Wireless Providers and Advocacy
 
2008 Wireless Providers and Advocacy
2008 Wireless Providers and Advocacy2008 Wireless Providers and Advocacy
2008 Wireless Providers and Advocacy
 
Real Trends Mergers & Acquisitions White Paper
Real Trends Mergers & Acquisitions White PaperReal Trends Mergers & Acquisitions White Paper
Real Trends Mergers & Acquisitions White Paper
 
Customer Relationship Management and Banking Sector Market Share performance
Customer Relationship Management and Banking Sector Market Share performanceCustomer Relationship Management and Banking Sector Market Share performance
Customer Relationship Management and Banking Sector Market Share performance
 
Relationship marketing practices and customer loyalty
Relationship marketing practices and customer loyaltyRelationship marketing practices and customer loyalty
Relationship marketing practices and customer loyalty
 
Why simply the best isn’t always right
Why simply the best isn’t always rightWhy simply the best isn’t always right
Why simply the best isn’t always right
 
Tns - Why simply the best isn't always right
Tns - Why simply the best isn't always rightTns - Why simply the best isn't always right
Tns - Why simply the best isn't always right
 
Trade Credit Insurance White Paper December 2008
Trade Credit Insurance White Paper   December 2008Trade Credit Insurance White Paper   December 2008
Trade Credit Insurance White Paper December 2008
 

Similaire à 3whentohold

International Journal of Business and Management Invention (IJBMI)
International Journal of Business and Management Invention (IJBMI)International Journal of Business and Management Invention (IJBMI)
International Journal of Business and Management Invention (IJBMI)inventionjournals
 
Customer Intelligence Index 2023
Customer Intelligence Index 2023Customer Intelligence Index 2023
Customer Intelligence Index 2023AlexAtkins7
 
CRM - Customer Relationship Marketing
CRM - Customer Relationship Marketing CRM - Customer Relationship Marketing
CRM - Customer Relationship Marketing Deniz Kurugöllü
 
ARTICLE BY B C THIMMAIAH
ARTICLE BY  B C THIMMAIAHARTICLE BY  B C THIMMAIAH
ARTICLE BY B C THIMMAIAHTHIMMAIAH BC
 
Contoso Final Assignment Strategy & Finacial acumen Duco Boomsma
Contoso Final Assignment Strategy & Finacial acumen Duco BoomsmaContoso Final Assignment Strategy & Finacial acumen Duco Boomsma
Contoso Final Assignment Strategy & Finacial acumen Duco BoomsmaDuco Boomsma
 
CRM managment
CRM managmentCRM managment
CRM managmentbhavesh
 
Future-Proofing Insurance: Deepening Insights, Reinventing Processes and Resh...
Future-Proofing Insurance: Deepening Insights, Reinventing Processes and Resh...Future-Proofing Insurance: Deepening Insights, Reinventing Processes and Resh...
Future-Proofing Insurance: Deepening Insights, Reinventing Processes and Resh...Cognizant
 
ecrm-120514081421-phpapp02.pdf
ecrm-120514081421-phpapp02.pdfecrm-120514081421-phpapp02.pdf
ecrm-120514081421-phpapp02.pdfetebarkhmichale
 
A Study on CLTV Model in E Commerce Domains using Python
A Study on CLTV Model in E Commerce Domains using PythonA Study on CLTV Model in E Commerce Domains using Python
A Study on CLTV Model in E Commerce Domains using Pythonijtsrd
 
Customer relationship management
Customer relationship managementCustomer relationship management
Customer relationship managementSachin Kapoor
 
Mc Insurance Industry White Paper Final
Mc Insurance Industry White Paper FinalMc Insurance Industry White Paper Final
Mc Insurance Industry White Paper Finalturnesim
 
Embracing Customer Relationship Management (CRM) to Improve Organisational Vi...
Embracing Customer Relationship Management (CRM) to Improve Organisational Vi...Embracing Customer Relationship Management (CRM) to Improve Organisational Vi...
Embracing Customer Relationship Management (CRM) to Improve Organisational Vi...IOSRJBM
 
Digital Game-Changers for the Communication Service Provider Industry
Digital Game-Changers for the Communication Service Provider IndustryDigital Game-Changers for the Communication Service Provider Industry
Digital Game-Changers for the Communication Service Provider IndustryCognizant
 
Current Scenario of Different Type of Services Marketing and Delivery in Cust...
Current Scenario of Different Type of Services Marketing and Delivery in Cust...Current Scenario of Different Type of Services Marketing and Delivery in Cust...
Current Scenario of Different Type of Services Marketing and Delivery in Cust...Dr. Amarjeet Singh
 
Customer Relationship Management (CRM)
Customer Relationship Management (CRM)Customer Relationship Management (CRM)
Customer Relationship Management (CRM)Jaiser Abbas
 
Customer relationship management (CRM)
Customer relationship management (CRM) Customer relationship management (CRM)
Customer relationship management (CRM) Sana Fatima
 

Similaire à 3whentohold (20)

Crm
CrmCrm
Crm
 
Proposal of the report
Proposal of the reportProposal of the report
Proposal of the report
 
International Journal of Business and Management Invention (IJBMI)
International Journal of Business and Management Invention (IJBMI)International Journal of Business and Management Invention (IJBMI)
International Journal of Business and Management Invention (IJBMI)
 
Customer Intelligence Index 2023
Customer Intelligence Index 2023Customer Intelligence Index 2023
Customer Intelligence Index 2023
 
CRM - Customer Relationship Marketing
CRM - Customer Relationship Marketing CRM - Customer Relationship Marketing
CRM - Customer Relationship Marketing
 
Precision Marketing
Precision MarketingPrecision Marketing
Precision Marketing
 
ARTICLE BY B C THIMMAIAH
ARTICLE BY  B C THIMMAIAHARTICLE BY  B C THIMMAIAH
ARTICLE BY B C THIMMAIAH
 
Contoso Final Assignment Strategy & Finacial acumen Duco Boomsma
Contoso Final Assignment Strategy & Finacial acumen Duco BoomsmaContoso Final Assignment Strategy & Finacial acumen Duco Boomsma
Contoso Final Assignment Strategy & Finacial acumen Duco Boomsma
 
CRM managment
CRM managmentCRM managment
CRM managment
 
Future-Proofing Insurance: Deepening Insights, Reinventing Processes and Resh...
Future-Proofing Insurance: Deepening Insights, Reinventing Processes and Resh...Future-Proofing Insurance: Deepening Insights, Reinventing Processes and Resh...
Future-Proofing Insurance: Deepening Insights, Reinventing Processes and Resh...
 
ecrm-120514081421-phpapp02.pdf
ecrm-120514081421-phpapp02.pdfecrm-120514081421-phpapp02.pdf
ecrm-120514081421-phpapp02.pdf
 
A Study on CLTV Model in E Commerce Domains using Python
A Study on CLTV Model in E Commerce Domains using PythonA Study on CLTV Model in E Commerce Domains using Python
A Study on CLTV Model in E Commerce Domains using Python
 
Customer relationship management
Customer relationship managementCustomer relationship management
Customer relationship management
 
Mc Insurance Industry White Paper Final
Mc Insurance Industry White Paper FinalMc Insurance Industry White Paper Final
Mc Insurance Industry White Paper Final
 
Embracing Customer Relationship Management (CRM) to Improve Organisational Vi...
Embracing Customer Relationship Management (CRM) to Improve Organisational Vi...Embracing Customer Relationship Management (CRM) to Improve Organisational Vi...
Embracing Customer Relationship Management (CRM) to Improve Organisational Vi...
 
3e779 Module I
3e779 Module I3e779 Module I
3e779 Module I
 
Digital Game-Changers for the Communication Service Provider Industry
Digital Game-Changers for the Communication Service Provider IndustryDigital Game-Changers for the Communication Service Provider Industry
Digital Game-Changers for the Communication Service Provider Industry
 
Current Scenario of Different Type of Services Marketing and Delivery in Cust...
Current Scenario of Different Type of Services Marketing and Delivery in Cust...Current Scenario of Different Type of Services Marketing and Delivery in Cust...
Current Scenario of Different Type of Services Marketing and Delivery in Cust...
 
Customer Relationship Management (CRM)
Customer Relationship Management (CRM)Customer Relationship Management (CRM)
Customer Relationship Management (CRM)
 
Customer relationship management (CRM)
Customer relationship management (CRM) Customer relationship management (CRM)
Customer relationship management (CRM)
 

Plus de nich_marketing

Top 10 need-to-knows_about_social_networking_and_where_it_is_headed.pdf
Top 10 need-to-knows_about_social_networking_and_where_it_is_headed.pdfTop 10 need-to-knows_about_social_networking_and_where_it_is_headed.pdf
Top 10 need-to-knows_about_social_networking_and_where_it_is_headed.pdfnich_marketing
 
B2 b content_marketing_2012
B2 b content_marketing_2012B2 b content_marketing_2012
B2 b content_marketing_2012nich_marketing
 
Re-Activation Razorfish
Re-Activation RazorfishRe-Activation Razorfish
Re-Activation Razorfishnich_marketing
 
2011 fall lookbook_102711
2011 fall lookbook_1027112011 fall lookbook_102711
2011 fall lookbook_102711nich_marketing
 
Winterberry outlook 2012
Winterberry outlook 2012Winterberry outlook 2012
Winterberry outlook 2012nich_marketing
 
2011 digital-marketer-1
2011 digital-marketer-12011 digital-marketer-1
2011 digital-marketer-1nich_marketing
 
Booz co campaigns-to-capabilities-social-media-and-marketing-2011
Booz co campaigns-to-capabilities-social-media-and-marketing-2011Booz co campaigns-to-capabilities-social-media-and-marketing-2011
Booz co campaigns-to-capabilities-social-media-and-marketing-2011nich_marketing
 
Abercrombie.and.fitch.catalog.back.to.school.2003
Abercrombie.and.fitch.catalog.back.to.school.2003Abercrombie.and.fitch.catalog.back.to.school.2003
Abercrombie.and.fitch.catalog.back.to.school.2003nich_marketing
 
Media analyzer article-adweek-does-sex-really-sell-2005
Media analyzer article-adweek-does-sex-really-sell-2005Media analyzer article-adweek-does-sex-really-sell-2005
Media analyzer article-adweek-does-sex-really-sell-2005nich_marketing
 
Vl plus-storyboard-smmp-rev3
Vl plus-storyboard-smmp-rev3Vl plus-storyboard-smmp-rev3
Vl plus-storyboard-smmp-rev3nich_marketing
 

Plus de nich_marketing (20)

Marketolog streater
Marketolog streaterMarketolog streater
Marketolog streater
 
Digital world2
Digital world2Digital world2
Digital world2
 
Top 10 need-to-knows_about_social_networking_and_where_it_is_headed.pdf
Top 10 need-to-knows_about_social_networking_and_where_it_is_headed.pdfTop 10 need-to-knows_about_social_networking_and_where_it_is_headed.pdf
Top 10 need-to-knows_about_social_networking_and_where_it_is_headed.pdf
 
Social web-analytics
Social web-analyticsSocial web-analytics
Social web-analytics
 
Experian data sharing
Experian data sharingExperian data sharing
Experian data sharing
 
Ideas
IdeasIdeas
Ideas
 
B2 b content_marketing_2012
B2 b content_marketing_2012B2 b content_marketing_2012
B2 b content_marketing_2012
 
Marketolog Pocketbook
Marketolog PocketbookMarketolog Pocketbook
Marketolog Pocketbook
 
Re-Activation Razorfish
Re-Activation RazorfishRe-Activation Razorfish
Re-Activation Razorfish
 
2011 fall lookbook_102711
2011 fall lookbook_1027112011 fall lookbook_102711
2011 fall lookbook_102711
 
Soda survey
Soda surveySoda survey
Soda survey
 
Winterberry outlook 2012
Winterberry outlook 2012Winterberry outlook 2012
Winterberry outlook 2012
 
Dominomaniya
DominomaniyaDominomaniya
Dominomaniya
 
2011 digital-marketer-1
2011 digital-marketer-12011 digital-marketer-1
2011 digital-marketer-1
 
Booz co campaigns-to-capabilities-social-media-and-marketing-2011
Booz co campaigns-to-capabilities-social-media-and-marketing-2011Booz co campaigns-to-capabilities-social-media-and-marketing-2011
Booz co campaigns-to-capabilities-social-media-and-marketing-2011
 
Abercrombie.and.fitch.catalog.back.to.school.2003
Abercrombie.and.fitch.catalog.back.to.school.2003Abercrombie.and.fitch.catalog.back.to.school.2003
Abercrombie.and.fitch.catalog.back.to.school.2003
 
Media analyzer article-adweek-does-sex-really-sell-2005
Media analyzer article-adweek-does-sex-really-sell-2005Media analyzer article-adweek-does-sex-really-sell-2005
Media analyzer article-adweek-does-sex-really-sell-2005
 
Vl plus-storyboard-smmp-rev3
Vl plus-storyboard-smmp-rev3Vl plus-storyboard-smmp-rev3
Vl plus-storyboard-smmp-rev3
 
Bernbach quotes
Bernbach quotesBernbach quotes
Bernbach quotes
 
Socialcrmthenewrules
SocialcrmthenewrulesSocialcrmthenewrules
Socialcrmthenewrules
 

3whentohold

  • 1. International Gambling Studies, Vol. 3, No. 1, June 2003 Know When to Hold Them: Applying the Customer Lifetime Value Concept to Casino Table Gaming LISA WATSON & SUDHIR H. KALE Bond University, Queensland, Australia ABSTRACT This article considers the impact of relationship marketing in the casino gaming industry. It illustrates how ‘customer lifetime value’ (LTV)—the estimated profitability of a customer over the course of his or her entire relationship with a company—can be uniquely and successfully applied to improve casino profitability. Findings indicate that increasing customer retention rates for prime customers and upgrading middle-tier customers to higher-volume betting tiers can both significantly increase long-term casino profits. Implementation of such a strategy also reduces a casino’s reliance on the high-risk ‘junket’ segment for achieving targeted revenues and profits. Introduction The phrase ‘customer relationship management’ (CRM) first entered the man- agement and marketing literature just over a decade ago. It has since been well documented that relationship marketing efforts are only worthwhile to a firm if those relationships endure (Reinartz and Kumar, 2000). In order for CRM to be profitable, companies must be able to retain customers over long periods of time. In fact, a mere 5% increase in customer retention can, depending on industry, lead to a 25% to 85% increase in profitability (Reichheld, 1996). This ‘leverage’ or ‘loyalty effect’ can be attributed to long-term decreases in costs of servicing established customers and long-term increases in customer revenues. The under- lying premise is that the long-term retention of customers significantly impacts on a company’s net present values. Customer lifetime value (LTV) is the estimated profitability of a customer over the course of his or her entire relationship with a company. A recent study by Deloitte Consulting (as cited in Fredericks, 2001) shows that companies who understand customer value are 60% more profitable than those that do not. Thus, understanding and correctly applying LTV is an important factor in increasing a company’s profits. Creating long-term relationships with customers can be a costly undertaking. In 1999, companies spent an estimated US$34 billion on CRM services alone (Sheth and Sisodia, 2001). CRM practice implies that it is financially worthwhile for the company to form relationships with its customers. Before making significant outlays on CRM-related products, companies must be certain that they are going to reap the rewards for their customer retention efforts through higher profits. This is where the concept of LTV becomes extremely important. LTV uses basic profitability measures to calculate the profit potential of cus- tomers over time. Most companies find that 20% to 40% of their customers are ISSN 1445-9795 print/1479-4276 online/03/010089-13  2003 Taylor & Francis Ltd DOI: 10.1080/1445979032000093842
  • 2. 90 L. Watson & S. H. Kale not profitable at all or are only marginally profitable. Conversely, 20% of a firm’s customers usually account for about 80% of the firm’s profitability. LTV can be used to determine which of a company’s customer segments are most profitable. Armed with this information, a business can decide where best to allocate resources in forging long-term customer relationships. Currently, findings regarding the effect of customer retention on increased profitability are rather volatile. Reichheld’s (1996) study alone offered a 60% variation in results. This variation could be impacted by the differences in the types of relationships and customers across industries. Thus, as has previously been established, consideration of the ‘loyalty effect’ across industries is war- ranted (McDougall, 2001). This article illustrates how LTV can be uniquely and successfully applied within the casino gaming industry. We first discuss the structural characteristics of the industry that make it appropriate for successfully applying CRM and LTV. A set of sample LTV calculations for two table games are then presented to demonstrate the significant impact that correctly targeted allocation of CRM resources can have on improving casino profitability. Finally, managerial implications and directions for future research are offered. Usefulness of Applying CRM and LTV to the Casino Gaming Industry CRM is meant to create long-term mutually beneficial relationships with cus- tomers by developing stronger customer loyalty and reducing supplier transaction costs (Davids, 1999). This customer-focused business model also goes by the various names of relationship marketing, real-time marketing, customer intimacy, and a variety of other terms. Cahners In-stat Group (2001) projects that total CRM software application revenues will increase from US$9.4 billion worldwide by the end of 2001, to approximately US$30.6 billion in 2005. However, a study conducted by Insight Technology Group and CRM Insights in the year 2000 showed that 75% of CRM programs were yielding little or no benefits for their companies (Turchan and Mateus, 2001). Sheth and Sisodia (2001) report that 60% to 80% of CRM projects do not achieve their goals, and between 30% and 50% fail outright! Rather than jumping headlong into an expensive CRM program, it is crucial to determine whether forming long-term customer relationships is an appropriate strategy for increasing a firm’s profits. LTV is the profitability of a company’s customers over the lifetime of their relationship. To successfully apply LTV, a company should be able to meet a few basic criteria. First, it must be in the best interests of a company to form long-term relationships with its customers. Second, customers must be able to be measured and separated with respect to their profitability to the company. Finally, in order to be able to manoeuvre customer profitability, services must be able to be differentiated across customers. The casino industry meets each of these three criteria. Forming Long-term Relationships with Customers Long-term relationships are not financially beneficial in all industries (Berger and Nasr, 1998; McDougall, 2001). We shall examine the nature of the casino industry, using the Australian gaming market as an illustration, to assess whether casinos could benefit from cost/benefits-driven CRM analysis.
  • 3. Customer Lifetime Value Concept to Casino Table Gaming 91 Industries that can benefit from CRM have four common characteristics. The first is that they have to have high customer retention rates. Because casinos in Australia hold regional monopolies and demand for gaming is relatively inelas- tic (Productivity Commission, 2000), it is reasonable to conclude that retention rates of casino customers would be relatively high. Even in the United States or Europe, where several casinos could be clustered within a given geographic area, CRM programs such as players’ cards or loyalty cards have met with considerable success (Nash, 2001). Secondly, industries suitable to CRM have to bear significantly higher costs to attract new customers than to retain existing ones (McDougall, 2001). The number of consistent casino table games players in the industry is quite low (Australia’s Productivity Commission reported that only 18% of casino table gamers played more than once a month). Coupling this casino table gaming statistic with information about regionalisation and inelastic demand, it is reasonable to conclude that the cost of retaining existing casino table gaming customers is far lower than attracting new ones. The third characteristic is the ability to calculate profit at a customer level. Casinos routinely calculate profitability at a customer level by knowing what games customers play, the house advantage, customers’ average bets, and for how long they play. Finally, CRM-appropriate industries have the ability to easily segment customers based on volume and profitability. Casinos clearly base segmentation on volume and profitability, as evidenced by the familiar terms ‘high-roller’ and ‘whale’ used to describe extremely high-volume customers. Because gaming profit is based on a theoretical house win over the long term, high customer betting volume is directly correlated to high profit potential. Thus casino table gaming seems ideally suited to the application of CRM principles in order to increase profits. Yet not many casinos around the world have explicitly adopted the LTV approach in designing their marketing strategy for table gamers. With table games revenues steadily declining in relation to slots, it is vital that casinos manage their table games with a clear mandate of retaining their best customers. The one area where casinos excel in applying CRM strategies is in the slot machine (gaming machine) market. Loyalty program cards allow for sophisti- cated tracking of customer spending in order to analyse their potential LTV and tailor individual future marketing efforts towards profitable prospects. Harrah’s offers a good example of successful use of a ‘slot club’ loyalty program (Ashbrook-Nickell, 2002). A player’s slot club card transfers customer data to a central database. The data collected include such things as the number and types of machines played, amount spent on each machine, number of individual wagers and average bets. A software program then uses all collected information to develop a detailed profile of every customer that can be used to determine potential future profits. The data compiled in the process can subsequently be used to develop tailored marketing programs, including appropriate segment- level incentives for customers, and promotional programs customised toward a specific segment. While casinos have tried to extend these techniques to table gaming, results have been slow in coming. A better understanding of table customer segments and their LTV potential may help casino managers to develop more relevant and precisely targeted promotional programs for that market.
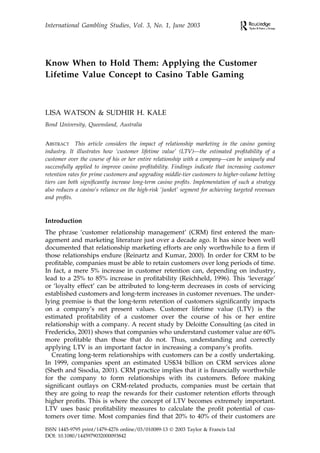
  • 4. 92 L. Watson & S. H. Kale Segmenting Casino Gaming Customers Implicit in understanding customer value is the realisation that companies do not have to serve all customer segments equally well. Keller Johnson (2002, p. 14) reinforces this sentiment by advising that ‘an enterprise should not raise customer-service levels across the board. Instead, it should provide better service to customers with higher L[T]V.’ More profitable segments should earn better service than less profitable ones. In other words, a cost/benefit analysis of improving services to retain different types of casino customers should be conducted using house odds and player betting habits. As was suggested in the previous section and will be numerically demonstrated, casinos can easily measure the current and projected profitability of its various customer segments. Revenue calculations are based on a player’s average bet, hands per hour and length of play (Makens and Bowen, 1994). Direct incentives or ‘comps’ may then be subtracted from this figure to determine a customer’s profitability. Therefore, making determinations about relative value of casino table game customers is relatively elementary. Serving different customers with different levels of service first requires the ability to divide customers into different tiers. Zeithaml et al. (2001) offer criteria for creating a tiered customer segmentation system. First, they stress that usage is not the only criterion for creating meaningful tiers. They emphasise that profitability is an even more important criterion. This concept is uniquely dealt with in the gaming industry because of the implicit relationship between high volume and profitability. There are four conditions under which creating tiered customer segments becomes viable. A company must first be able to determine different and identifiable segment profiles. For example, the high-roller segment generally gambles in extremely large volume and expects significant perks and discounts from casinos interested in its business (MacDonald, 2001). Next, different tiers must view service quality differently. Again, high-rollers expect a significantly different level of service compared to the average once-a-month low-betting casino table player. Third, the impact of improved service quality on profitability varies greatly across tiers. High-rollers are currently offered incred- ibly high levels of service across the industry. Offering them even higher service levels could potentially erode profitability, while offering other segments im- proved services could increase their spending, and hence the casino’s profitability. Finally, different factors drive incidence and volume of new busi- ness across tiers. For example, the type or amount of perks offered to a junket may influence business from high-rollers, while seasonal tourism may impact business from more casual customers. By appreciating these differences across segments, casinos are better able to adequately separate customers into different tiers. We have developed a two-by-two taxonomy of casino customer segments based on customer profitability and level of relationship with the casino. While the data used for describing the various segments (and used as the basis of our computations in Tables 1 and 2) are industry-wide aggregate data for the whole of Australia, the conceptual underpinning of the segments identified here should be applicable to all casinos regardless of location. Individual casinos can input their own figures as to segment size and average bet in order to arrive at the LTV of each segment and the dollar value of increased retention across the four
  • 5. Customer Lifetime Value Concept to Casino Table Gaming 93 segments. Figure 1 depicts the four identified customer segments for table games. ‘Prime customers’ represent the casino’s most desirable target customers. This segment includes high-volume gamblers usually comprised of brand-loyal indi- viduals with a high net worth. They are often local and are the casino’s most frequent gamblers. Their main gaming interests lie in table games. ‘Mobile customers’ (sometimes known in the gaming context as ‘tier-2 and tier-3 premium players’) comprise less than 1% of a casino’s customer base, but are also the highest volume customers (Productivity Commission, 2000). This segment chooses providers on a transaction-by-transaction basis. Customers constituting this segment negotiate heavily for extremely high levels of added service before committing their business to any casino. These added services can cost as much as 50% to 70% of the theoretical house winnings based on player turnover (MacDonald, 2001). Thus, from the standpoint of the casino, the process and level of cost is similar to winning a new high-volume customer with every transaction. Junkets and a few individual high-net-worth international players also fall into this segment. ‘Valued customers of tomorrow’ would include the majority of the 18% of table gamers who gamble more than once per month. Players falling in this category in Australia are generally 18 to 24-year-old males (Productivity Com- mission, 2000). In relation to their cohorts, these individuals have above average net worth and a serious interest in gaming. They are also likely to be local and frequent customers. While their volume of gambling is quite high, their individ- ual average bets are at a far lower level in comparison with prime customers. It is possible that some customers in this segment could become prime customers as their net worth increases over time. ‘Incidental customers’ are usually the curious and casual gamblers who are not really interested in gaming. They would include the occasional gambler who bets less than once a month. Often they are there more as spectators, or to partake of other services offered by a casino such as the bars, shows or restaurants. Undesirables often fall into this segment as well, those who act inappropriately and disturb more valuable clientele. Applying Service Differentiation to Casino Table Gaming Segments Having determined that a company is able to identify meaningful customer segments, it then needs to consider the development of appropriate customer service tiers to suit those segments. Zeithaml et al. (2001) consider a tiered service system appropriate when seven criteria exist. 1. Service resources are limited. This should reasonably apply to any hospitality organisation delivering services to customers and the casino industry is no exception. 2. Customers want different service levels. Casino patrons’ service expectations increase as their betting volumes increase. The existence of high-roller clubs and VIP rooms in casinos is evidence that customer tiers already exist in casinos. MacDonald (2001) reports that many mobile high-rollers will nego- tiate for the highest possible levels of service from competing casinos because they believe they deserve the highest customer tier status.
  • 6. Table 1. LTV calculations and impact of increased retention rates across segments 6-deck Blackjack Baccarat Game played Betting assumptions PC MC VCT IC PC MC VCT IC Average relationship length (years) 8 6 6 3 8 6 6 3 Attrition rate 12.5% 16.7% 16.7% 33.3% 12.5% 16.7% 16.7% 33.3% Retention rate 87.5% 83.3% 83.3% 66.7% 87.5% 83.3% 83.3% 66.7% 94 L. Watson & S. H. Kale House advantage 0.50% 0.50% 0.50% 0.50% 1.25% 1.25% 1.25% 1.25% Average number of visits per year* 104 2 24 2 104 2 24 2 Average hours of play per visit 3 48 3 1 3 48 3 1 Number of hands played per hour 54 54 54 54 100 100 100 100 Average bet per hand ($) 200 5,000 25 10 200 5,000 25 10 Average % of takings spent on service 20% 50% 10% 5% 20% 50% 10% 5% Average LTV per customer (AU$) $107,827.20 $388,800.00 $2,624.40 $15.39 $499,200.00 $1,800,000.0 $12,150.0 $71.25 % of customer base* 2.5% 0.5% 15% 82% 2.5% 0.5% 15% 82% % of total revenue 53.4% 38.5% 7.8% 0.3% 53.4% 38.5% 7.8% 0.3% Effects of increases in retention 1%—increased revenue per customer $9,376.28 $24,817.02 $167.51 $0.48 $43,408.70 $114,893.62 $775.53 $2.20 2%—increased revenue per customer $20,538.51 $53,018.18 $357.87 $0.98 $95,085.71 $245,454.55 1,656.82 $4.55 5%—increased revenue per customer $71,884.80 $166,628.57 $1,124.74 $2.72 $332,800.00 $771,428.57 $5,207.14 $12.57 1%—increase in total game revenue 4.6% 2.5% 0.5% 0.0% 4.6% 2.5% 0.5% 0.0% 2%—increase in total game revenue 10.2% 5.3% 1.1% 0.0% 10.2% 5.3% 1.1% 0.0% 5%—increase in total game revenue 35.6% 16.5% 3.3% 0.0% 35.6% 16.5% 3.3% 0.0% *Figures estimated from the Australian National Gaming Survey conducted in April 1999 by the Productivity Commission (2000).
  • 7. Customer Lifetime Value Concept to Casino Table Gaming 95 3. Customers are willing to pay for different service levels. Following MacDon- ald’s discussion, currently customers who play higher betting amounts in the hope of winning big believe that they are also paying for a higher level of added service. 4. Customers define value differently. Some customers may consider the benefit they receive from gambling to be different from others. For instance, among regular Australian gamblers, 66% cite the ‘dream of winning’ as a reason for gambling, while 65% cite social reasons and entertainment (Productivity Commission, 2000). The perceived value in gambling thus differs across punters. 5. Customers can be separated from each other. Casinos generally separate customers based on betting volume. They may also distinguish regular local customers from other incidental or mobile customers based on visit fre- quency. 6. Service differentials can lead to upgrade. A low-betting customer who enjoys gambling may begin to spend more money at a casino if she sees that she can start receiving better service (e.g. high-roller club membership) in exchange for increased bets. 7. Finally, customers can be accessed as groups or individuals. Individual high-volume betters are known individually to casino managers, and may thus be recognised as fitting into the ‘high-roller’ customer segment, based on betting volume. Because casino table gamers are already segmented into at least two distinct tiers, applying LTV and CRM is an appropriate strategy for reaching these customers. Having established the appropriateness of CRM in the context of a casino, we shall now demonstrate how a casino’s bottom-line can vary dramatically based on retention levels across the four segments. We reiterate that though the calculations for this article are based on aggregate data, individual casino operators can engage in a similar exercise for strategic insights into their table games operations. Applying CRM and LTV to the Casino Table Gaming: An Example Wyner (1996) points out that there are three basic ways in which a firm can increase its revenues. The first and most commonly recognised method of increasing revenues and profits is to engage new customers (also known as conquest marketing). Another method of increasing revenues is to encourage increased spending by existing customers. This method would involve achieving customer tier upgrades as discussed in the previous section. This option is feasible within the gaming market as statistics indicate that participation in casino gambling increases with income and age (Productivity Commission, 2000). The third option, the maintenance of existing customer spending while reducing transaction costs, should intuitively be the least costly source of revenue. By maintaining longer relationships with existing customers, the LTV of those customers increases exponentially. Understanding and exploiting this facet of CRM can significantly increase the profit potential of the service provider. This section discusses the revenue streams from the four main cus- tomer segments identified in this paper. Table 1 provides numerical evidence to illustrate the profit-building power of long-term customers in table gaming.
  • 8. 96 L. Watson & S. H. Kale Increasing Customer Retention Rates A casino’s gross profits increase substantially by simply extending the life span of its relationship with certain customers. Calculations use estimates of relation- ship lengths, theoretical revenues, servicing costs, and percentage of customer base, so as to determine the profitability of each table games customer segment. Figures used here are based on aggregated published sources as well as on discussions with three casino managers in Australia. Some figures will vary across individual casinos. The relationship length and size of each segment would vary among individual casinos based on location, catchment area, and competition. By simply substituting the aggregate figures used here with their property-specific data, individual operators can evaluate their unique LTV implications across the four segments. Table 1 suggests that in the case of table gaming, the traditional marketing principle that 80% of a firm’s revenue comes from 20% of its customers may not necessarily hold, at least at the aggregate level. Instead, according to the calculations, a mere 3% of table games customers can generate approximately 90% of all table games revenues! Also, the ‘prime customers’ segment generates approximately 53% of all table revenues. Of course, these data do not account for short-term wins or losses, but are based on long-term statistical odds. In this example we have assumed that the distribution of player types remain the same across table games, and therefore profit ratios between segments also remain consistent across all table games. Let us now examine how the application of LTV to increasing customer retention rates affects a casino’s revenues. Customer retention rates are calcu- lated based on the number of customers lost from a given segment each year. If one out of every eight customers in a segment is lost each year, the attrition rate is 12.5%, thereby making the retention rate for the segment 87.5%. An increase in retention is equivalent to increasing the average life span of that customer segment. As a customer’s life span increases, so will his or her revenue and profit generation for the casino. Calculations indicate that increasing the average retention rate of ‘prime customers’ (PC) by just 2% will yield an average increase of 10% in overall table revenues. Even more interesting, the revenue increase generated by increased retention is not linear; an average 5% increase in PC retention will draw in excess of a 35% increase in overall table games’ revenues. The ‘mobile customers’ segment (MC) provides a different perspective of how retention can influence LTV of customer segments. This segment is less significant to the casino’s long-term bottom line than the PC segment. Increases in retention rates among this segment will not provide profit increases as high as equivalent retention increases in the PC segment. For example, a 2% increase in retention in the MC segment will increase overall table revenues by only 5%, or half as much as the same retention increase in the PC segment. However, the influence of this segment on casino operations should not be underestimated. The calculations shown here are average long-term takings based on odds and do not allow for big wins or losses on the part of the MCs in the short-term. The short-term fluctuations in cash flow of the casino caused by these customers can be significant. The MGM-Mirage, Hilton, and most recently Harrah’s (or The Rio, more particularly) have all fallen foul of low-hold percentages as a result of poor win rates brought about by dealing high-limit Baccarat to a select few (predominantly Asian) customers (MacDonald, 2001).
  • 9. Customer Lifetime Value Concept to Casino Table Gaming 97 Table 2. LTV comparison table with a 5% tier upgrade in the VCT segment (A) Original position Betting assumptions PC MC VCT IC Average length of relationship (years) 8 6 6 3 Attrition rate 12.5% 16.7% 16.7% 33.3% Retention rate 87.5% 83.3% 83.3% 66.7% House advantage 0.50% 0.50% 0.50% 0.50% Average number of visits per year* 104 2 24 2 Average hours of play per visit 3 48 3 1 Number of hands played per hour 54 54 54 54 Average bet per hand ($) 200 5,000 25 10 Average % of takings spent on service 20% 50% 10% 5% Average LTV per customer $107,827 $388,800 $2,624 $15 % of customer base* 2.5% 0.5% 15.0% 82.0% % of total revenue 53.4% 38.5% 7.8% 0.3% Effects of increases in retention 1%—increased profit per customer $9,376 $24,817 $168 $0 2%—increased profit per customer $20,539 $53,018 $358 $1 5%—increased profit per customer $71,885 $166,629 $1,125 $3 1%—increase in total game revenue 4.6% 2.5% 0.5% 0.0% 2%—increase in total game revenue 10.2% 5.3% 1.1% 0.0% 5%—increase in total game revenue 35.6% 16.5% 3.3% 0.0% (B) 5% Conversion Betting assumptions PC CPC All PC MC CVCT VCT All VCT IC Average length of relationship (years) 8 4 6 6 4 6 5 3 Attrition rate 12.5% 25.0% 18.8% 16.7% 25.0% 16.7% 20.8% 33.3% Retention rate 87.5% 75.0% 81.3% 83.3% 75.0% 83.3% 79.2% 66.7% House advantage 0.50% 0.50% 0.50% 0.50% 0.50% 0.50% 0.50% 0.50% Average number of visits per year* 104 104 104 2 24 24 24 2 Average hours of play per visit 3 3 3 48 3 3 3 1 Number of hands played per hour 54 54 54 54 54 54 54 54 Average bet per hand 200 200 200 5,000 25 25 25 10 Average % of takings spent on service 20% 20% 20% 50% 10% 10% 10% 5% Average LTV per customer $107,827 $53,914 $80,870 $388,800 $1,750 $2,624 $2,187 $15 % of customer base* 2.5% 0.75% 3.25% 0.5% 0.75% 14.25% 15.00% 82.0% % of total revenue 49.5% 7.43% 56.95% 35.7% 0.24% 6.87% 7.11% 0.2% Revenue increase through 5% conversion 8% Effects of increases in retention 1%—increased profit per customer $11,623 $24,817 $240 $0 2%—increased profit per customer $25,227 $53,018 $510 $1 5%—increased profit per customer $85,363 $166,629 $1,562 $3 1%—increase in total game revenue 7.5% 2.3% 0.7% 0.0% 2%—increase in total game revenue 16.2% 4.9% 1.5% 0.0% 5%—increase in total game revenue 55.0% 15.3% 4.6% 0.0% * Figures estimated from the Australian National Gaming Survey conducted in April 1999 by the Productivity Commission (2000).
  • 10. 98 L. Watson & S. H. Kale The cost of servicing these customers is also extremely high compared to other segments and the overall size of the segment is quite small. Therefore, reducing reliance on MCs for maintaining overall casino profitability would be worth- while. As Lucas et al. (2002, p. 75) warn in a recent article, ‘Many casino executives assume that the high-roller segment is inherently profitable. Combine that assumption with a misunderstanding of gaming mathematics and you have the makings of a downward profit spiral.’ Increasing the relationship life of ‘valued customers of tomorrow’ (VCT) would increase casino revenues by only 1%. Therefore, it is not immediately obvious why a casino might want to put effort into servicing this segment. However, as will be discussed shortly, a significant profit opportunity still exists in servicing customers in the VCT segment if they can be upgraded to a more profitable customer segment. ‘Incidental customers’ (IC), despite making up the majority of customers, seem to provide very little value to a casino in terms of revenues. According to relationship marketing theory, ICs should only be retained so long as the casino is breaking even in servicing them. This segment has its utility to a casino in that it makes the property look busy, thereby enhancing the ambience of the establishment. Also, customers in this segment may spend their money in casino bars, restaurants, gift-shops, and theatres, thus providing revenues for high-mar- gin supplementary businesses on the property. Upgrading Customers to More Profitable Customer Segments Table 2 illustrates the comparative effect on revenues of converting 5% of the VCT segment into PCs. It is assumed that the customer life span of converted VCTs (CVCTs) would be four years, or half of the life span of a PC. They would then spend the next four years as converted PCs (CPCs). This implies that conversion would take place halfway through their overall average life span. VCTs have relatively similar profiles to PCs. The only major difference lies in the average size of their bets. Because PCs offer clear opportunities for profit increases through increased retention, it stands to reason that upgrading VCTs to PCs should offer a prime opportunity to further increase revenues. Relation- ship building with the VCT segment, through the creation of appropriate service tiers, should lead to upgrades to the PC level. Conversion of only 5% of VCTs (labeled as CVCTs in Table 2) into PCs over a four-year period would increase table hold by 8% without any increase in retention rates. By then increasing overall PC retention rate by an average of 2%, the overall increase in casino table games revenue would be 16%, an extra 6% over that gained without VCT conversions. As in the previous example, revenues resulting from retention are not linear. Increasing overall PC retention by 5%, after the 5% VCT conversion, can lead to an incredible 55% increase in table game revenue. Not only do revenues increase as conversion of VCTs increases, the percentage of revenue derived from MCs also drops, thus reducing the casino’s reliance on them for income. Applying the concepts of CRM and customer service tiers thus offers a simple yet compelling approach to substantially increase casino table takings.
  • 11. Customer Lifetime Value Concept to Casino Table Gaming 99 Figure 1. Taxonomy of casino customer segments Managerial Implications and Directions for Future Research Wyner (1999) maintains that three elements are needed to appreciate and practically apply the notion of customer profitability: the concept and its measurement, its link to strategy and business design, and the implementation issues that accompany it. The simple calculations presented in the previous section meet these three criteria and offer salient strategic insights for casino operators. Findings indicate that increasing PC retention rates and upgrading VCTs to PCs can substantially increase a casino’s table takings. By successfully converting 5% of VCTs to PCs, casino tables can increase their revenues by an average of 8%. VCTs closely resemble PCs in terms of gaming frequency. The more transactions or experience customers have with a company, the more likely they will be to repurchase (Bolton et al., 2000). With proper understanding of their VCT customer base, table operators should be able to determine which VCTs have the best potential for conversion. Because VCTs’ disposable incomes increase over time, conversion may be slow. It is important to learn to recognise VCTs with high conversion potential and to groom them slowly over time to become future PCs. This can be achieved through customer relationship man- agement and the development of meaningful service tiers for various segments. Customers remain loyal because of the value they receive from a company (Reichheld, 1994). However, a wide range of features that change over time drive the value that each segment receives. Individual casinos must understand the different benefits their customers derive from their services and determine how elements of their services differ in terms of customers’ value perceptions. They should then develop services to best meet individual customer segment needs, while still offering tiered incentives for upgrades by VCTs (Zeithaml et al., 2001). The drivers of the service benefits given to the PC tier should include elements that add value for both current PCs and VCTs to provide incentive to upgrade. More in-depth knowledge of the customers in each segment is required in order to develop these service tiers. Zeithaml et al. (2001) suggest that becoming
  • 12. 100 L. Watson & S. H. Kale a customer expert through technology will aid in achieving increased incidence and volume of business from a middle-tier segment such as VCT. Casinos have tremendous opportunity to monitor customers at the mid-range betting tables in order to look for regulars and track their spending habits. Astute and selective player development is crucial to tier upgrade success. A thorough understand- ing of gaming motives, perceptions of value, and service requirements across segments would allow casinos to maximise the effectiveness of service tier systems. These improved systems would, in turn, lead to higher customer retention and increased profitability. Data relating customer spending to psychographic and demographic profiles are still sparse in the casino industry. Understanding segment composition along personality dimensions—as well activities, interests, and opinions (AIOs) and demographics—would enable casino executives to have a 360-degree picture of their target markets. Such a composite picture will enable casinos to better tailor their service experience so that it is in line with their customers’ preferences and expectations. Such service-based differentiation will not only guarantee survival in a turbulent and increasingly competitive industry; it will also enhance customer retention and thus improve the bottom line. Summary This article considered the impact of LTV analysis on table games within the casino gaming industry. Based on a customer’s average bet and betting fre- quency, we disaggregated the table gaming market into four distinct customer segments. We then calculated LTV for each of the segments using aggregated industry estimates. The impact of increasing customer retention on revenues was then examined. Further analysis considered the influence on casino revenues of upgrading the ‘valued customers of tomorrow’ to ‘prime customers’. The two segments that provide the best opportunities for increased profitability are the VCTs and PCs. By increasing PC customer retention and by upgrading VCTs to PCs, not only do the casino’s profits increase, its dependence on MCs for revenues also proportionately decreases. This drastically reduces the risks MCs can pose to the short-term cash flow and long-term survival of a casino. At a time when many casinos are busy building or refurbishing multi-million dollar facilities to cater exclusively to ‘mobile customers’, this article espouses a fresh and less risky perspective. Casinos do not necessarily have to engage in one-upmanship to woo the fickle-minded high-rollers. Findings from this article, as well as earlier writings by MacDonald (2001) and Lucas et al. (2002) have established that the ‘mobile customers’ are not as attractive to a casino as was previously believed. We have demonstrated how a casino can wean its depen- dence on the MCs and still accomplish its bottom-line objectives by focusing on retention of less-risky segments instead. References Ashbrook-Nickell, J. 2002. ‘Welcome to Harrah’s’, Business 2.0, April issue [http:// www.business2.com/articles/mag/0,1640,38619,FF.html]. Berger, P.D. and Nasr, N.I. 1998. ‘Customer lifetime value: Marketing models and applications’, Journal of Interactive Marketing, 12, pp. 17–30. Bolton, R.N., Kannan, P.K. and Bramlett, M.D. 2000. ‘Implications of loyalty program membership
  • 13. Customer Lifetime Value Concept to Casino Table Gaming 101 and service experiences for customer retention and value’, Journal of the Academy of Marketing Science, 28, pp. 95–108. Cahners In-stat Group 2001. The 3 Faces of CRM: Analysis of the Worldwide Customer Relationship Management Marketplace, Part 3: Interactive CRM. Report Number EC01–07ST: pp. 1–36. Davids, M. 1999. ‘How to avoid the 10 biggest mistakes in CRM’, The Journal of Business Strategy, 20, pp. 22–6. Dowling, G.R. and Uncles, M. 1997. ‘Do customer loyalty programs really work?’, Sloan Management Review, 38(4), pp. 71–82. Fredericks, J. 2001. ‘Connecting customer loyalty to financial results’, Marketing Management, 10(1), pp. 26–32. Keller Johnson, L. 2002. ‘The real value of customer loyalty’, Sloan Management Review, 43(2), pp. 14–17. Lucas, A.F., Kilby, J. and Santos, J. 2002. ‘Assessing the profitability of premium players’, Cornell Hotel and Restaurant Administration Quarterly, 43(3), pp. 65–78. MacDonald, A. 2001. ‘Dealing with high-rollers’, posted 18 March [http://urbino.net/articles/]. Makens, J.C. and Bowen, J.T. 1994. ‘Junket reps and casino marketing’, The Cornell HRA Quarterly, 35(5), pp. 63–9. McDougall, G. 2001. ‘Customer retention strategies: When do they pay-off?’, Services Marketing Quarterly, 22(1), pp. 39–55. Nash, K. 2001. ‘Casinos hit jackpot with customer data’, Computerworld, 2 July, p. 17. Productivity Commission 2000. Australia’s Gambling Industries, Australian Government, catalogue number 9927661 [http://www.pc.gov.au/inquiry/gambling/]. Reichheld, F.F. 1994. ‘Loyalty and the renaissance of marketing’, Marketing Management, 2(4), pp. 10–22. Reichheld, F.F. 1996. The Loyalty Effect. Harvard Business School Press, Boston, MA. Reinartz, W.J. and Kumar, V. 2000. ‘On the profitability of long-life customers in a non-contractual setting: An empirical investigation and implications for marketing’, Journal of Marketing, 64, pp. 17–35. Sheth, J.N. and Sisodia, R.S. 2001. ‘High performance marketing’, Marketing Management, 10(3), pp. 18–23. Turchan, M.P. and Mateus, P. 2001. ‘The value of relationships’, Journal of Business Strategy, 22(6), pp. 29–32. Wyner, G.A. 1996. ‘Customer valuation: Linking behavior and economics’, Marketing Research, 8, pp. 36–8. Wyner, G.A. 1999. ‘Customer profitability’, Marketing Management, 8, pp. 8–9. Zeithaml, V.A., Rust, R.T. and Lemon, K.N. 2001. ‘The customer pyramid: Creating and serving profitable customers’, California Management Review, 43, pp. 118–42.