TrustArc Webinar - Stay Ahead of US State Data Privacy Law Developments
Physics Wave IRP
1. Nine Singhara
IB Physics HL
The Effect of Volume on the Period of Seiche Waves
In a Rectangular Tank
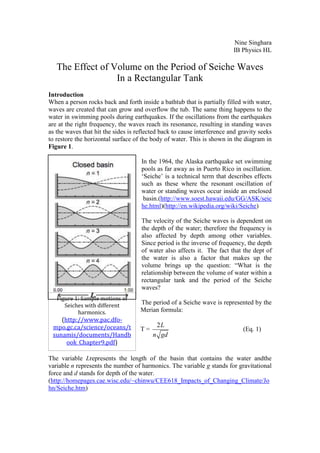
Introduction
When a person rocks back and forth inside a bathtub that is partially filled with water,
waves are created that can grow and overflow the tub. The same thing happens to the
water in swimming pools during earthquakes. If the oscillations from the earthquakes
are at the right frequency, the waves reach its resonance, resulting in standing waves
as the waves that hit the sides is reflected back to cause interference and gravity seeks
to restore the horizontal surface of the body of water. This is shown in the diagram in
Figure 1.
In the 1964, the Alaska earthquake set swimming
pools as far away as in Puerto Rico in oscillation.
‘Seiche’ is a technical term that describes effects
such as these where the resonant oscillation of
water or standing waves occur inside an enclosed
basin.(http://www.soest.hawaii.edu/GG/ASK/seic
he.html)(http://en.wikipedia.org/wiki/Seiche)
The velocity of the Seiche waves is dependent on
the depth of the water; therefore the frequency is
also affected by depth among other variables.
Since period is the inverse of frequency, the depth
of water also affects it. The fact that the dept of
the water is also a factor that makes up the
volume brings up the question: “What is the
relationship between the volume of water within a
rectangular tank and the period of the Seiche
waves?
Figure 1: Sample motions of
Seiches with different The period of a Seiche wave is represented by the
harmonics. Merian formula:
(http://www.pac.dfo-
mpo.gc.ca/science/oceans/t 2L
T= (Eq. 1)
sunamis/documents/Handb n gd
ook_Chapter9.pdf)
The variable Lrepresents the length of the basin that contains the water andthe
variable n represents the number of harmonics. The variable g stands for gravitational
force and d stands for depth of the water.
(http://homepages.cae.wisc.edu/~chinwu/CEE618_Impacts_of_Changing_Climate/Jo
hn/Seiche.htm)
2. Knowing that for a rectangular space, the volume is calculated by multiplying
together the length, width, and height, the formula can be manipulated so that the
variable d could be replaced.
V
d= (Eq. 2)
Lw
V is volume of water, L is length of the basin, and w is width of the basin, giving a
formula that could be used in this investigation:
2L
T= (Eq. 3)
gV
n
Lw
Once manipulated into a y = mx form to show the relationship between the two
variables, which are period and volume, the resulting formula becomes,
4L3w 1
T2 = ´ (Eq. 4)
n2 g V
Due to this theory, it is predicted that the period squared will be inversely
proportional to the volume. The factors that will affect the constant will be the length
and with of the basin, the number of harmonics, and gravity.
This experiment will be conducted through the simulation of the Seiche waves effects
in a rectangular tank. The motion of the waves will be recorded and position-time
graphs of the motion will be plotted on LoggerPro using the videos. A sine fit will be
used to figure out the mathematical equation of the motion. The general equation of
this is:
y = A sin (Bx + C) + D (Eq. 5)
The B value is taken from this equation to find the period using the relationship
between this B value and the period of the wave, which is given by the equation:
2p
T= (Eq. 6)
B
3. Design
Research Question: What is the relationship between the volume of water within a
rectangular tank and the period of the Seiche wave?
Variables:
The independent variable for this experiment was the volume of the water in the tank.
This was calculated using the depth of the water, the length, and the width of the tank.
The dependent variable was the period of the Seiche waves calculated by the value of
B taken from the graph of the motion of the waves that were fitted with a sine curve.
There were several factors that were kept constant throughout the experiment.
Materials and Procedure:
A medium sized rectangular glass tankwas placed on a tablewith locked wheels.
The dimensions of the tank used in this experiment are stated in the data collection
section. A clear ruler was then placed vertically to the outside of the tank so that the
zero is aligned with the bottom of the tank where the water will come in contact with
when it was poured into the tank. Taped to the left along the corner line of the longer
side of the tank, the ruler was used as a tool of reference. A big piece of white paper
was also taped to the side of the tank opposite of the ruler so the waves can be seen
clearly.
A large beaker was used to transfer some water from the sink into the tank. The
depthwas measured by looking at the ruler taped onto the tank and recorded on an
appropriate table. A stand is clamped to the same table that the tank is on. A clamp
that has a digital camera on it is attached to this stand and adjusted so that it is on the
same line of vision as the surface of the water and the frame encompasses the entire
tank. This set up is shown in Figure 2.
Figure 2: The Experimental Set-Up
4. After the experimental set up was
prepared and ready, the video
camera was switched on and put on
record. The table is then shaken
from side to side with its wheels still
locked until standing waves occur,
allowing the motion of the standing
waves to continue on by its own and
eventually subside. The rocking
back and forth of the table simulates
oscillations that occur during natural
phenomenon such as an earthquake. Figure 3: A frame from the video that
The force that was input into making captured the motion of the standing waves
the table shake and putting the body
of water into motion would vary with the different depths of water in the tank due to
the varying natural resonance frequency, which is dependent on the depth of the water
itself.
The video was switched off after a reasonable number of clean standing waves have
been recorded. The same procedure is repeated two more times with the same water
depth. Everything is then repeated with new volumes of water until data for six
different volumes are recorded.
Data Collection and Processing
Figure 4: Position-Time Graph For Waves at 8,610 cm³ For Trail 3
This is an example of the graphs plotted from the videos. The Sine curve of y =
1.819Sin(14.67t + 4.286) + 15.25is fitted through the points in the graph. The B value
is 14.67. Implications of the graph’s quality are discussed in the evaluation.
5. Table 1: Raw Data For the Depth of the Water and The ‘B’ Value Including the
Calculated Average and Uncertainty
Depth of Value of ‘B’
Water (± 0.1 units)
(± 1cm) Trial 1 Trial 2 Trial 3 Average Uncertainty
6 14.3 14.2 14.4 14.3 0.10
7 14.4 14.6 14.9 14.6 0.10
9 15.3 14.9 14.9 15.0 0.20
11 14.8 14.9 14.7 14.8 0.10
12 14.7 14.6 14.6 14.6 0.02
13 14.5 14.6 14.6 14.6 0.05
The depth of the water measured for six different values have the uncertainty of ±
0.01 m. The ‘B’ values have the uncertainty of ± 0.1 units, calculated by taking the
range of the trials and dividing it by two.
Observations:
Dimensions of the Tank
Width: 21 (± 1 cm)
Height: 27(± 1 cm)
Length: 40 (± 1 cm)
Qualitative Observations
Some waves were sloshing diagonally in the tank instead of in linear back and
forth motion between the two sides.
At some points, some water spilled out of the tank when the waves got too
large.
All volumes have standing waves of 3 harmonics; therefore the value of n is 3
for all volumes.
Table 2: Processed Data For Volume of Water and the Period Squared
Volume of Period Relative Period2 Relative
Water (± 0.1s) Uncertainty (± 0.09 s) Uncertainty
(± 3 cm3) (%) (%)
4674 0.44 23 0.19 47
5740 0.43 23 0.18 49
7462 0.42 24 0.17 51
8610 0.42 24 0.18 50
9512 0.43 23 0.18 49
10578 0.43 23 0.19 48
This table shows the independent variable, volume of water, and the dependent
variable, period, manipulated into period2in order to be graphed for a recognizable
relationship. The uncertainty of volume is ± 3 cm3 and the highest error value for
period is 24%, making the highest error value for period2 51%. The calculation of
these uncertainties is shown in the sample calculations.
6. Figure 5: The Final Graph of Volume of Water vs. Period2
The volume’s uncertainty of ± 3 cm3 is negligible in this graph, whereas the error bar
for the period2 is very large 51 percent error. When a curve that goes through all the
data points is fitted, the relationship turns out to be quadratic with the equation of y=
1.392x2-2.204x+0.2652. This relationship however, does not fit the theory that the
volume will be inversely proportional to period2.
Figure 6: The Final Graph of Volume of Water vs. Period2 Inverse Curve
When an inverse curve is fitted through the graph, due to the large error bars, the
curve still goes through all of them. Therefore, this relationship given by the equation
y= can be considered valid, although inconclusive. Theoretically, the A value of
1214 should be equal to the constantrepresented by 4L w .
3
n2g
7. Sample Calculations
Uncertainty of Value ‘B’
Using Data From Depth of 6 cm
Maximum - Minimum 14.4 -14.2
UB = = = 0.1
2 2
Volume of Water
Using Dimensions of Tank and Average Depth of Water From Depth of 6 cm
V = Width ´ Length ´ Depth = (21±1)´(40 ±1)´(6 ±1) = 4674 ± 3
Uncertainty
UV = Uw +UL +UD = 1+1+1 = 3
Period of Waves
Using Average ‘B’ Value from Depth of 6 cm
2p 2p
T= = = 0.439 ± 0.1
B 14.3± 0.1
UT 0.1
Relative Uncertainty = = = 23%
T 0.439
Uncertainty of Period2 of Waves
Using Highest Uncertainty of Period for Volume of 4674 cm3
UT 2 = % Uncertainty of T + % Uncertainty of T = 24+24 = 48%
Period
Absolute Uncertainty = ´ 48 = 0.09
100
UT 0.09
Relative Uncertainty of Period2 = = = 47%
T 0.19
Expected Constant (Value of ‘A’) For Graph In Figure 6
Using the Known Measured Values
4L3w = 4(40)3 (21) = 60,890
n2g (3)2 (9.81)
Theoretical - Experimental
Percent Error For ‘A’ Value = ´100 = 98%
Theoretical
8. Conclusion
The aim of this experiment was to investigate the relationship between the volume of
the water within a rectangular tank and the period of the standing Seiche waves
created by the simulation of oscillations. The results for this experiment are
inconclusive. According to the Volume vs. Period2graph in Figure 5, the curve that
fits all the points best is of equation y= 1.392×10-9x2-2.204×10⁻⁵x+0.2652. This
makes the relationship between the two variables a quadratic one where in shallow
depths; the period2 decreases exponentially as volume increases, and in greater
depths, the period2 increases exponentially as volume increases. The vertex, which
lies somewhere between 7,000 and 8,000 cm2, suggests the turning point where this
change in the trend of their relationship occurs. This relationship very much possible,
however, with the large window of error of 51%, this data is unreliable. Other curves
could easily be drawn to fit within the span of the error bars, making other
possibilities valid as well. The graph in Figure 6 is fitted with an inverse curve, the
theoretically predicted relationship between the volume and the period2. The curve
equation of y= , with 1214 as the value of ‘A’ is easily contained within the
range of the error bars, which although does not to any extent conclude the theory that
the relationship between the two variables would be that of an inverse proportion,
does not disprove it. However, the expected value for this constant A is 60,890,
making the experimental error for the constant a solid 98%. This extremely high value
indicates the unreliability of the outcome in regards to the theory. This makes the data
acquired noticeably inaccurate, and also makes it almost impossible to identify its
precision.
Evaluation
There are several weaknesses and limitations to the procedure of this experiment. The
first weakness was due to the method of the shaking of the table. Although the
direction at which force was applied to put the water waves into motion was along the
long side of the tank, it did not completely go toward that direction. The table’s
locked wheels sometimes rotate around due to the asserted force and the shaking
ended up going in a diagonal direction rather than straight back and forth. This caused
the waves to slosh diagonally inside the tank, interfering with the initial standing
waves that have formed a visible line of motion along the glass tank. The resulting
waves are at times much higher and at times much lower than expected as seen on the
sample graph in Figure 4.A way to reduce this error is to put one side of the table up
against a stable flat surface such as the wall and shake the table from side to side,
keeping it aligned with the surface.
Another weakness within this experiment is the plotting of the graph made difficult by
the aforementioned weakness as well as the some waves that did not form a
distinguished line of its motion on the glass. With no clear wave line, it is very
difficult to know where on the spread out space to plot. The method used to determine
where to plot the graph is by eye and is naturally inaccurate. This causes the quality of
the graph plotted to be low due to the inconsistencies as seen in Figure 4. One
possible method to eliminate this error is to pick a period of time where theSeiche
waves made create more or less clean waves that form clean lines on the glass tank to
plot a graph from.