SlideShare une entreprise Scribd logo
1  sur  14
Télécharger pour lire hors ligne
Quartic Training – Class Workbook, CFA Level I


                                Generalised TVM diagram

                   PMT           PMT          PMT        PMT                 PMT      PMT
BGN mode:

                    PV                                                                         FV
                    T0           T1            T2         T3                 TN-2     TN-1     TN
                      Q4


                    PV                                                                         FV

END mode:
                                 PMT          PMT        PMT                 PMT      PMT     PMT


                     Quartic Quote: “N and PMT describe N payments” (doh!)


   LOS 5.c: Calculate and interpret the FV and      Time Value of Money
   PV of … an ordinary annuity … an annuity due …            1


                                                               1                    © Quartic Training Limited
Quartic Training – Class Workbook, CFA Level I


                                            NPV and IRR
For a normal project (cash outflow followed by inflows) one would expect a lower
NPV for higher discount rates. Graphically:

                           NPV


                                                            IRR = 6.96%

                           $24
                                                                     Discount rate
                                 Q4


                                              6%                  10%


                         $(72)


 LOS 6.a: calculate and interpret NPV   Discounted Cash Flow Applications
 and IRR, contrasting NPV to IRR …                     2


                                                       2                             © Quartic Training Limited
Quartic Training – Class Workbook, CFA Level I


                        Graphical presentation of data
 Frequency polygon and cumulative frequency:                                                                   Histogram:

40                                                                     9

35                                                                     8

                                                                       7
30

                                                                       6
25
                                                                       5
                                                      Frequenc y
20                                                                                                                                                  Frequency
                                                      Cum Freq
                                                                       4
15
                                                                       3
10
                                                                       2

 5                                                                     1

 0                                                                     0
     0       5          10          15         20                          0   1   2   3   4   5   6   7   8   9 10 11 12 13 14 15 16 17 18 19 20


For more detailed data graphs (in particular with continuous scales) presentation by interval may
be more useful. For instance the scores could be grouped into 5% intervals (0 to 5%, 5 to 10% etc).


 LOS 7.c: analyze and interpret a histogram or a    Statistical Concepts
 frequency polygon                                            3


                                                                   3                                                            © Quartic Training Limited
Quartic Training – Class Workbook, CFA Level I


                        Kurtosis in return distributions
Kurtosis (K) describes the shape of a distribution relative to the normal distribution.
In particular:
- a leptokurtic distribution has more small and more large deviations (note K > 3)
- a platykurtic distribution has fewer small and fewer large deviations (K < 3)
- a mesokurtic distribution has similar small/large deviations by comparison to normal (K = 3).


                                                                      Definition:
                                                                      excess kurtosis = kurtosis – 3
             Leptokurtic distribution


             Normal distribution


                                                               Q4


 LOS 7.j: define and interpret kurtosis, and   Statistical Concepts
 measures of population and sample kurtosis              4


                                                       4                           © Quartic Training Limited
Quartic Training – Class Workbook, CFA Level I


     Portfolio variance: the Quartic Covariance Matrix
 The portfolio variance can be thought of as a weighted average covariance of the various
 assets. The following diagram should help you to understand:
                    wa                    wb


                                                                        Now just add them up:
                                                 wawbcova,b
                                                                          2    2    2   2    2
wa                       wa2σa2                                         p  wa a  wb b  2wawb cov a,b
                                                       or
                                                                          2     2   2   2    2
                                                 wawbρa,bσaσb           p  wa a  wb b  2wawb a,b ab


                     wawbcova,b
wb                           or                     wb2σb2
                     wawbρa,bσaσb

     LOS 8.k: calculate and interpret expected   Probability Concepts
     value, variance & standard deviation                  5


                                                            5                               © Quartic Training Limited
Quartic Training – Class Workbook, CFA Level I


                Binomial tree for stock price movements
Continuing the previous stock price example, suppose that the stock starts at 100. Each
day, the price either rises, say by 5% (the “up factor”, U = 1.05), or falls by 4.76% (the
“down factor”, D = 1/1.05 = 0.9524). We can use this to model the movement over a
number of days, as follows:
                                                                                     115.76   P(3U) = 0.63 x 0.40 x 3C3
                                                                           0. 6
                                                                        p=                    = 0.216
                                                           110.25       1-p
                                               0. 6                         =0
                                            p=                                .4
                                                                                              P(2U,1D) = 0.62 x 0.41 x 3C2
                              105          1-p                                        105
                0. 6                           =0                          0. 6               = 0.432
             p=                                  .4                     p=
100         1-p                                             100         1-p
                                               0. 6
      Q4


                =0                                                            =0
                  .4                        p=                                  .4
                                                                                              P(1U,2D) = 0.61 x 0.42 x 3C1
                             95.24         1-p                                       95.24
                                               =0                          0. 6               = 0.288
                                                 .4                     p=
                                                            90.70       1-p
                                                                            =0
                                                                              .4
                                                                                     86.38    P(3D) = 0.60 x 0.43 x 3C0
                                                                                              = 0.064
              After 3 days, there are 4 possible prices:
      LOS 9.d: … construct a binomial tree to         Probability Distributions
      describe stock price movement                               6


                                                                    6                              © Quartic Training Limited
Quartic Training – Class Workbook, CFA Level I


                      Normal distribution and probabilities
 We can calculate the probability of a random variable falling within a range by using the normal
 distribution probability tables. There are two forms for these (note these are excerpts only):

 P(Z < z)         z         0.00     0.01     0.04       0.05     0.06
                      0.0   0.5000   0.5040   0.5160    0.5199    0.5239
                      0.1   0.5398   0.5438   0.5557    0.5596    0.5636
                      0.2   0.5793   0.5832   0.5948    0.5987    0.6026
                      0.3   0.6179   0.6217   0.6331    0.6368    0.6406
                      0.4   0.6554   0.6591   0.6700    0.6736    0.6772
                      1.0   0.8413   0.8438   0.8508    0.8531    0.8554            Q4


                      1.6   0.9452   0.9463   0.9495    0.9505    0.9515           Z=0     z
                      1.9   0.9713   0.9719   0.9738    0.9744    0.9750


P(0 < Z < z)      z         0.00     0.01     0.04       0.05     0.06
                      0.0   0.0000   0.0040   0.0160     0.0199   0.0239
                      0.1   0.0398   0.0438   0.0557     0.0596   0.0636
                      0.2   0.0793   0.0832   0.0948     0.0987   0.1026
                      0.3   0.1179   0.1217   0.1331     0.1368   0.1406
                      0.4   0.1554   0.1591   0.1700     0.1736   0.1772
                      1.0   0.3413   0.3438   0.3508     0.3531   0.3554            Q4


                      1.6   0.4452   0.4463   0.4495     0.4505   0.4515           Z=0     z
                      1.9   0.4713   0.4719   0.4738     0.4744   0.4750


    LOS 9.h: Define standard normal dist’n,            Probability Distributions
    explain how to standardize, calc/interp probs                  7


                                                                     7                   © Quartic Training Limited
Quartic Training – Class Workbook, CFA Level I


                                                  Reading the t-tables
         The t-tables are read in the opposite way to the z-tables. Remember for the normal
         distribution you specify the number of standard deviations and look up the probability.
         For t, you specify the probability (in fact, significance) and look up standard deviations.
1-tailed significance:         0.1     0.05     0.025    0.01      0.005    0.0005
2-tailed significance:         0.2     0.1      0.05     0.02      0.01     0.001
Degrees of freedom:       1    3.078    6.314   12.706   31.821    63.657   636.619
                                                                                      Example
                          2    1.886    2.920    4.303    6.965     9.925    31.599
                                                                                      for sample
                          3    1.638    2.353    3.182    4.541     5.841    12.924
                                                                                      size 30:
                          4    1.533    2.132    2.776    3.747     4.604    8.610
                          5    1.476    2.015    2.571    3.365     4.032    6.869
                          6    1.440    1.943    2.447    3.143     3.707    5.959
                          7    1.415    1.895    2.365    2.998     3.499    5.408
                         10    1.372    1.812    2.228    2.764     3.169    4.587
                         24    1.318    1.711    2.064    2.492     2.797    3.745
                                                                                                          Q4


                         25    1.316    1.708    2.060    2.485     2.787    3.725
                         29    1.311    1.699    2.045    2.462     2.756    3.659
                                                                                                   z value = ±1.96
                         30    1.310    1.697    2.042    2.457     2.750    3.646
                         60    1.296    1.671    2.000    2.390     2.660    3.460                 t value = ±2.045
                         120   1.289    1.658    1.980    2.358     2.617    3.373

                          ∞    1.282    1.645    1.960    2.327     2.576    3.292    What happens to t value as n gets larger?

        LOS 10.i: Describe the properties of Student’s t-       Sampling & Estimation
        distribution & calc/interp its degrees of freedom                8


                                                                            8                                  © Quartic Training Limited
Quartic Training – Class Workbook, CFA Level I


                         Linear regression: the basics
 Linear regression is the process of identifying the “line of best fit” that most accurately
 demonstrates the component of movement in the dependent variable (shown as the Y-axis)
 that is “explained” by movement in the independent variable (X-axis).
                       Return on
                                                                    Line is of the form
Dependent              share (Y)
 variable                                                              Y = b0 + b1 X
                         2
                                                               b0 and b1 are the regression coefficients:
                                                               •      b0 is the intercept coefficient
                         1
                                                               •      b1 is the slope coefficient

                             Q4
                                                                   Return on
         -2       -1                1      2    3        4         market (X)


                        -1
                                                                        Independent variable


LOS 12.d: Differentiate between the
dependent and independent variables in a   Correlation & Regression
linear regression …                                    9


                                                     9                                    © Quartic Training Limited
Quartic Training – Class Workbook, CFA Level I


                      Ratio analysis: internal liquidity/4
The cash conversion cycle shows how long it takes from when cash is paid by the
company until cash is received back into the company.
                                                                                Cash received

                                  Inventory                 Receivable
              Asset
                          Q4


            Liability
                                         Payable
                                                              Cash conversion
                                                                   cycle
               Purchase                        Cash paid

As can be seen, the cash conversion cycle is                     For Conduit Inc:
=         inventory processing period                            =       51 days
+         receivables collection period                          +       47 days
–         payables payment period                                –       65 days
                                                                 =       33 days
    LOS 38.c: Calculate, interpret and
    discuss the uses of measures of a      Analysis of Financial Statements
    company’s internal liquidity…                          10


                                                         10                             © Quartic Training Limited
Quartic Training – Class Workbook, CFA Level I

                                                                                                       Solution 13


                         Impact of depreciation method
Financial statements and ratios are impacted by whether a firm uses straight line or
accelerated methods of depreciation.
The balance sheet will always be lower under accelerated methods; the income
statement will initially be lower under accelerated depreciation, though this will reverse
in later years (unless the company invests in new equipment).
                                                              NBV
        Item                  SL            Accel
   Total assets                              
     Liabilities             same            same                                    SL
       Equity                                
                                                                              SoYD
  Operating exps                             
                                                                        DDB
     EBIT & NI                                        Residual
                                                          value
    RoA & RoE                                
        CFO*                 same            same
                                                                   Q4


                                                              Quartic Quote: on the graph, asset values are
* This assumes we are looking only at a change                the NBV and you can think of depreciation as
   in accounting method (i.e. no tax change).                 the slope of the graph. Steep = higher expense.
  LOS 43.a: ... Discuss how the choice of
  depreciation method affects a             Long-Term Assets: Depreciation
  company’s f/s, ratios and taxes                        11


                                                         11                               © Quartic Training Limited
Quartic Training – Class Workbook, CFA Level I


                     Mortgage passthrough securities
 These are securities collateralized by mortgages loans. Payments by borrowers consist of
 (1) interest, (2) principal repayments and (3) curtailments or principal prepayments.


           Mortgage                                                MPS 1


                                                                                      INVESTORS
                                       Mortgage
           Mortgage                                                MPS 2   Q4


                                         pool


           Mortgage                                                MPS 3


 Although cash flows are monthly, payment amounts are uncertain. The level and timing of
 prepayments is unknown and is the source of much of the risk for investors. Prepayment risk
 increases as yields fall.


LOS 67.f: Describe mortgage-backed       Bond Sectors and Instruments
securities … explain the cash flows,
prepayments and prepayment risk                       12


                                                     12                         © Quartic Training Limited
Quartic Training – Class Workbook, CFA Level I


                         Elasticity and Total Revenue
From the seller’s point of view, the elasticity of demand for a product determines the
likely effect on the total revenue that a shift in price will cause. Looking at the revenue
of the product from previous slide:
Revenue                                                                          Looking from the consumer’s
                           Maximum Revenue                                       point of view, the amount the
1300
                                                                                 seller earns as revenue becomes
1200                                                                             an expenditure for the consumer.


                                                  Di as
                                                    re pr
                                                      ct ic
1000


                                                        io e
                                                          n
 800


                                                            of ncr
                                                              m eas
                                                               i
                                                                 ov e
 600           In the elastic         In the inelastic


                                                                   em s
               region,                region,


                                                                     en
 400           increasing             increasing


                                                                        t
               price decreases        price increases
 200
               total revenue          total revenue
       Q4


                                                                            Quantity
   0           20         40     50     60         80            100

Quartic Quote: In the inelastic region, change in revenue and change in price are in the same
direction; in the elastic region, change in revenue and change in price are in opposite directions.

LOS 13.a: …explain the difference between                  Elasticity
inelastic and elastic demand…                                 13


                                                               13                                   © Quartic Training Limited
Quartic Training – Class Workbook, CFA Level I


                    Maximising Aggregate Surpluses
Marginal social benefit (MSB) is the sum of each consumer’s marginal benefit.
Similarly Marginal social cost (MSC) is the sum of each suppliers marginal costs from
producing the product.

Within the shaded region, the                Price
                                                        Aggregate
aggregate of surpluses increases                     Consumer Surplus
with quantity.

Beyond the equilibrium quantity,
MSC will exceed MSB.                                                           Equilibrium
                                                                                  Price
Both aggregate surpluses are at
their maximum at the equilibrium
point. The market is therefore                          Aggregate
most efficient at this point.                        Producer Surplus
                                                Q4


                                                                 Equilibrium             Quantity
                                                                  Quantity


LOS 14.d: discuss the relationship between
consumer surplus, producer surplus and
                                             Efficiency and Equity
equilibrium.                                           14


                                                       14                         © Quartic Training Limited

Contenu connexe

En vedette

2024 State of Marketing Report – by Hubspot
2024 State of Marketing Report – by Hubspot2024 State of Marketing Report – by Hubspot
2024 State of Marketing Report – by HubspotMarius Sescu
 
Everything You Need To Know About ChatGPT
Everything You Need To Know About ChatGPTEverything You Need To Know About ChatGPT
Everything You Need To Know About ChatGPTExpeed Software
 
Product Design Trends in 2024 | Teenage Engineerings
Product Design Trends in 2024 | Teenage EngineeringsProduct Design Trends in 2024 | Teenage Engineerings
Product Design Trends in 2024 | Teenage EngineeringsPixeldarts
 
How Race, Age and Gender Shape Attitudes Towards Mental Health
How Race, Age and Gender Shape Attitudes Towards Mental HealthHow Race, Age and Gender Shape Attitudes Towards Mental Health
How Race, Age and Gender Shape Attitudes Towards Mental HealthThinkNow
 
AI Trends in Creative Operations 2024 by Artwork Flow.pdf
AI Trends in Creative Operations 2024 by Artwork Flow.pdfAI Trends in Creative Operations 2024 by Artwork Flow.pdf
AI Trends in Creative Operations 2024 by Artwork Flow.pdfmarketingartwork
 
PEPSICO Presentation to CAGNY Conference Feb 2024
PEPSICO Presentation to CAGNY Conference Feb 2024PEPSICO Presentation to CAGNY Conference Feb 2024
PEPSICO Presentation to CAGNY Conference Feb 2024Neil Kimberley
 
Content Methodology: A Best Practices Report (Webinar)
Content Methodology: A Best Practices Report (Webinar)Content Methodology: A Best Practices Report (Webinar)
Content Methodology: A Best Practices Report (Webinar)contently
 
How to Prepare For a Successful Job Search for 2024
How to Prepare For a Successful Job Search for 2024How to Prepare For a Successful Job Search for 2024
How to Prepare For a Successful Job Search for 2024Albert Qian
 
Social Media Marketing Trends 2024 // The Global Indie Insights
Social Media Marketing Trends 2024 // The Global Indie InsightsSocial Media Marketing Trends 2024 // The Global Indie Insights
Social Media Marketing Trends 2024 // The Global Indie InsightsKurio // The Social Media Age(ncy)
 
Trends In Paid Search: Navigating The Digital Landscape In 2024
Trends In Paid Search: Navigating The Digital Landscape In 2024Trends In Paid Search: Navigating The Digital Landscape In 2024
Trends In Paid Search: Navigating The Digital Landscape In 2024Search Engine Journal
 
5 Public speaking tips from TED - Visualized summary
5 Public speaking tips from TED - Visualized summary5 Public speaking tips from TED - Visualized summary
5 Public speaking tips from TED - Visualized summarySpeakerHub
 
ChatGPT and the Future of Work - Clark Boyd
ChatGPT and the Future of Work - Clark Boyd ChatGPT and the Future of Work - Clark Boyd
ChatGPT and the Future of Work - Clark Boyd Clark Boyd
 
Getting into the tech field. what next
Getting into the tech field. what next Getting into the tech field. what next
Getting into the tech field. what next Tessa Mero
 
Google's Just Not That Into You: Understanding Core Updates & Search Intent
Google's Just Not That Into You: Understanding Core Updates & Search IntentGoogle's Just Not That Into You: Understanding Core Updates & Search Intent
Google's Just Not That Into You: Understanding Core Updates & Search IntentLily Ray
 
Time Management & Productivity - Best Practices
Time Management & Productivity -  Best PracticesTime Management & Productivity -  Best Practices
Time Management & Productivity - Best PracticesVit Horky
 
The six step guide to practical project management
The six step guide to practical project managementThe six step guide to practical project management
The six step guide to practical project managementMindGenius
 
Beginners Guide to TikTok for Search - Rachel Pearson - We are Tilt __ Bright...
Beginners Guide to TikTok for Search - Rachel Pearson - We are Tilt __ Bright...Beginners Guide to TikTok for Search - Rachel Pearson - We are Tilt __ Bright...
Beginners Guide to TikTok for Search - Rachel Pearson - We are Tilt __ Bright...RachelPearson36
 

En vedette (20)

2024 State of Marketing Report – by Hubspot
2024 State of Marketing Report – by Hubspot2024 State of Marketing Report – by Hubspot
2024 State of Marketing Report – by Hubspot
 
Everything You Need To Know About ChatGPT
Everything You Need To Know About ChatGPTEverything You Need To Know About ChatGPT
Everything You Need To Know About ChatGPT
 
Product Design Trends in 2024 | Teenage Engineerings
Product Design Trends in 2024 | Teenage EngineeringsProduct Design Trends in 2024 | Teenage Engineerings
Product Design Trends in 2024 | Teenage Engineerings
 
How Race, Age and Gender Shape Attitudes Towards Mental Health
How Race, Age and Gender Shape Attitudes Towards Mental HealthHow Race, Age and Gender Shape Attitudes Towards Mental Health
How Race, Age and Gender Shape Attitudes Towards Mental Health
 
AI Trends in Creative Operations 2024 by Artwork Flow.pdf
AI Trends in Creative Operations 2024 by Artwork Flow.pdfAI Trends in Creative Operations 2024 by Artwork Flow.pdf
AI Trends in Creative Operations 2024 by Artwork Flow.pdf
 
Skeleton Culture Code
Skeleton Culture CodeSkeleton Culture Code
Skeleton Culture Code
 
PEPSICO Presentation to CAGNY Conference Feb 2024
PEPSICO Presentation to CAGNY Conference Feb 2024PEPSICO Presentation to CAGNY Conference Feb 2024
PEPSICO Presentation to CAGNY Conference Feb 2024
 
Content Methodology: A Best Practices Report (Webinar)
Content Methodology: A Best Practices Report (Webinar)Content Methodology: A Best Practices Report (Webinar)
Content Methodology: A Best Practices Report (Webinar)
 
How to Prepare For a Successful Job Search for 2024
How to Prepare For a Successful Job Search for 2024How to Prepare For a Successful Job Search for 2024
How to Prepare For a Successful Job Search for 2024
 
Social Media Marketing Trends 2024 // The Global Indie Insights
Social Media Marketing Trends 2024 // The Global Indie InsightsSocial Media Marketing Trends 2024 // The Global Indie Insights
Social Media Marketing Trends 2024 // The Global Indie Insights
 
Trends In Paid Search: Navigating The Digital Landscape In 2024
Trends In Paid Search: Navigating The Digital Landscape In 2024Trends In Paid Search: Navigating The Digital Landscape In 2024
Trends In Paid Search: Navigating The Digital Landscape In 2024
 
5 Public speaking tips from TED - Visualized summary
5 Public speaking tips from TED - Visualized summary5 Public speaking tips from TED - Visualized summary
5 Public speaking tips from TED - Visualized summary
 
ChatGPT and the Future of Work - Clark Boyd
ChatGPT and the Future of Work - Clark Boyd ChatGPT and the Future of Work - Clark Boyd
ChatGPT and the Future of Work - Clark Boyd
 
Getting into the tech field. what next
Getting into the tech field. what next Getting into the tech field. what next
Getting into the tech field. what next
 
Google's Just Not That Into You: Understanding Core Updates & Search Intent
Google's Just Not That Into You: Understanding Core Updates & Search IntentGoogle's Just Not That Into You: Understanding Core Updates & Search Intent
Google's Just Not That Into You: Understanding Core Updates & Search Intent
 
How to have difficult conversations
How to have difficult conversations How to have difficult conversations
How to have difficult conversations
 
Introduction to Data Science
Introduction to Data ScienceIntroduction to Data Science
Introduction to Data Science
 
Time Management & Productivity - Best Practices
Time Management & Productivity -  Best PracticesTime Management & Productivity -  Best Practices
Time Management & Productivity - Best Practices
 
The six step guide to practical project management
The six step guide to practical project managementThe six step guide to practical project management
The six step guide to practical project management
 
Beginners Guide to TikTok for Search - Rachel Pearson - We are Tilt __ Bright...
Beginners Guide to TikTok for Search - Rachel Pearson - We are Tilt __ Bright...Beginners Guide to TikTok for Search - Rachel Pearson - We are Tilt __ Bright...
Beginners Guide to TikTok for Search - Rachel Pearson - We are Tilt __ Bright...
 

Sample Quartic slides, Level I CFA

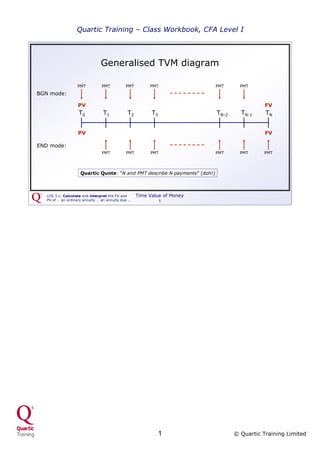
  • 1. Quartic Training – Class Workbook, CFA Level I Generalised TVM diagram PMT PMT PMT PMT PMT PMT BGN mode: PV FV T0 T1 T2 T3 TN-2 TN-1 TN Q4 PV FV END mode: PMT PMT PMT PMT PMT PMT Quartic Quote: “N and PMT describe N payments” (doh!) LOS 5.c: Calculate and interpret the FV and Time Value of Money PV of … an ordinary annuity … an annuity due … 1 1 © Quartic Training Limited
  • 2. Quartic Training – Class Workbook, CFA Level I NPV and IRR For a normal project (cash outflow followed by inflows) one would expect a lower NPV for higher discount rates. Graphically: NPV IRR = 6.96% $24 Discount rate Q4 6% 10% $(72) LOS 6.a: calculate and interpret NPV Discounted Cash Flow Applications and IRR, contrasting NPV to IRR … 2 2 © Quartic Training Limited
  • 3. Quartic Training – Class Workbook, CFA Level I Graphical presentation of data Frequency polygon and cumulative frequency: Histogram: 40 9 35 8 7 30 6 25 5 Frequenc y 20 Frequency Cum Freq 4 15 3 10 2 5 1 0 0 0 5 10 15 20 0 1 2 3 4 5 6 7 8 9 10 11 12 13 14 15 16 17 18 19 20 For more detailed data graphs (in particular with continuous scales) presentation by interval may be more useful. For instance the scores could be grouped into 5% intervals (0 to 5%, 5 to 10% etc). LOS 7.c: analyze and interpret a histogram or a Statistical Concepts frequency polygon 3 3 © Quartic Training Limited
  • 4. Quartic Training – Class Workbook, CFA Level I Kurtosis in return distributions Kurtosis (K) describes the shape of a distribution relative to the normal distribution. In particular: - a leptokurtic distribution has more small and more large deviations (note K > 3) - a platykurtic distribution has fewer small and fewer large deviations (K < 3) - a mesokurtic distribution has similar small/large deviations by comparison to normal (K = 3). Definition: excess kurtosis = kurtosis – 3 Leptokurtic distribution Normal distribution Q4 LOS 7.j: define and interpret kurtosis, and Statistical Concepts measures of population and sample kurtosis 4 4 © Quartic Training Limited
  • 5. Quartic Training – Class Workbook, CFA Level I Portfolio variance: the Quartic Covariance Matrix The portfolio variance can be thought of as a weighted average covariance of the various assets. The following diagram should help you to understand: wa wb Now just add them up: wawbcova,b 2 2 2 2 2 wa wa2σa2 p  wa a  wb b  2wawb cov a,b or 2 2 2 2 2 wawbρa,bσaσb p  wa a  wb b  2wawb a,b ab wawbcova,b wb or wb2σb2 wawbρa,bσaσb LOS 8.k: calculate and interpret expected Probability Concepts value, variance & standard deviation 5 5 © Quartic Training Limited
  • 6. Quartic Training – Class Workbook, CFA Level I Binomial tree for stock price movements Continuing the previous stock price example, suppose that the stock starts at 100. Each day, the price either rises, say by 5% (the “up factor”, U = 1.05), or falls by 4.76% (the “down factor”, D = 1/1.05 = 0.9524). We can use this to model the movement over a number of days, as follows: 115.76 P(3U) = 0.63 x 0.40 x 3C3 0. 6 p= = 0.216 110.25 1-p 0. 6 =0 p= .4 P(2U,1D) = 0.62 x 0.41 x 3C2 105 1-p 105 0. 6 =0 0. 6 = 0.432 p= .4 p= 100 1-p 100 1-p 0. 6 Q4 =0 =0 .4 p= .4 P(1U,2D) = 0.61 x 0.42 x 3C1 95.24 1-p 95.24 =0 0. 6 = 0.288 .4 p= 90.70 1-p =0 .4 86.38 P(3D) = 0.60 x 0.43 x 3C0 = 0.064 After 3 days, there are 4 possible prices: LOS 9.d: … construct a binomial tree to Probability Distributions describe stock price movement 6 6 © Quartic Training Limited
  • 7. Quartic Training – Class Workbook, CFA Level I Normal distribution and probabilities We can calculate the probability of a random variable falling within a range by using the normal distribution probability tables. There are two forms for these (note these are excerpts only): P(Z < z) z 0.00 0.01 0.04 0.05 0.06 0.0 0.5000 0.5040 0.5160 0.5199 0.5239 0.1 0.5398 0.5438 0.5557 0.5596 0.5636 0.2 0.5793 0.5832 0.5948 0.5987 0.6026 0.3 0.6179 0.6217 0.6331 0.6368 0.6406 0.4 0.6554 0.6591 0.6700 0.6736 0.6772 1.0 0.8413 0.8438 0.8508 0.8531 0.8554 Q4 1.6 0.9452 0.9463 0.9495 0.9505 0.9515 Z=0 z 1.9 0.9713 0.9719 0.9738 0.9744 0.9750 P(0 < Z < z) z 0.00 0.01 0.04 0.05 0.06 0.0 0.0000 0.0040 0.0160 0.0199 0.0239 0.1 0.0398 0.0438 0.0557 0.0596 0.0636 0.2 0.0793 0.0832 0.0948 0.0987 0.1026 0.3 0.1179 0.1217 0.1331 0.1368 0.1406 0.4 0.1554 0.1591 0.1700 0.1736 0.1772 1.0 0.3413 0.3438 0.3508 0.3531 0.3554 Q4 1.6 0.4452 0.4463 0.4495 0.4505 0.4515 Z=0 z 1.9 0.4713 0.4719 0.4738 0.4744 0.4750 LOS 9.h: Define standard normal dist’n, Probability Distributions explain how to standardize, calc/interp probs 7 7 © Quartic Training Limited
  • 8. Quartic Training – Class Workbook, CFA Level I Reading the t-tables The t-tables are read in the opposite way to the z-tables. Remember for the normal distribution you specify the number of standard deviations and look up the probability. For t, you specify the probability (in fact, significance) and look up standard deviations. 1-tailed significance: 0.1 0.05 0.025 0.01 0.005 0.0005 2-tailed significance: 0.2 0.1 0.05 0.02 0.01 0.001 Degrees of freedom: 1 3.078 6.314 12.706 31.821 63.657 636.619 Example 2 1.886 2.920 4.303 6.965 9.925 31.599 for sample 3 1.638 2.353 3.182 4.541 5.841 12.924 size 30: 4 1.533 2.132 2.776 3.747 4.604 8.610 5 1.476 2.015 2.571 3.365 4.032 6.869 6 1.440 1.943 2.447 3.143 3.707 5.959 7 1.415 1.895 2.365 2.998 3.499 5.408 10 1.372 1.812 2.228 2.764 3.169 4.587 24 1.318 1.711 2.064 2.492 2.797 3.745 Q4 25 1.316 1.708 2.060 2.485 2.787 3.725 29 1.311 1.699 2.045 2.462 2.756 3.659 z value = ±1.96 30 1.310 1.697 2.042 2.457 2.750 3.646 60 1.296 1.671 2.000 2.390 2.660 3.460 t value = ±2.045 120 1.289 1.658 1.980 2.358 2.617 3.373 ∞ 1.282 1.645 1.960 2.327 2.576 3.292 What happens to t value as n gets larger? LOS 10.i: Describe the properties of Student’s t- Sampling & Estimation distribution & calc/interp its degrees of freedom 8 8 © Quartic Training Limited
  • 9. Quartic Training – Class Workbook, CFA Level I Linear regression: the basics Linear regression is the process of identifying the “line of best fit” that most accurately demonstrates the component of movement in the dependent variable (shown as the Y-axis) that is “explained” by movement in the independent variable (X-axis). Return on Line is of the form Dependent share (Y) variable Y = b0 + b1 X 2 b0 and b1 are the regression coefficients: • b0 is the intercept coefficient 1 • b1 is the slope coefficient Q4 Return on -2 -1 1 2 3 4 market (X) -1 Independent variable LOS 12.d: Differentiate between the dependent and independent variables in a Correlation & Regression linear regression … 9 9 © Quartic Training Limited
  • 10. Quartic Training – Class Workbook, CFA Level I Ratio analysis: internal liquidity/4 The cash conversion cycle shows how long it takes from when cash is paid by the company until cash is received back into the company. Cash received Inventory Receivable Asset Q4 Liability Payable Cash conversion cycle Purchase Cash paid As can be seen, the cash conversion cycle is For Conduit Inc: = inventory processing period = 51 days + receivables collection period + 47 days – payables payment period – 65 days = 33 days LOS 38.c: Calculate, interpret and discuss the uses of measures of a Analysis of Financial Statements company’s internal liquidity… 10 10 © Quartic Training Limited
  • 11. Quartic Training – Class Workbook, CFA Level I Solution 13 Impact of depreciation method Financial statements and ratios are impacted by whether a firm uses straight line or accelerated methods of depreciation. The balance sheet will always be lower under accelerated methods; the income statement will initially be lower under accelerated depreciation, though this will reverse in later years (unless the company invests in new equipment). NBV Item SL Accel Total assets   Liabilities same same SL Equity   SoYD Operating exps   DDB EBIT & NI   Residual value RoA & RoE   CFO* same same Q4 Quartic Quote: on the graph, asset values are * This assumes we are looking only at a change the NBV and you can think of depreciation as in accounting method (i.e. no tax change). the slope of the graph. Steep = higher expense. LOS 43.a: ... Discuss how the choice of depreciation method affects a Long-Term Assets: Depreciation company’s f/s, ratios and taxes 11 11 © Quartic Training Limited
  • 12. Quartic Training – Class Workbook, CFA Level I Mortgage passthrough securities These are securities collateralized by mortgages loans. Payments by borrowers consist of (1) interest, (2) principal repayments and (3) curtailments or principal prepayments. Mortgage MPS 1 INVESTORS Mortgage Mortgage MPS 2 Q4 pool Mortgage MPS 3 Although cash flows are monthly, payment amounts are uncertain. The level and timing of prepayments is unknown and is the source of much of the risk for investors. Prepayment risk increases as yields fall. LOS 67.f: Describe mortgage-backed Bond Sectors and Instruments securities … explain the cash flows, prepayments and prepayment risk 12 12 © Quartic Training Limited
  • 13. Quartic Training – Class Workbook, CFA Level I Elasticity and Total Revenue From the seller’s point of view, the elasticity of demand for a product determines the likely effect on the total revenue that a shift in price will cause. Looking at the revenue of the product from previous slide: Revenue Looking from the consumer’s Maximum Revenue point of view, the amount the 1300 seller earns as revenue becomes 1200 an expenditure for the consumer. Di as re pr ct ic 1000 io e n 800 of ncr m eas i ov e 600 In the elastic In the inelastic em s region, region, en 400 increasing increasing t price decreases price increases 200 total revenue total revenue Q4 Quantity 0 20 40 50 60 80 100 Quartic Quote: In the inelastic region, change in revenue and change in price are in the same direction; in the elastic region, change in revenue and change in price are in opposite directions. LOS 13.a: …explain the difference between Elasticity inelastic and elastic demand… 13 13 © Quartic Training Limited
  • 14. Quartic Training – Class Workbook, CFA Level I Maximising Aggregate Surpluses Marginal social benefit (MSB) is the sum of each consumer’s marginal benefit. Similarly Marginal social cost (MSC) is the sum of each suppliers marginal costs from producing the product. Within the shaded region, the Price Aggregate aggregate of surpluses increases Consumer Surplus with quantity. Beyond the equilibrium quantity, MSC will exceed MSB. Equilibrium Price Both aggregate surpluses are at their maximum at the equilibrium point. The market is therefore Aggregate most efficient at this point. Producer Surplus Q4 Equilibrium Quantity Quantity LOS 14.d: discuss the relationship between consumer surplus, producer surplus and Efficiency and Equity equilibrium. 14 14 © Quartic Training Limited