Polkadot JAM Slides - Token2049 - By Dr. Gavin Wood
Apec bali 2013
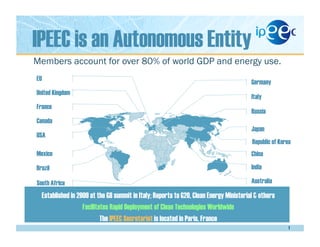
1. IPEEC is an Autonomous Entity
1
Established in 2009 at the G8 summit in Italy; Reports to G20, Clean Energy Ministerial & others
Facilitates Rapid Deployment of Clean Technologies Worldwide
The IPEEC Secretariat is located in Paris, France
Members account for over 80% of world GDP and energy use.
Italy
Russia
Japan
Republic of Korea
China
India
Australia
Germany
United Kingdom
France
Canada
USA
Mexico
Brazil
EU
South Africa
2. Global
addi)onal
investment
by
end-‐use
sector
Transport
0
200
400
600
800
1
000
1
200
2015
2020
2025
2030
2035
Services
Residen)al
Industry
Billion
dollars
(2011)
Addi$onal
investments
required
in
end-‐use
efficiency
are
$11.8
trillion
over
2012-‐2035;
saving
consumers
$17.5
trillion
in
energy
expenditures
in
this
period
(Source:
IEA)
The
Efficient
World
Scenario
rela2ve
to
the
New
Policies
Scenario
3. Global
primary
energy
demand
by
scenario
12
000
13
000
14
000
15
000
16
000
17
000
18
000
2010
2015
2020
2025
2030
2035
Mtoe
New
Policies
Scenario
Efficient
World
Scenario
EWS
total
primary
energy
demand
Mtoe
2010
2035
Other
renewables
112
650
Bioenergy
1
277
1
749
Hydro
295
476
Nuclear
719
1
094
Gas
2
740
3
541
Oil
4
113
4
061
Coal
3
474
3
274
Primary
energy
savings
achieved
in
the
Efficient
World
Scenario
in
2035
are
equivalent
to
18%
of
global
energy
demand
in
2010
4. Oil
import
bills
in
selected
countries
by
scenario
0
150
300
450
600
Billion
dollars
(2011)
2011
New
Policies
Scenario,
2035
Efficient
World
Scenario,
2035
Japan
China
United
States
European
Union
India
Energy
efficiency
cuts
fossil
fuel
import
bills
by
$570
billion
in
the
Efficient
World
Scenario.
Almost
70%
of
these
savings
accrue
from
lower
oil
import
bills.
5.
6. Barriers to Energy Efficiency
Barrier
Examples
Market
• Market
organisa)on
and
price
distor)ons
prevent
customers
from
appraising
the
true
value
of
energy
efficiency.
• The
principal
agent
problem,
in
which
the
investor
does
not
reap
the
rewards
of
improved
efficiency
(the
classic
case
being
the
landlord-‐tenant
situa)on).
• Transac)on
costs
(project
costs
are
high
rela)ve
to
energy
savings).
Financial
• Up-‐front
costs
and
dispersed
benefits
discourage
investors.
• Percep)on
of
EE
investments
as
complicated
&
risky
-‐
high
transac)on
costs.
• Lack
of
awareness
of
financial
benefits
on
the
part
of
financial
ins)tu)ons.
Informa2on
and
awareness
• Lack
of
sufficient
informa)on
and
understanding,
on
the
part
of
consumers,
to
make
ra)onal
consump)on
and
investment
decisions.
Regulatory
and
ins2tu2onal
• Energy
tariffs
that
discourage
EE
investment
(such
as
declining
block
prices
and
fuel
subsidies).
• Incen)ve
structures
encourage
energy
providers
to
sell
energy
rather
than
invest
in
cost-‐effec)ve
energy
efficiency.
• Ins)tu)onal
bias
towards
supply-‐side
investments.
Technical
• Lack
of
affordable
energy
efficiency
technologies
suitable
to
local
condi)ons.
• Insufficient
local
capaci)es
to
iden)fy,
develop,
implement
and
maintain
energy
efficiency
investments.
7. Methodological challenges
7
Challenge
Proposed
Approach
Multi-‐dimensionality
Track
global
performance
on
energy
intensity
complemented
by
energy
intensity
of
major
economic
sectors
and
efficiency
of
energy
industry
Move
towards
better
tracking
of
targets,
policies,
institutions,
investments
Intensity
vs.
Efficiency
Track
energy
intensity
for
countries
and
major
regions/blocks,
where
feasible
complement
with
efficiency
decomposition
to
strip
out
structural
effects
Market
Exchange
Rate
vs.
Purchasing
Power
Parity
Track
purchasing
power
parity
Primary
vs.
final
energy
Track
global
energy
intensity
in
terms
of
primary
energy
demand
Track
sectoral
energy
intensity
in
terms
of
final
energy
consumption
Volatility
Track
a
five
year
moving
average
trend
8. Last decade shows slowing rates of improvement
in energy intensity (higher when adjusted)
8
-‐1.61%
-‐0.99%
-‐1.30%
1990-‐2000
2000-‐2010
1990-‐2010
-‐1.77%
-‐1.21%
-‐1.49%
1990-‐2000
2000-‐2010
1990-‐2010
CAGR Energy Intensity
(PPP)
Adjusted CAGR Energy
Intensity
Source: IEA, WDI
9. East Asia accounted for the lion’s share of energy saved,
even as Middle Eastern energy intensity deteriorated
9
Energy Intensity Trends by Region Share of Cumulative Savings by
Region, 1990-2010
Source: IEA, WDI
-‐1.7%
-‐1.3%
-‐2.3%
-‐3.2%
0.8%
-‐1.1%
-‐0.5%
-‐1.5%
-‐1.3%
-‐0.5%
-‐0.1%
-‐1.1%
0
10
20
30
40
-‐4%
-‐2%
0%
2%
NAm
EU
EE
CCA
WA
EA
SEA
SA
Oceania
LAC
NAf
SSA
CAGR
1990-‐2010
(left)
EI
in
1990
(right)
EI
in
2010
(right)
MJ/$2005
PPP
EA
(58%)
NAm
(17%)
EU
(10%)
EE
(6%)
SA
(4%)
CCA
(2%)
LAC
(1%)
SSA
(1%)
Oceania
(
<1%)
SEA
(<1%)
10. Service sector contributed the most to energy savings
during last 20 years
10
Energy Intensity Trends by
Sector
Share of Cumulative Savings by
Sector
Source: IEA, WDI
-‐1.4%
-‐2.2%
-‐1.4%
0
5
10
-‐3%
0%
Industry
Agriculture
Services
CAGR
1990-‐2010
(left)
EI
in
1990
(right)
EI
in
2010
(right)
MJ/$2005
PPP
Industr
y
40%
Service
56%
Agricultur
e
4%
Note: Services include services, transport, and residential
11. Areas where International Expertise can Help
Financial mechanisms to promote EE;
Enhanced EE in industry and buildings;
Improved energy management;
Data collection and indicators;
Development of policies and action plans; and
Enhanced coordination of regional actions.
11
12. Energy Efficiency Market Penetration
Energy efficiency firms attracted nearly $1.1 billion in
venture capital in 2010, almost double that of 2007.
LIGHTING: LED is the fastest growing market at a CAGR of
14.9% from 2011 to 2016:
Asia will witness the highest growth (CAGR of 16.6%).
BUILDINGS: EE market $87.0bn in 2012.
GREEN IT: Cloud computing revenue to continue worldwide
growth at a compound annual growth rate (CAGR) of 28.8%:
Market increase: US$46 billion (2009) to US$210.3 billion (2015).
EE measures could drive total data center energy expenditures down
from $23.3 billion in 2010 to $16.0 billion in 2020 (28% reduction in
GHG emissions from 2010 levels).
12
13. Energy Efficiency Financing Trends
Asia Pacific deals by sector
13
Source: Final Renewables Deals 2012 Outlook 2011 Review, PwC.
14. Energy Service Companies (ESCOs)
The ESCO industry in Asia Pacific is poised to grow:
From $3.0 billion in annual revenue in 2009 to $18.5
billion by 2016.
421% increase from 2010 levels.
Example: Despite not even being operational until 1998,
annual revenues for China’s ESCO industry to reach $17
billion by 2015, increasing its share of the APAC regional
market to over 90% (Source: Pike Research).
15. Roadblocks to successful EE financing?
An economic actor perspective – financial actors and market actors:
Fixed cost of lending incentivizes banks to focus on large corporate loans.
Information asymmetry between banks and borrowers:
Adverse selection: Average pricing will attract risky borrowers and turn away
attractive borrowers;
Moral Hazard: Risky behavior as borrower knows that bank has imperfect oversight.
Lack
of
credit
bureaus
&
clear
credit
history
increases
risk-‐assessment
costs.
Inadequate
knowledge
and
experience
with
the
product
.
Inefficient
price
signals
–
consump)on
disconnected
from
cost.
Network
of
contractors
&
suppliers
unavailable
or
inexperienced.
16. IDENTIFIED GAPS FOR ENABLING
ESCO PROJECTS (EBRD - 2012)
Technical gaps:
• Lack of awareness and
information
• Clients lack of expertise and
resources for preparing
ESCO projects/tenders
Regulatory gaps:
• No clarity of legal procedures
regarding ESCO projects:
• procurement
• budgetary treatment
• Lack of administrative
instructions/guidance
• Lack of contract and tender
templates
• Lack of M&V protocols and
unstable customers
Financing gaps:
• Internal funding by public
building:
• lack funding
• debt ceilings reached
• External funding:
• ESCOs do not finance
long-term on balance sheet
• banks lack experience in
ESCO projects and don’t
offer forfeiting (buying
accounts receivables) +
require high level of
collateral for loans
17. What is Needed for ESCOs to be Successful?
17
1. Strong legal framework
a) Contract enforcement,
b) Market transparency,
2. Monitoring & Verification procedures
(M&V),
3. Possibly, fiscal incentives or other
policies supporting ESCOs,
4. Rational energy prices .
Without these conditions, ESCOs have to
focus on basic services:
• Purchasing,
installa)on
&
maintenance,
• Management
&
upgrade
of
equipment.
The complexity of the EPC depends on
the type of market
1. Technical & practical
experience.
2. Capacity to arrange &
manage financing, and to
mitigate financial risks.
3. Business entrepreneurship &
project/client management
skills.
Source: Sun, Zhu, Taylor (2011)
ESCOs need Specific Skills
18. Some Innovative Financing Instruments
• Innovative EE financing instruments in key areas:
• Innovative funds for securing private financing include :
• Interest rate buy down fund;
• Partial risk guarantee/loan loss recovery fund;
• Venture capital fund, etc.
18
Area of Innovation Innovative Instrument
Lending Revolving Loan Fund
Repayment On Bill Financing
Source of capital Revenue Decoupling,
Energy Conservation Bonds
19. 19
Thank you!
Any questions? Please contact:
Amit.Bando@ipeec.org
contact@ipeec.org
9 rue de la Fédération
75739 Paris
France