SlideShare une entreprise Scribd logo
1  sur  13
Nota Fizik: Understanding Derived and Base Quantities
Understanding Derived and Base Quantities
Physical quantities are quantities that can be measured. e.g. Length, Temperature,
Speed, Time.
Quantities or qualities that cannot be measured are not physical quantities. e.g.
happiness, sadness etc.
Physical quantities can be divided into Base quantitied and Derived quantities.
(i) Physical quantities are quantities that can be measured or can be calculated.
(ii) The base quantities are “building block” quantities from which other quantities are
derived from.
(iii) The base quantities and their S.I. units are:
 Base quantities S.I. units
 Mass kg
 Length m
 Time s
 Electric current A
 Thermodynamic
 temperature K
(iii) Derived quantities are quantities derived (iv) Examples of derived quantities.
 Derived quantities S.I. units
 area m2
 density kg m-3
 weight N
 velocity m s-1
Standard Notation: To express very large or very small numbers.
Example; A X 10 n (ten to the power of n), n must be an integer and 1 ≤ A <10
Nota Fizik: Understanding Scalar and Vector Quantities
Scalar quantities: Quantities that have magnitude only. ( Speed, mass, distance)
Example:
For example speed has unit of ms^-1. but it has no direction.
Mass is kg but we don't know the direction.
Distance is 2km but no direction.
Vector quantities: Quantities that have magnitude and direction. (Velocity, Weight,
Displacement)
Example:
Velocity unit is ms^-1 but we must state the direction that is whether from right to
left.
Weight unit is Kg but the direction is towards the gravity pull of the earth.
Displacement is 2km but to the north from the point of reference.
Posted by O'Deen at 8:47 AM
Experimental Errors
When doing experiments there are several errors that we need to consider. For
example the error when taking reading from instruments and also the influence from
the outer surroundings. This is true for all scientific investigations. Even machines
have errors! and they do need to be calibrated consistently!
Error is the difference between the measured value and the real or actual value. (The
difference in reading is known as the error)
Two main types of error are systematic error and random error.
Systematic error occurs when there is an error when reading the scale that is being
used. It is caused by the surroundings, the instrument itself (scale may not be uniform
or even blurred due to wear and tear) and of course the observer error.
Systematic error results in the measurement or reading being consistently over the
actual value OR consistently smaller than the actual value.
There are several possible causes of systematic error:
One of the most common error is the Zero Error. Zero Error is caused if the reading
shown is Not zero when the true value is actually zero. This is most probably caused by
a flaw in the instrument for example when using a ruler that has lost its zero scale due
to wear and tear hence causing an error in the measurement of length.
Wrong assumptions may also cause error, for example if you assume that water boils
at 100 degree celcius but actually its boiling point is higher if there are impurities in
it. (Pure water boils at 100 degree celcius)
There is also a possibility to create error when there is a lag of reaction time. For
example in a sports day, when measuring a 100 m running time using a stopwatch. The
observer may not press the stop button exactly when the foot of the runner touches
the finishing line.
Sometimes, as I have mentioned, instruments that are not properly calibrated could
also cause error and this has to be put in consideration when writing a report or when
there is an anomaly in reading.
Another type of error that needs to be considered is Random Error.
Random error is caused by the observer who reads the measuring instrument. Just like
the systematic error, there can exist positive or negative error. Positive error is when
the reading is bigger than the real value and negative error is when the reading is
smaller than the real value.
One of the ways to reduce random error is to take several readings for a measurement
and then taking the average reading to be analysed.
There are several examples of random error.
Miscounting numbers during observation or change in the surrounding due to
temperature, wind, light, exposure to chemicals or impurities may cause error.
Sometimes the observer may read the scale wrongly (as in the case of reading a scale
in on a beaker or ruler (parallax error). Parallax error occurs when a reading is taken
from an unsuitable position relative to the scale.
Ways to reduce error
Magnifying glass to enhance the visual of scale on the instrument.
Avoiding parallax error by positioning the instrument (meter rule) properly on the
table with the eyes perpendicular to the scale. This also applies when reading other
instruments. Parallax error can also be reduced by putting a strip of mirror next to the
scale (for example in ammeter), the eye must be positioned so that the image formed
on the mirror is fully covered by the indicator hand of the ammeter.
Some instruments can be adjusted to eliminate zero error. For example when using an
ammeter, there is an adjuster to set the indicator to zero before making any
measurement.
In the case of a ruler, measurement can be carried out starting from the next clear
scale for example if scale 0.0cm is blurred, we can start measuring the length from
2.0cm, of course taking the difference of value in consideration when recording the
final reading.
Nota Fizik: Understanding Measurements
In Physics and any scientific investigations. Measurement of quantities is very crucial.
It is in fact the core of data generation. Measurements can be done by various
methods and various instruments. Here, only a few examples are explained.
A micro balance is used to measure minute masses. It is sensitive but not very
accurate.
Slide callipers are usually used to measure the internal or external diameter of an
object.
A micrometre screw gauge is used to measure the diameter of a wire of the thickness
of a thin object.
All measurement must consider this:
Accuracy: Ability of the instrument to measure the true value or close to the true
value. The smaller the percentage error, the more accurate the instrument is.
Sensitivity of an instrument is the ability of the instrument to detect any small change
in a measurement.
Consistency: ability of the instrument to produce consistent measurement.(the values
are near to each other). The lower the relative deviation, the more consistent the
measurement is.
Ways to increase accuracy:
- repeat the measurements and get the mean value.
- correcting for zero error.
- avoiding parallax error.
- use magnifying glass to aid in reading.
For example, when asked about how to increase the sensitivity of a mercury
thermometer:
-use a bulb with thinner wall.
-use a capillary tube of smaller diameter or bore.
Nota Fizik: Analysing scientific investigation
So you are here probably because you want to get a deeper meaning an concept of
scientific investigation.
You should have probably been familiar with the steps involved in scientific
investigation i.e. Identifying problem, making hypothesis, generating data etc...
However, what I would like to emphasis in this post is the different types of variable.
You should know that "A variable is a quantity that varies in value". It represents
"something" that are involved in a measurement in scientific investigation. Thus, a
proper scientific investigation always involve variables and its measurement. A
quantity that can be measured is called a physical quantity.
Three types of variables are:
Manipulated variable is a variable that is set or fixed before and experiment is carried
out. it is usually plotted on x- axis.
Responding variable is a variable that changes according to and dependent to
manipulated variable. it is usually plotted on y-axis.
Fixed variable is fixed and unchanged throughout the experiment.
Now lets see how to make inference and hypothesis?
How to make inference and hypothesis?
Inference: state the relationship between two VISIBLE QUANTITIES in a diagram or
picture.
Hypothesis: state the relation ship between two MEASURABLE VARIABLES that can be
investigated in a lab.
How to tabulate data?
-the name or the symbols of the variables must be labelled with respective units.
-all measurements must be consistent with the sensitivity of the instruments used.
-all the calculated values must be correct.
-all the values must be consistent to the same number of decimal places.
A graph is considered well-plotted if it contains the following:
- a title to show the two variables and investigation.
- two axes labelled with correct variables and units
- scales must be chosen carefully and graph must occupy more than 50% of the graph
paper.
- all the points are correctly drawn.
- the best line is drawn.
Linear Motion Calculation Examples
A bicycle moved from point A and then moved 50 m to the north in 60 seconds. The
bicycle then moved 120 m to the east in 40 seconds. Finally, it stopped. Calculate the
1. Total distance moved by the bicycle
2. Displacement
3. Velocity
4. Average speed
5. Speed of the bicycle when it is moving to the north
Solution:
1. Total distance = 50m + 170m
= 170m
2. Displacement
Remember displacement is the shortest distance between two points.
Imagine A as the beginning of a triangle. Then connect it with a line of 50m upwards
then it turns left 120m (go east). so the distance is the hypotenuse.
Using Pythagoras' theorem = Squared root (120^2 + 50^2)
= 130m
3. Velocity = Displacement / time
= 130 m / 100 s
= 1.3 m s^-1
4. Average speed of the bicycle = total distance / total time
= 170m/ 100s
= 1.7 m s^-1
5. Speed = distance / time
Distance = 50m, time = 60s
= 50m / 60s
= 0.83 ms^-1
Be careful during calculation as most of the time Physics requires a good skill in
maths!!
Distance, Displacement, Velocity, Speed and Acceleration
Distance and Displacement
Distance is the total path length traveled from one location to another. It is a scalar
quantity.
Displacement is the distance between two locations measured along the shortest path
connecting them, in specified location. It is a vector quantity. The SI unit of distance
and displacement is metre (m).
Speed and Velocity
Speed is the distance traveled per unit time or the rate of change of distance.
Speed = total distance traveled / time taken
Velocity is the speed in a given direction or the rate of change of displacement.
Average velocity = displacement/ time taken
Acceleration and Deceleration
Acceleration is the rate of change of velocity.
Acceleration = change of velocity / time taken
Change of velocity = final velocity (v) – initial velocity (u)
Acceleration = (final velocity – initial velocity) / time taken
= (v – u) / t
Things to remember:
1. Constant velocity means the object is not accelerating. Acceleration is zero.
2. Constant acceleration means the object is increasing its velocity.
Label of the Parts
(This image is licienced
under GDFL. The source file can be obtained from wikipedia.org)
Range and Accuracy
The range of a micrometer is 0-25mm.
The accuracy of a micrometer is up to 0.01mm.
How to Use a Micrometer?
1. Turn the thimble until the object is gripped gently between the anvil and
spindle.
2. Turn the ratchet knob until a "click" sound is heard. This is to prevent exerting
too much pressure on the object measured.
3. Take the reading.
Derived Quantities
A derived quantity is a Physics quantity that is not a base quantity. It is the quantities
which derived from the base quantities through multiplying and/or dividing
them.Example
(Speed is derived from
dividing distance by time.)
Derived Unit
The derived unit is a combination of base units through multiplying and/or dividing
them.
Example 1
Find the derived unit of density.
Answer
Unit Conversion
Area and Volume
Example 2
Convert the unit of length, area and volume below to the units given.
a) 7.2 m = ____________cm
b) 0.32 m2 = ____________cm2c) 0.0012 m3 = ____________cm3d) 5.6 cm =
____________m
e) 350 cm2 = ____________m2f) 45000 cm3 = ____________m3Answer
a) 7.2 m = 7.2 x 102 cm
b) 0.32 m2 = 0.32 x 104 cm2 = 3.2 x 103 cm2
c) 0.0012 m3 = 0.0012 x 106 cm3 = 1.2 x 103 cm3
d) 5.6 cm = 5.6 x 10⁻² m
e) 350 cm2 = 350 x 10-4 m2 = 3.5 x 10⁻² m2
f) 45000 cm3 = 45000 x 10-6 m3 = 4.5 x 10⁻² m3
Speed
Example 3
Complete the following unit conversion
a) 12 kmh-1 = __________ ms-1
b) 12 ms-1 = __________ kmh-1
Answer
a)
12kmh−1=12km1h=12000m60×60s=3.33ms−1
b)
12ms−1=12m1s=121000km13600h=43.2kmh−1

Contenu connexe

Tendances

Introduction to physics
Introduction to physicsIntroduction to physics
Introduction to physicsmarjerin
 
Chapter1 measurements from rpg
Chapter1 measurements from rpgChapter1 measurements from rpg
Chapter1 measurements from rpgGabrielle Garciano
 
Reerence notes for igcse physics year10 2016
Reerence notes for igcse physics year10 2016Reerence notes for igcse physics year10 2016
Reerence notes for igcse physics year10 2016Ivan mulumba
 
Measuring length and time
Measuring length and timeMeasuring length and time
Measuring length and timeClement Tay
 
Measurement and uncertainty
Measurement and uncertainty Measurement and uncertainty
Measurement and uncertainty IB School
 
Science enginering lab report experiment 1 (physical quantities aand measurem...
Science enginering lab report experiment 1 (physical quantities aand measurem...Science enginering lab report experiment 1 (physical quantities aand measurem...
Science enginering lab report experiment 1 (physical quantities aand measurem...Q Hydar Q Hydar
 
AP Physics 1 - Introduction
AP Physics 1 - IntroductionAP Physics 1 - Introduction
AP Physics 1 - Introductionmlong24
 
Measurements and precision measuring devices
Measurements and precision measuring devicesMeasurements and precision measuring devices
Measurements and precision measuring devicesCraig Kielb
 
Errors and uncertainities net
Errors and uncertainities netErrors and uncertainities net
Errors and uncertainities netAmer Ghazi Attari
 
Understanding Measurements
Understanding MeasurementsUnderstanding Measurements
Understanding Measurementsroszelan
 
Introduction to physics
Introduction to physicsIntroduction to physics
Introduction to physicsCk Sal
 
METROLOGY & MEASUREMENT Unit 1 notes (5 files merged)
METROLOGY & MEASUREMENT Unit 1 notes (5 files merged)METROLOGY & MEASUREMENT Unit 1 notes (5 files merged)
METROLOGY & MEASUREMENT Unit 1 notes (5 files merged)MechRtc
 
Chapter 8_Scientific Measurement
Chapter 8_Scientific MeasurementChapter 8_Scientific Measurement
Chapter 8_Scientific MeasurementNandjebo Phellep
 

Tendances (20)

Introduction to physics
Introduction to physicsIntroduction to physics
Introduction to physics
 
Chapter1 measurements from rpg
Chapter1 measurements from rpgChapter1 measurements from rpg
Chapter1 measurements from rpg
 
Reerence notes for igcse physics year10 2016
Reerence notes for igcse physics year10 2016Reerence notes for igcse physics year10 2016
Reerence notes for igcse physics year10 2016
 
Measuring length and time
Measuring length and timeMeasuring length and time
Measuring length and time
 
Measurement and uncertainty
Measurement and uncertainty Measurement and uncertainty
Measurement and uncertainty
 
Theory of errors
Theory of errors Theory of errors
Theory of errors
 
Science enginering lab report experiment 1 (physical quantities aand measurem...
Science enginering lab report experiment 1 (physical quantities aand measurem...Science enginering lab report experiment 1 (physical quantities aand measurem...
Science enginering lab report experiment 1 (physical quantities aand measurem...
 
Errors in measurement
Errors in measurementErrors in measurement
Errors in measurement
 
AP Physics 1 - Introduction
AP Physics 1 - IntroductionAP Physics 1 - Introduction
AP Physics 1 - Introduction
 
Unit and Measure
Unit and MeasureUnit and Measure
Unit and Measure
 
Theory of Errors
Theory of ErrorsTheory of Errors
Theory of Errors
 
Measurements and precision measuring devices
Measurements and precision measuring devicesMeasurements and precision measuring devices
Measurements and precision measuring devices
 
1.1 STATISTICS
1.1 STATISTICS1.1 STATISTICS
1.1 STATISTICS
 
Errors and uncertainities net
Errors and uncertainities netErrors and uncertainities net
Errors and uncertainities net
 
Chapter 1
Chapter 1Chapter 1
Chapter 1
 
Ch.13.measurements
Ch.13.measurementsCh.13.measurements
Ch.13.measurements
 
Understanding Measurements
Understanding MeasurementsUnderstanding Measurements
Understanding Measurements
 
Introduction to physics
Introduction to physicsIntroduction to physics
Introduction to physics
 
METROLOGY & MEASUREMENT Unit 1 notes (5 files merged)
METROLOGY & MEASUREMENT Unit 1 notes (5 files merged)METROLOGY & MEASUREMENT Unit 1 notes (5 files merged)
METROLOGY & MEASUREMENT Unit 1 notes (5 files merged)
 
Chapter 8_Scientific Measurement
Chapter 8_Scientific MeasurementChapter 8_Scientific Measurement
Chapter 8_Scientific Measurement
 

En vedette

Topik 4 komposisi kimia sel
Topik 4   komposisi kimia selTopik 4   komposisi kimia sel
Topik 4 komposisi kimia selsmktsj2
 
Topik 3 pergerakan merentas membran plasma
Topik 3  pergerakan merentas membran plasmaTopik 3  pergerakan merentas membran plasma
Topik 3 pergerakan merentas membran plasmasmktsj2
 
[spmsoalan]soalan-skema- k1-fizik-tengah-tahun-kedah-2014
[spmsoalan]soalan-skema- k1-fizik-tengah-tahun-kedah-2014[spmsoalan]soalan-skema- k1-fizik-tengah-tahun-kedah-2014
[spmsoalan]soalan-skema- k1-fizik-tengah-tahun-kedah-2014SPM Soalan
 
1026901 nota-padat-fizik-f4-light-notes
1026901 nota-padat-fizik-f4-light-notes1026901 nota-padat-fizik-f4-light-notes
1026901 nota-padat-fizik-f4-light-notesStanford Sibangan
 
Trial kedah spm 2014 physics k2 modul 2
Trial kedah spm 2014 physics k2 modul 2Trial kedah spm 2014 physics k2 modul 2
Trial kedah spm 2014 physics k2 modul 2Cikgu Pejal
 
SPM paper 3 2010
SPM paper 3 2010SPM paper 3 2010
SPM paper 3 2010hajahrokiah
 
Chemistry form 4 topical question 7
Chemistry form 4 topical question 7Chemistry form 4 topical question 7
Chemistry form 4 topical question 7Mudzaffar Shah
 
Chemistry Form 4 topical question 4
Chemistry Form 4 topical question 4Chemistry Form 4 topical question 4
Chemistry Form 4 topical question 4Mudzaffar Shah
 
Chemistry SPM 2012 Paper 1 Question Analysis
Chemistry SPM 2012 Paper 1 Question AnalysisChemistry SPM 2012 Paper 1 Question Analysis
Chemistry SPM 2012 Paper 1 Question Analysissweemoi khor
 
Perfect Score Chemistry SPM 2012
Perfect Score Chemistry SPM 2012 Perfect Score Chemistry SPM 2012
Perfect Score Chemistry SPM 2012 Cikgu Marzuqi
 
66136916 kimia-paper-2-f4-akhir-sbp-06
66136916 kimia-paper-2-f4-akhir-sbp-0666136916 kimia-paper-2-f4-akhir-sbp-06
66136916 kimia-paper-2-f4-akhir-sbp-06adasafwan
 
Seminar ecer smkpj 2015
Seminar ecer smkpj 2015Seminar ecer smkpj 2015
Seminar ecer smkpj 2015SMKTA
 
SPM Form 4 Physics - Heat
SPM Form 4 Physics - HeatSPM Form 4 Physics - Heat
SPM Form 4 Physics - HeatLoo Carmen
 

En vedette (20)

Topik 4 komposisi kimia sel
Topik 4   komposisi kimia selTopik 4   komposisi kimia sel
Topik 4 komposisi kimia sel
 
Topik 3 pergerakan merentas membran plasma
Topik 3  pergerakan merentas membran plasmaTopik 3  pergerakan merentas membran plasma
Topik 3 pergerakan merentas membran plasma
 
[spmsoalan]soalan-skema- k1-fizik-tengah-tahun-kedah-2014
[spmsoalan]soalan-skema- k1-fizik-tengah-tahun-kedah-2014[spmsoalan]soalan-skema- k1-fizik-tengah-tahun-kedah-2014
[spmsoalan]soalan-skema- k1-fizik-tengah-tahun-kedah-2014
 
1026901 nota-padat-fizik-f4-light-notes
1026901 nota-padat-fizik-f4-light-notes1026901 nota-padat-fizik-f4-light-notes
1026901 nota-padat-fizik-f4-light-notes
 
Trial kedah spm 2014 physics k2 modul 2
Trial kedah spm 2014 physics k2 modul 2Trial kedah spm 2014 physics k2 modul 2
Trial kedah spm 2014 physics k2 modul 2
 
SPM paper 3 2010
SPM paper 3 2010SPM paper 3 2010
SPM paper 3 2010
 
Chemistry form 4 topical question 7
Chemistry form 4 topical question 7Chemistry form 4 topical question 7
Chemistry form 4 topical question 7
 
Module iii student's copy 2
Module iii student's copy  2 Module iii student's copy  2
Module iii student's copy 2
 
Chemistry Form 4 topical question 4
Chemistry Form 4 topical question 4Chemistry Form 4 topical question 4
Chemistry Form 4 topical question 4
 
ChemSpm2010P3Q3
ChemSpm2010P3Q3ChemSpm2010P3Q3
ChemSpm2010P3Q3
 
Tips Fizik SPM
Tips Fizik SPMTips Fizik SPM
Tips Fizik SPM
 
Chemistry SPM 2012 Paper 1 Question Analysis
Chemistry SPM 2012 Paper 1 Question AnalysisChemistry SPM 2012 Paper 1 Question Analysis
Chemistry SPM 2012 Paper 1 Question Analysis
 
Biology notes
Biology notesBiology notes
Biology notes
 
BIOLOVE SPM
BIOLOVE SPM BIOLOVE SPM
BIOLOVE SPM
 
Perfect Score Chemistry SPM 2012
Perfect Score Chemistry SPM 2012 Perfect Score Chemistry SPM 2012
Perfect Score Chemistry SPM 2012
 
Asid & bes
Asid & besAsid & bes
Asid & bes
 
66136916 kimia-paper-2-f4-akhir-sbp-06
66136916 kimia-paper-2-f4-akhir-sbp-0666136916 kimia-paper-2-f4-akhir-sbp-06
66136916 kimia-paper-2-f4-akhir-sbp-06
 
Perfect score biology 2013
Perfect score biology 2013Perfect score biology 2013
Perfect score biology 2013
 
Seminar ecer smkpj 2015
Seminar ecer smkpj 2015Seminar ecer smkpj 2015
Seminar ecer smkpj 2015
 
SPM Form 4 Physics - Heat
SPM Form 4 Physics - HeatSPM Form 4 Physics - Heat
SPM Form 4 Physics - Heat
 

Similaire à Nota fizik ^^

Similaire à Nota fizik ^^ (20)

Physical measurement and error analysis
Physical measurement and error analysis Physical measurement and error analysis
Physical measurement and error analysis
 
MMM Module 4.pptx
MMM Module 4.pptxMMM Module 4.pptx
MMM Module 4.pptx
 
1.2 - Uncertainties and errors.pptx
1.2 - Uncertainties and errors.pptx1.2 - Uncertainties and errors.pptx
1.2 - Uncertainties and errors.pptx
 
Uncertainties.pptx
Uncertainties.pptxUncertainties.pptx
Uncertainties.pptx
 
EMI PPT_0_0.pdf
EMI PPT_0_0.pdfEMI PPT_0_0.pdf
EMI PPT_0_0.pdf
 
Module-1.pptx
Module-1.pptxModule-1.pptx
Module-1.pptx
 
General-Physics-1-Week-1-ppt.pptx
General-Physics-1-Week-1-ppt.pptxGeneral-Physics-1-Week-1-ppt.pptx
General-Physics-1-Week-1-ppt.pptx
 
General Physics 1 Week 1 ppt.pptxxxxxxxx
General Physics 1 Week 1 ppt.pptxxxxxxxxGeneral Physics 1 Week 1 ppt.pptxxxxxxxx
General Physics 1 Week 1 ppt.pptxxxxxxxx
 
The importance of measurement
The importance of measurementThe importance of measurement
The importance of measurement
 
Errors-Analysis-MNN-RN.pptx
Errors-Analysis-MNN-RN.pptxErrors-Analysis-MNN-RN.pptx
Errors-Analysis-MNN-RN.pptx
 
Errors in measurement
Errors in measurementErrors in measurement
Errors in measurement
 
Errors and Error Measurements
Errors and Error MeasurementsErrors and Error Measurements
Errors and Error Measurements
 
Emi unit 1 ppt
Emi unit 1 pptEmi unit 1 ppt
Emi unit 1 ppt
 
Lecture 1 - System of Measurements, SI Units
Lecture 1 - System of Measurements, SI UnitsLecture 1 - System of Measurements, SI Units
Lecture 1 - System of Measurements, SI Units
 
Physics form 4 chapter1 slides
Physics form 4 chapter1 slidesPhysics form 4 chapter1 slides
Physics form 4 chapter1 slides
 
EMI-Unit-1 Material.docx
EMI-Unit-1 Material.docxEMI-Unit-1 Material.docx
EMI-Unit-1 Material.docx
 
ERRORS-IN-MEASUREMENT-slide 5.pdf
ERRORS-IN-MEASUREMENT-slide 5.pdfERRORS-IN-MEASUREMENT-slide 5.pdf
ERRORS-IN-MEASUREMENT-slide 5.pdf
 
146056297 cc-modul
146056297 cc-modul146056297 cc-modul
146056297 cc-modul
 
Chap 1 review of instrumentation
Chap 1 review of instrumentationChap 1 review of instrumentation
Chap 1 review of instrumentation
 
4.13 pdf
4.13 pdf4.13 pdf
4.13 pdf
 

Dernier

Measures of Dispersion and Variability: Range, QD, AD and SD
Measures of Dispersion and Variability: Range, QD, AD and SDMeasures of Dispersion and Variability: Range, QD, AD and SD
Measures of Dispersion and Variability: Range, QD, AD and SDThiyagu K
 
Explore beautiful and ugly buildings. Mathematics helps us create beautiful d...
Explore beautiful and ugly buildings. Mathematics helps us create beautiful d...Explore beautiful and ugly buildings. Mathematics helps us create beautiful d...
Explore beautiful and ugly buildings. Mathematics helps us create beautiful d...christianmathematics
 
Holdier Curriculum Vitae (April 2024).pdf
Holdier Curriculum Vitae (April 2024).pdfHoldier Curriculum Vitae (April 2024).pdf
Holdier Curriculum Vitae (April 2024).pdfagholdier
 
fourth grading exam for kindergarten in writing
fourth grading exam for kindergarten in writingfourth grading exam for kindergarten in writing
fourth grading exam for kindergarten in writingTeacherCyreneCayanan
 
Q4-W6-Restating Informational Text Grade 3
Q4-W6-Restating Informational Text Grade 3Q4-W6-Restating Informational Text Grade 3
Q4-W6-Restating Informational Text Grade 3JemimahLaneBuaron
 
social pharmacy d-pharm 1st year by Pragati K. Mahajan
social pharmacy d-pharm 1st year by Pragati K. Mahajansocial pharmacy d-pharm 1st year by Pragati K. Mahajan
social pharmacy d-pharm 1st year by Pragati K. Mahajanpragatimahajan3
 
APM Welcome, APM North West Network Conference, Synergies Across Sectors
APM Welcome, APM North West Network Conference, Synergies Across SectorsAPM Welcome, APM North West Network Conference, Synergies Across Sectors
APM Welcome, APM North West Network Conference, Synergies Across SectorsAssociation for Project Management
 
9548086042 for call girls in Indira Nagar with room service
9548086042  for call girls in Indira Nagar  with room service9548086042  for call girls in Indira Nagar  with room service
9548086042 for call girls in Indira Nagar with room servicediscovermytutordmt
 
Accessible design: Minimum effort, maximum impact
Accessible design: Minimum effort, maximum impactAccessible design: Minimum effort, maximum impact
Accessible design: Minimum effort, maximum impactdawncurless
 
A Critique of the Proposed National Education Policy Reform
A Critique of the Proposed National Education Policy ReformA Critique of the Proposed National Education Policy Reform
A Critique of the Proposed National Education Policy ReformChameera Dedduwage
 
Beyond the EU: DORA and NIS 2 Directive's Global Impact
Beyond the EU: DORA and NIS 2 Directive's Global ImpactBeyond the EU: DORA and NIS 2 Directive's Global Impact
Beyond the EU: DORA and NIS 2 Directive's Global ImpactPECB
 
Introduction to Nonprofit Accounting: The Basics
Introduction to Nonprofit Accounting: The BasicsIntroduction to Nonprofit Accounting: The Basics
Introduction to Nonprofit Accounting: The BasicsTechSoup
 
Advanced Views - Calendar View in Odoo 17
Advanced Views - Calendar View in Odoo 17Advanced Views - Calendar View in Odoo 17
Advanced Views - Calendar View in Odoo 17Celine George
 
Grant Readiness 101 TechSoup and Remy Consulting
Grant Readiness 101 TechSoup and Remy ConsultingGrant Readiness 101 TechSoup and Remy Consulting
Grant Readiness 101 TechSoup and Remy ConsultingTechSoup
 
BASLIQ CURRENT LOOKBOOK LOOKBOOK(1) (1).pdf
BASLIQ CURRENT LOOKBOOK  LOOKBOOK(1) (1).pdfBASLIQ CURRENT LOOKBOOK  LOOKBOOK(1) (1).pdf
BASLIQ CURRENT LOOKBOOK LOOKBOOK(1) (1).pdfSoniaTolstoy
 
The Most Excellent Way | 1 Corinthians 13
The Most Excellent Way | 1 Corinthians 13The Most Excellent Way | 1 Corinthians 13
The Most Excellent Way | 1 Corinthians 13Steve Thomason
 
Arihant handbook biology for class 11 .pdf
Arihant handbook biology for class 11 .pdfArihant handbook biology for class 11 .pdf
Arihant handbook biology for class 11 .pdfchloefrazer622
 

Dernier (20)

Measures of Dispersion and Variability: Range, QD, AD and SD
Measures of Dispersion and Variability: Range, QD, AD and SDMeasures of Dispersion and Variability: Range, QD, AD and SD
Measures of Dispersion and Variability: Range, QD, AD and SD
 
Explore beautiful and ugly buildings. Mathematics helps us create beautiful d...
Explore beautiful and ugly buildings. Mathematics helps us create beautiful d...Explore beautiful and ugly buildings. Mathematics helps us create beautiful d...
Explore beautiful and ugly buildings. Mathematics helps us create beautiful d...
 
Holdier Curriculum Vitae (April 2024).pdf
Holdier Curriculum Vitae (April 2024).pdfHoldier Curriculum Vitae (April 2024).pdf
Holdier Curriculum Vitae (April 2024).pdf
 
fourth grading exam for kindergarten in writing
fourth grading exam for kindergarten in writingfourth grading exam for kindergarten in writing
fourth grading exam for kindergarten in writing
 
Q4-W6-Restating Informational Text Grade 3
Q4-W6-Restating Informational Text Grade 3Q4-W6-Restating Informational Text Grade 3
Q4-W6-Restating Informational Text Grade 3
 
Código Creativo y Arte de Software | Unidad 1
Código Creativo y Arte de Software | Unidad 1Código Creativo y Arte de Software | Unidad 1
Código Creativo y Arte de Software | Unidad 1
 
social pharmacy d-pharm 1st year by Pragati K. Mahajan
social pharmacy d-pharm 1st year by Pragati K. Mahajansocial pharmacy d-pharm 1st year by Pragati K. Mahajan
social pharmacy d-pharm 1st year by Pragati K. Mahajan
 
Advance Mobile Application Development class 07
Advance Mobile Application Development class 07Advance Mobile Application Development class 07
Advance Mobile Application Development class 07
 
APM Welcome, APM North West Network Conference, Synergies Across Sectors
APM Welcome, APM North West Network Conference, Synergies Across SectorsAPM Welcome, APM North West Network Conference, Synergies Across Sectors
APM Welcome, APM North West Network Conference, Synergies Across Sectors
 
9548086042 for call girls in Indira Nagar with room service
9548086042  for call girls in Indira Nagar  with room service9548086042  for call girls in Indira Nagar  with room service
9548086042 for call girls in Indira Nagar with room service
 
Accessible design: Minimum effort, maximum impact
Accessible design: Minimum effort, maximum impactAccessible design: Minimum effort, maximum impact
Accessible design: Minimum effort, maximum impact
 
A Critique of the Proposed National Education Policy Reform
A Critique of the Proposed National Education Policy ReformA Critique of the Proposed National Education Policy Reform
A Critique of the Proposed National Education Policy Reform
 
Beyond the EU: DORA and NIS 2 Directive's Global Impact
Beyond the EU: DORA and NIS 2 Directive's Global ImpactBeyond the EU: DORA and NIS 2 Directive's Global Impact
Beyond the EU: DORA and NIS 2 Directive's Global Impact
 
Introduction to Nonprofit Accounting: The Basics
Introduction to Nonprofit Accounting: The BasicsIntroduction to Nonprofit Accounting: The Basics
Introduction to Nonprofit Accounting: The Basics
 
Mattingly "AI & Prompt Design: The Basics of Prompt Design"
Mattingly "AI & Prompt Design: The Basics of Prompt Design"Mattingly "AI & Prompt Design: The Basics of Prompt Design"
Mattingly "AI & Prompt Design: The Basics of Prompt Design"
 
Advanced Views - Calendar View in Odoo 17
Advanced Views - Calendar View in Odoo 17Advanced Views - Calendar View in Odoo 17
Advanced Views - Calendar View in Odoo 17
 
Grant Readiness 101 TechSoup and Remy Consulting
Grant Readiness 101 TechSoup and Remy ConsultingGrant Readiness 101 TechSoup and Remy Consulting
Grant Readiness 101 TechSoup and Remy Consulting
 
BASLIQ CURRENT LOOKBOOK LOOKBOOK(1) (1).pdf
BASLIQ CURRENT LOOKBOOK  LOOKBOOK(1) (1).pdfBASLIQ CURRENT LOOKBOOK  LOOKBOOK(1) (1).pdf
BASLIQ CURRENT LOOKBOOK LOOKBOOK(1) (1).pdf
 
The Most Excellent Way | 1 Corinthians 13
The Most Excellent Way | 1 Corinthians 13The Most Excellent Way | 1 Corinthians 13
The Most Excellent Way | 1 Corinthians 13
 
Arihant handbook biology for class 11 .pdf
Arihant handbook biology for class 11 .pdfArihant handbook biology for class 11 .pdf
Arihant handbook biology for class 11 .pdf
 

Nota fizik ^^

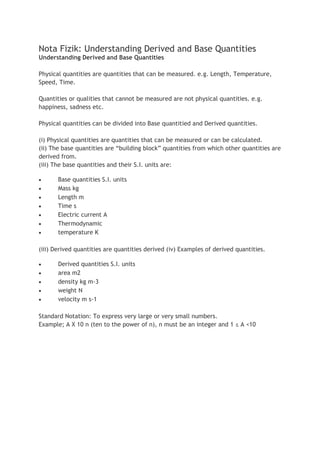
  • 1. Nota Fizik: Understanding Derived and Base Quantities Understanding Derived and Base Quantities Physical quantities are quantities that can be measured. e.g. Length, Temperature, Speed, Time. Quantities or qualities that cannot be measured are not physical quantities. e.g. happiness, sadness etc. Physical quantities can be divided into Base quantitied and Derived quantities. (i) Physical quantities are quantities that can be measured or can be calculated. (ii) The base quantities are “building block” quantities from which other quantities are derived from. (iii) The base quantities and their S.I. units are:  Base quantities S.I. units  Mass kg  Length m  Time s  Electric current A  Thermodynamic  temperature K (iii) Derived quantities are quantities derived (iv) Examples of derived quantities.  Derived quantities S.I. units  area m2  density kg m-3  weight N  velocity m s-1 Standard Notation: To express very large or very small numbers. Example; A X 10 n (ten to the power of n), n must be an integer and 1 ≤ A <10
  • 2. Nota Fizik: Understanding Scalar and Vector Quantities Scalar quantities: Quantities that have magnitude only. ( Speed, mass, distance) Example: For example speed has unit of ms^-1. but it has no direction. Mass is kg but we don't know the direction. Distance is 2km but no direction. Vector quantities: Quantities that have magnitude and direction. (Velocity, Weight, Displacement) Example: Velocity unit is ms^-1 but we must state the direction that is whether from right to left. Weight unit is Kg but the direction is towards the gravity pull of the earth. Displacement is 2km but to the north from the point of reference. Posted by O'Deen at 8:47 AM
  • 3. Experimental Errors When doing experiments there are several errors that we need to consider. For example the error when taking reading from instruments and also the influence from the outer surroundings. This is true for all scientific investigations. Even machines have errors! and they do need to be calibrated consistently! Error is the difference between the measured value and the real or actual value. (The difference in reading is known as the error) Two main types of error are systematic error and random error. Systematic error occurs when there is an error when reading the scale that is being used. It is caused by the surroundings, the instrument itself (scale may not be uniform or even blurred due to wear and tear) and of course the observer error. Systematic error results in the measurement or reading being consistently over the actual value OR consistently smaller than the actual value. There are several possible causes of systematic error: One of the most common error is the Zero Error. Zero Error is caused if the reading shown is Not zero when the true value is actually zero. This is most probably caused by a flaw in the instrument for example when using a ruler that has lost its zero scale due to wear and tear hence causing an error in the measurement of length. Wrong assumptions may also cause error, for example if you assume that water boils at 100 degree celcius but actually its boiling point is higher if there are impurities in it. (Pure water boils at 100 degree celcius) There is also a possibility to create error when there is a lag of reaction time. For example in a sports day, when measuring a 100 m running time using a stopwatch. The observer may not press the stop button exactly when the foot of the runner touches the finishing line. Sometimes, as I have mentioned, instruments that are not properly calibrated could also cause error and this has to be put in consideration when writing a report or when there is an anomaly in reading. Another type of error that needs to be considered is Random Error. Random error is caused by the observer who reads the measuring instrument. Just like the systematic error, there can exist positive or negative error. Positive error is when the reading is bigger than the real value and negative error is when the reading is smaller than the real value. One of the ways to reduce random error is to take several readings for a measurement and then taking the average reading to be analysed. There are several examples of random error. Miscounting numbers during observation or change in the surrounding due to
  • 4. temperature, wind, light, exposure to chemicals or impurities may cause error. Sometimes the observer may read the scale wrongly (as in the case of reading a scale in on a beaker or ruler (parallax error). Parallax error occurs when a reading is taken from an unsuitable position relative to the scale. Ways to reduce error Magnifying glass to enhance the visual of scale on the instrument. Avoiding parallax error by positioning the instrument (meter rule) properly on the table with the eyes perpendicular to the scale. This also applies when reading other instruments. Parallax error can also be reduced by putting a strip of mirror next to the scale (for example in ammeter), the eye must be positioned so that the image formed on the mirror is fully covered by the indicator hand of the ammeter. Some instruments can be adjusted to eliminate zero error. For example when using an ammeter, there is an adjuster to set the indicator to zero before making any measurement. In the case of a ruler, measurement can be carried out starting from the next clear scale for example if scale 0.0cm is blurred, we can start measuring the length from 2.0cm, of course taking the difference of value in consideration when recording the final reading.
  • 5. Nota Fizik: Understanding Measurements In Physics and any scientific investigations. Measurement of quantities is very crucial. It is in fact the core of data generation. Measurements can be done by various methods and various instruments. Here, only a few examples are explained. A micro balance is used to measure minute masses. It is sensitive but not very accurate. Slide callipers are usually used to measure the internal or external diameter of an object. A micrometre screw gauge is used to measure the diameter of a wire of the thickness of a thin object. All measurement must consider this: Accuracy: Ability of the instrument to measure the true value or close to the true value. The smaller the percentage error, the more accurate the instrument is. Sensitivity of an instrument is the ability of the instrument to detect any small change in a measurement. Consistency: ability of the instrument to produce consistent measurement.(the values are near to each other). The lower the relative deviation, the more consistent the measurement is. Ways to increase accuracy: - repeat the measurements and get the mean value. - correcting for zero error. - avoiding parallax error.
  • 6. - use magnifying glass to aid in reading. For example, when asked about how to increase the sensitivity of a mercury thermometer: -use a bulb with thinner wall. -use a capillary tube of smaller diameter or bore. Nota Fizik: Analysing scientific investigation So you are here probably because you want to get a deeper meaning an concept of scientific investigation. You should have probably been familiar with the steps involved in scientific investigation i.e. Identifying problem, making hypothesis, generating data etc... However, what I would like to emphasis in this post is the different types of variable. You should know that "A variable is a quantity that varies in value". It represents "something" that are involved in a measurement in scientific investigation. Thus, a proper scientific investigation always involve variables and its measurement. A quantity that can be measured is called a physical quantity. Three types of variables are: Manipulated variable is a variable that is set or fixed before and experiment is carried out. it is usually plotted on x- axis. Responding variable is a variable that changes according to and dependent to manipulated variable. it is usually plotted on y-axis. Fixed variable is fixed and unchanged throughout the experiment. Now lets see how to make inference and hypothesis? How to make inference and hypothesis? Inference: state the relationship between two VISIBLE QUANTITIES in a diagram or picture. Hypothesis: state the relation ship between two MEASURABLE VARIABLES that can be investigated in a lab. How to tabulate data? -the name or the symbols of the variables must be labelled with respective units. -all measurements must be consistent with the sensitivity of the instruments used. -all the calculated values must be correct.
  • 7. -all the values must be consistent to the same number of decimal places. A graph is considered well-plotted if it contains the following: - a title to show the two variables and investigation. - two axes labelled with correct variables and units - scales must be chosen carefully and graph must occupy more than 50% of the graph paper. - all the points are correctly drawn. - the best line is drawn.
  • 8. Linear Motion Calculation Examples A bicycle moved from point A and then moved 50 m to the north in 60 seconds. The bicycle then moved 120 m to the east in 40 seconds. Finally, it stopped. Calculate the 1. Total distance moved by the bicycle 2. Displacement 3. Velocity 4. Average speed 5. Speed of the bicycle when it is moving to the north Solution: 1. Total distance = 50m + 170m = 170m 2. Displacement Remember displacement is the shortest distance between two points. Imagine A as the beginning of a triangle. Then connect it with a line of 50m upwards then it turns left 120m (go east). so the distance is the hypotenuse. Using Pythagoras' theorem = Squared root (120^2 + 50^2) = 130m 3. Velocity = Displacement / time = 130 m / 100 s = 1.3 m s^-1 4. Average speed of the bicycle = total distance / total time = 170m/ 100s = 1.7 m s^-1 5. Speed = distance / time Distance = 50m, time = 60s = 50m / 60s = 0.83 ms^-1 Be careful during calculation as most of the time Physics requires a good skill in maths!!
  • 9. Distance, Displacement, Velocity, Speed and Acceleration Distance and Displacement Distance is the total path length traveled from one location to another. It is a scalar quantity. Displacement is the distance between two locations measured along the shortest path connecting them, in specified location. It is a vector quantity. The SI unit of distance and displacement is metre (m). Speed and Velocity Speed is the distance traveled per unit time or the rate of change of distance. Speed = total distance traveled / time taken Velocity is the speed in a given direction or the rate of change of displacement. Average velocity = displacement/ time taken Acceleration and Deceleration Acceleration is the rate of change of velocity. Acceleration = change of velocity / time taken Change of velocity = final velocity (v) – initial velocity (u) Acceleration = (final velocity – initial velocity) / time taken = (v – u) / t Things to remember: 1. Constant velocity means the object is not accelerating. Acceleration is zero. 2. Constant acceleration means the object is increasing its velocity. Label of the Parts
  • 10. (This image is licienced under GDFL. The source file can be obtained from wikipedia.org) Range and Accuracy The range of a micrometer is 0-25mm. The accuracy of a micrometer is up to 0.01mm. How to Use a Micrometer? 1. Turn the thimble until the object is gripped gently between the anvil and spindle. 2. Turn the ratchet knob until a "click" sound is heard. This is to prevent exerting too much pressure on the object measured. 3. Take the reading.
  • 11. Derived Quantities A derived quantity is a Physics quantity that is not a base quantity. It is the quantities which derived from the base quantities through multiplying and/or dividing them.Example (Speed is derived from dividing distance by time.) Derived Unit The derived unit is a combination of base units through multiplying and/or dividing them. Example 1 Find the derived unit of density. Answer
  • 12. Unit Conversion Area and Volume Example 2 Convert the unit of length, area and volume below to the units given. a) 7.2 m = ____________cm b) 0.32 m2 = ____________cm2c) 0.0012 m3 = ____________cm3d) 5.6 cm = ____________m e) 350 cm2 = ____________m2f) 45000 cm3 = ____________m3Answer a) 7.2 m = 7.2 x 102 cm b) 0.32 m2 = 0.32 x 104 cm2 = 3.2 x 103 cm2 c) 0.0012 m3 = 0.0012 x 106 cm3 = 1.2 x 103 cm3 d) 5.6 cm = 5.6 x 10⁻² m e) 350 cm2 = 350 x 10-4 m2 = 3.5 x 10⁻² m2 f) 45000 cm3 = 45000 x 10-6 m3 = 4.5 x 10⁻² m3
  • 13. Speed Example 3 Complete the following unit conversion a) 12 kmh-1 = __________ ms-1 b) 12 ms-1 = __________ kmh-1 Answer a) 12kmh−1=12km1h=12000m60×60s=3.33ms−1 b) 12ms−1=12m1s=121000km13600h=43.2kmh−1