Top Rated Pune Call Girls Sinhagad Road ⟟ 6297143586 ⟟ Call Me For Genuine S...
Finance Assignment Ratio Analysis.
1. 1
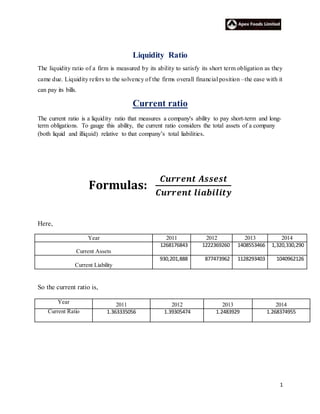
Liquidity Ratio
The liquidity ratio of a firm is measured by its ability to satisfy its short term obligation as they
came due. Liquidity refers to the solvency of the firms overall financial position –the ease with it
can pay its bills.
Current ratio
The current ratio is a liquidity ratio that measures a company's ability to pay short-term and long-
term obligations. To gauge this ability, the current ratio considers the total assets of a company
(both liquid and illiquid) relative to that company’s total liabilities.
Formulas:
𝑪𝒖𝒓𝒓𝒆𝒏𝒕 𝑨𝒔𝒔𝒆𝒔𝒕
𝑪𝒖𝒓𝒓𝒆𝒏𝒕 𝒍𝒊𝒂𝒃𝒊𝒍𝒊𝒕𝒚
Here,
Year 2011 2012 2013 2014
Current Assets
1268176843 1222369260 1408553466 1,320,330,290
Current Liability
930,201,888 877473962 1128293403 1040962126
So the current ratio is,
Year 2011 2012 2013 2014
Current Ratio 1.363335056 1.39305474 1.2483929 1.268374955
2. 2
Decision:
Generally, the higher the current ratio the more liquid the firm is considered to be. A current
ratio of 2.0 is occasionally cited as acceptable. Since the company’s current ratio of 2011 was
1.363335056 and in 2014 is 1.268374955 so the company still lying in the acceptable line but
gradually decreasing its current liquidity ratio. So, 2012 current ratio is more acceptable.
Quick (Acid-Test) Ratio
The acid-test ratio is a strong indicator of whether a firm has sufficient short-term assets to cover
its immediate liabilities. Commonly known as the quick ratio, this metric is more robust than the
current ratio, also known as the working capital ratio, since it ignores illiquid assets such as
inventory.
Formulas:
𝑪𝒖𝒓𝒓𝒆𝒏𝒕 𝑨𝒔𝒔𝒆𝒔𝒕−𝐢𝐧𝐯𝐞𝐧𝐭𝐨𝐫𝐲
𝑪𝒖𝒓𝒓𝒆𝒏𝒕 𝒍𝒊𝒂𝒃𝒊𝒍𝒊𝒕𝒚
Here,
Current Assets
1268176843 1222369260 1408553466 1,320,330,290
Current Liability
930,201,888 877473962 1128293403 1040962126
Inventory
907342244 715872045 875860190 811,413,008
So,
Year 2011 2012 2013 2014
The acid-test ratio 0.387909983 0.57722193 0.472123 0.488891257
1.15
1.2
1.25
1.3
1.35
1.4
1.45
2011 2012 2013 2014
Current Ratio
3. 3
Decision: Companieswithanacid-testratioof lessthan1 donot have the liquidassets topaytheir
currentliabilitiesandshouldbe treatedwithcaution. The higherthe quickratio,the betterthe position
of the company.The commonlyacceptable currentratiois1, but mayvary fromindustryto industry.So
the 2012 (0.57722193) is more acceptable.
Activity Ratio:
Measure the speed with which various accounts are converted into sales or cash inflows or
outflows.
Inventory Turnover
Inventory turnover is a ratio showing how many times a company's inventory is sold and
replaced over a period. The days in the period can then be divided by the inventory turnover
formula to calculate the days it takes to sell the inventory on hand or "inventory turnover days."
Formulas:
𝑪𝒐𝒔𝒕 𝒐𝒇 𝒈𝒐𝒐𝒅𝒔 𝒔𝒐𝒍𝒅
𝐈𝐯𝐞𝐧𝐭𝐨𝐫𝐲
Here,
year 2011 2012 2013 2014
Inventory
907342244 715872045 875860190 811,413,008
Cost of Goods Sold
2,942,378,953 3,629,828,686 2,948,342,362 3,546,802,966
0
0.2
0.4
0.6
0.8
2011 2012 2013 2014
Qucik(Acid-Test) Ratio
4. 4
So,
Year 2011 2012 2013 2014
Inventory turnover 3.242854582 5.07049928 3.3662249 4.371143833
Decision: This ratio should be compared against industry averages. A low turnover implies poor
sales and, therefore, excess inventory. A high ratio implies either strong sales or ineffective
buying. High inventory levels are unhealthy because they represent an investment with a rate of
return of zero. It also opens the company up to trouble should prices begin to fall. Here, the low
turnover is 2011 (3.242854582) and high turnover is 2012 (5.07049928).
Average Collection Period
The approximate amount of time that it takes for a business to receive payments owed, in terms
of receivables, from its customers and clients.
Formulas:
Accounts Reciveable
Average sales per day
0
1
2
3
4
5
6
2011 2012 2013 2014
Invetory Turnover
Invetory Turnover
5. 5
Here,
Year 2011 2012 2013 2014
Accounts Receivable
9,308,500 82,036,136 98,149,748 29,909,719
Average Sales Per Day
3,207,314,733 3,933,346,104 3,305,717,280 3,844,681,256
So,
Year 2011 2012 2013 2014
Average Collection Period 1.059329309 7.61265062 10.837181 2.83951951
Decision: Effective accounts receivable management practices lead to timely customer
collection. Tight credit policies have spill-over effects for the rest of a company's operations.
Here, 2013 (10days) is more acceptable
Average Payment Period
Average payment period means the average period taken by the company in making payments to
its creditors. It is computed by dividing the number of working days in a year by creditor’s
turnover ratio.
0
2
4
6
8
10
12
2011 2012 2013 2014
Average Collection Priod
6. 6
Formulas:
𝐀𝐜𝐜𝐨𝐮𝐧𝐭𝐬 𝐏𝐚𝐲𝐛𝐥𝐞
𝐀𝐯𝐞𝐫𝐚𝐠𝐞 𝐏𝐮𝐫𝐜𝐡𝐚𝐬𝐞𝐬 𝐩𝐞𝐫 𝐝𝐚𝐲
Here
So,
Year 2011 2012 2013 2014
Average Collection Period
0 5.029 6.18 7.2
Decision: A shorter payment period indicates prompt payments to creditors. Like accounts payable
turnover ratio, average payment period also indicates the creditworthiness of the company. But a very
short payment period may be an indication that the company is not taking full advantage of the credit
termsallowedbysuppliers.Here,2014 7 days ismore acceptable.
0
1
2
3
4
5
6
7
8
2011 2012 2013 2014
Average Payment Priod
Year 2011 2012 2013 2014
Accounts Payable
2,802,055 3,336,069 3,982,605 4,564,113
Average Purchase Per Day
327709444 3425897525 3113063169 3481236118
7. 7
Total Asset turnover
The ratio of the value of a company’s sales or revenues generated relative to the value of its assets. The
Asset Turnover ratio can often be used as an indicator of the efficiency with which a company is
deploying its assets in generating revenue
Formulas:
𝐒𝐚𝐥𝐞𝐬
𝐓𝐨𝐭𝐚𝐥 𝐀𝐬𝐬𝐞𝐭
Here,
Sales
3,207,314,733 3,933,346,104 3,305,717,280 3,844,681,256
Total Assets
1,485,154,543 1,571,415,244 1,758,652,867 1,693,029,263
So,
Year 2011 2012 2013 2014
Total Asset
turnover
2.159583155 2.50305966 1.8796872 2.270888838
Decision: The lower the total asset turnover ratio (the lower the Times), as compared to historical
data for the firm and industry data, the more sluggish the firm's sales. This may indicate a problem with
one or more of the asset categories composing total assets - inventory, receivables, or fixed assets.
Here,2012 2.5 times is more acceptable.
0
1
2
3
2011 2012 2013 2014
Total Asset turnover
8. 8
Debt Ratio
A financial ratio that measures the extent of a company’s or consumer’s leverage. The debt ratio is
defined as the ratio of total – long-term and short-term – debt to total assets,expressed as a decimal or
percentage. It can be interpreted as the proportion of a company’s assets that are financed by debt.
Formulas:
𝐓𝐨𝐭𝐚𝐥 𝐋𝐢𝐚𝐛𝐢𝐥𝐢𝐭𝐲
𝐓𝐨𝐭𝐚𝐥 𝐀𝐬𝐬𝐞𝐭𝐬
Here,
Year 2011 2012 2013 2014
Total Assets
1,485,154,543 1,571,415,244 1,758,652,867 1,693,029,263
Total Liability
1,079,963,920 1,019,973,962 1,240,793,403 1,130,977,648
So,
Year 2011 2012 2013 2014
Debt Ratio 0.727172755 0.64907984 0.7055363 0.668020142
Decision: When the debt ratio is low, principal and interest payments don't command such a large
portion of the company's cash flows, and the company is not as sensitive to changes in business or
interestratesfromthis perspective.However, a low debt ratio may also indicate that the company has
an opportunity to use leverage as a means of responsibly growing the business that it is not taking
advantage of. Here, 2012 (0.64907984) is more acceptable.
0.6
0.65
0.7
0.75
2011 2012 2013 2014
Debt Ratio
9. 9
Time Interest Earned Ratio
A metric used to measure a company's ability to meet its debt obligations. It is calculated by
taking a company's earnings before interest and taxes (EBIT) and dividing it by the total interest
payable on bonds and other contractual debt. It is usually quoted as a ratio and indicates how
many times a company can cover its interest charges on a pretax basis
Formulas:
𝐄𝐚𝐫𝐧𝐢𝐧𝐠 𝐁𝐞𝐟𝐨𝐫 𝐈𝐧𝐭𝐞𝐫𝐞𝐬𝐭 𝐚𝐧𝐝 𝐓𝐚𝐱
𝐈𝐧𝐭𝐞𝐫𝐞𝐬𝐭
Here,
Year 2011 2012 2013 2014
Earnings Before Interest and Tax
255876181 284782908 336710675 266559246
Interest
23393735 31270134 47873256 49817670
So,
Year 2011 2012 2013 2014
Time Interest Earned
Ratio
10.93780796 9.10718541 7.0333774 5.350696771
Decision: Generally,aratioof 2 or higherisconsideredadequate toprotectthe creditors’interestin
the firm.A ratioof lessthan1 meansthe companyislikelytohave problemsinpayinginterestonits
borrowings.Here,2014 (5.350696771) is more acceptable
0
2
4
6
8
10
12
2011 2012 2013 2014
Time Interest Earned Ratio
10. 10
Profitability Ratio:
Profitability ratios enable to analysts to evaluate the firm’s profit with respect to a given level of
sales, a certain level of assets or the owners investment.
Gross ProfitMargin:A financial metric used to assess a firm's financial health by revealing
the proportion of money left over from revenues after accounting for the cost of goods sold.
Gross profit margin serves as the source for paying additional expenses and future savings.
Formulas:
Gross Profit
Sales
Here,
Year 2011 2012 2013 2014
Gross Profit
264,935,780 303,517,418 357,374,918 297,878,290
Sales
3,207,314,733 3,933,346,104 3,305,717,280 3,844,681,256
So,
Year 2011 2012 2013 2014
Gross Profit Margin 8.260361145 7.71651947 10.810813 7.747801968
Decision: A company with high gross margin ratios means that the company will have more
money to pay operating expenses like salaries, utilities, and rent. Since this ratio measures the
profits from selling inventory, it also measures the percentage of sales that can be used to help
0
2
4
6
8
10
12
2011 2012 2013 2014
Gross Profit Margin
11. 11
fund other Operating margin ratio shows whether the fixed costs are too high for the production
.Here, 2013 (10.810813) is better than others ratio.
Operating Profit Margin
The operating margin ratio, also known as the operating profit margin, is a profitability ratio that
measures what percentage of total revenues is made up by operating income. In other words, the
operating margin ratio demonstrates how much revenues are left over after all the variable or
operating costs have been paid. Conversely, this ratio shows what proportion of revenues is
available to cover non-operating costs like interest expense
Formulas:
𝐎𝐩𝐞𝐫𝐚𝐭𝐢𝐧𝐠 𝐏𝐫𝐨𝐟𝐢𝐭
𝐒𝐚𝐥𝐞𝐬
Here,
Year 2011 2012 2013 2014
Operating profit
9059599 18734510 20664243 31319044
Sales
3,207,314,733 3,933,346,104 3,305,717,280 3,844,681,256
So,
Year 2011 2012 2013 2014
Operating Profit Margin 0.282466791 0.47629956 0.6251062 0.814607035
Decision: Operating margin ratio shows whether the fixed costs are too high for the production or
sales volume. High or increasing operating margin is preferred because if the operating margin is
0
0.2
0.4
0.6
0.8
1
2011 2012 2013 2014
Operating Profit Margin
12. 12
increasing, the company is earning more per dollar of sales. Here, 2014(0.814607035) is better thanother
ratio.
Net Profit Margin
The profit margin ratio, also called the return on sales ratio or gross profit ratio, is a profitability
ratio that measures the amount of net income earned with each dollar of sales generated by
comparing the net income and net sales of a company. In other words, the profit margin ratio
shows what percentage of sales are left over after all expenses are paid by the business.
Formulas:
𝐄𝐚𝐫𝐧𝐢𝐧𝐠 𝐀𝐯𝐚𝐢𝐥𝐚𝐛𝐥𝐞 𝐟𝐨𝐫 𝐂𝐨𝐦𝐦𝐨𝐧 𝐒𝐭𝐨𝐜𝐤𝐡𝐨𝐥𝐝𝐞𝐫𝐬
𝐒𝐚𝐥𝐞𝐬
Here,
Year 2011 2012 2013 2014
Earning Available for common stockholders 302113045 325943730 190524266 96575100
Sales
3,207,314,733 3,933,346,104 3,305,717,280 3,844,681,256
So,
Year 2011 2012 2013 2014
Net Profit
Margin
0.336566159 0.59524238 4.8210783 0.443224649
13. 13
Decision: Netprofitmarginisanindicatorof how efficientacompanyis andhow well itcontrolsits
costs.The higherthe marginis,the more effectivethe companyisinconvertingrevenue intoactual
profit.Here,2013(4.8210783) is more acceptable.
Earnings per Share
The portion of a company's profit allocated to each outstanding share of common stock. Earnings
per share serves as an indicator of a company's profitability.
Formulas:
𝐄𝐚𝐫𝐧𝐢𝐧𝐠 𝐀𝐯𝐢𝐥𝐚𝐛𝐥𝐞 𝐟𝐨𝐫 𝐜𝐨𝐦𝐦𝐨𝐧 𝐬𝐭𝐨𝐜𝐤𝐡𝐨𝐥𝐝𝐞𝐫𝐬
𝐍𝐮𝐦𝐛𝐞𝐫 𝐨𝐟 𝐬𝐡𝐚𝐫𝐞 𝐨𝐟 𝐜𝐨𝐦𝐦𝐨𝐧 𝐬𝐭𝐨𝐜𝐤 𝐨𝐮𝐭𝐬𝐭𝐚𝐧𝐝𝐢𝐧𝐠
Here,
Year 2011 2012 2013 2014
Earning Available for common stockholders 302113045 325943730 190524266 96575100
Number of share of common stock outstanding
570240 570240 570240 570240
So,
Year 2011 2012 2013 2014
Earnings per share 18.93016274 41.058051 279.48095 29.88316323
0
1
2
3
4
5
6
2011 2012 2013 2014
Net Profit Margin
14. 14
Decision: There isnorule of thumb to interpretearningspershare.The higherthe EPSfigure,the
betteritis.A higherEPSis the signof higherearnings,strongfinancial positionand,therefore,areliable
companyto investmoney.Here,2013(279.48095) is more acceptable
Return on total asset
The return on assets ratio, often called the return on total assets, is a profitability ratio that
measures the net income produced by total assets during a period by comparing net income to the
average total assets. In other words, the return on assets ratio or ROA measures how efficiently a
company can manage its assets to produce profits during a period.
Formulas:
𝐄𝐚𝐫𝐧𝐢𝐧𝐠 𝐀𝐯𝐢𝐥𝐚𝐛𝐥𝐞 𝐟𝐨𝐫 𝐜𝐨𝐦𝐦𝐨𝐧 𝐬𝐭𝐨𝐜𝐤𝐡𝐨𝐥𝐝𝐞𝐫𝐬
𝐓𝐨𝐭𝐚𝐥 𝐀𝐬𝐬𝐞𝐭𝐬
0
50
100
150
200
250
300
2011 2012 2013 2014
EarningPer Share
15. 15
Here,
Year 2011 2012 2013 2014
Earnings Available for common stockholders 302113045 325943730 190524266 96575100
Total Assets
1,485,154,543 1,571,415,244 1,758,652,867 1,693,029,263
So,
Year 2011 2012 2013 2014
The return on assets 0.726842607 1.48992719 9.0621191 1.006513908
Decision: The greater a company's earnings in proportion to its assets (and the greater the
coefficient from this calculation), the more effectively that company is said to be using its assets.
Here, 2013 (9.0621191) is better
0
2
4
6
8
10
2011 2012 2013 2014
Return on total asset
16. 16
Particulars Current Sales 25% (+) increase in sales
Years 2011 2012 2013 2014 2011 2012 2013 2014
Sales 3234242998 3963651163 3350702764 3883739312 40428037487 4954563954 4188378455 5097407841
Less:
Variable
Cost
2942378953 3629828686 2948342362 2532152514 3677973691 4537285858 3685427953 3165190643
Total
Contribution
291864045 333822477 402360402 1351586798 364830057 417278096 502950502 1932217199
Less: Fixed
Operating
Cost
191218095 179840444 196051488 165947788 191218095 179840444 196051488 165947788
EBIT 100645950 153982033 206308914 1185639010 173611962 237437652 306899014 1766269411
Less:
Interest
66457479 107277682 143941673 104130313 66457479 107277682 143941673 104130313
EBT 34188471 46704351 62367241 1081508697 107154483 130159970 162957341 1662139098
Less: Tax 23260883 31164150 47788736 49476094 23260883 31164150 47788736 49476094
EAT 10927588 155402014 14578505 1032032603 83893600 98995820 115168605 1612663004
No. of Share 5702400 5702400 5702400 5702400 5702400 5702400 5702400 5702400
EPS Tk19.16 Tk.2.73 Tk.2.56 Tk.180.98 Tk.147.17 Tk.17.36 Tk.20.1 Tk.282.8
% change in
EBIT
72.5% 54.1% 48.76% 48.97%
% change in
EPS
667.8% 535.9% 689 56.26%
DOL 2.9 t. 2.17 t. 1.95t.t. 1.14 t. 2.9 t. 2.17 t. 1.95t.t. 1.96 t.
DFL 2.94 t. 3.297 t. 3.31t 1.10 t. 2.94 t. 9.89t. 14.13t. 1.15 t.
DTL 8.5times 7.15 6.45 1.25 8.5times 21.44 27.56 2.25
Note: Taka in Million.
17. 17
Decision
2011:
DOL:Since the degree of operating leverage is 2.9 times.25%in sales will
result(2.9*25)=72.5%increase in EBIT.
DFL: Since the degree of Financing leverage is 9.21 times.72.5% in sales increase will result
(2.1*25)=52.5%increase in EPS
DTL: Since the degree of total leverage is 26.7 times.25%in sales will
result(26.7*25)=667.5%increase in EPS.
2012:
DOL: Since the degree of operating leverage is 2.17 times.25% increase in sales will result
(2.17*25)=54.25% increase in Sales
DFL: Since the degree of Financing leverage is 9.89 times.54.25% increase in EBIT will result
(54.25*29.89)=536.53% increase in EPS
DTL: Since the degree of total leverage is 21.44 times.25%in sales will result
(21.44*25)=536%increase in EPS.
2013
DOL: Since the degree of operating leverage is 1.95 times.25% increase in sales will result
(1.95*25)=48.76% increase in EBIT
DFL: Since the degree of Financing leverage is 14.13 times.48.76% increase in EBIT will result
(14.13*48.75)=688.98% increase in EPS
DTL: Since the degree of total leverage is 27.56 times.25% increase sales will result
(27.56*25%)=691.25% increase in EPS.
2014
DOL: Since the degree of operating leverage is 1.96 times.25% increase in sales will result
(1.96*25)=49% increase in EBIT
DFL: Since the degree of Financing leverage is 1.15 times.49% increase in EBIT will result
(1.15*49)=56.35% increase in EPS
DTL: Since the degree of total leverage is 2.25 times.25% increase sales will result
(2.25*25%)=56.25% increase in EPS.