1. PERFORMANCE ANALYSIS
EARNED VALUE ANALYSIS
June 19, 2011
Deborah Obasogie
PM592ON – May 2011 Sec C: Project Cost and Schedule Control
Assignment: Course Project, Part 2 (CP-2)
2. Table of Contents
Project Performance Report...................................................................................................................... 1
Executive Summary.................................................................................................................................... 1
Schedule 1.................................................................................................................................................. 2
In Progress Tasks.................................................................................................................................... 2
Should Have Started Tasks..................................................................................................................... 2
Critical Path Tasks .................................................................................................................................. 3
Not Started Tasks ................................................................................................................................... 3
Performance Analysis ................................................................................................................................ 4
Summary of Performance...................................................................................................................... 6
Assess Cost Performance ....................................................................................................................... 6
Analysis Schedule Progress.................................................................................................................... 6
Estimate at Completion ............................................................................................................................. 7
Control Plan................................................................................................................................................ 7
Revised Estimate at Completion................................................................................................................ 9
Estimate to Complete ............................................................................................................................ 9
Schedule 2.................................................................................................................................................. 9
Appendix A............................................................................................................................................... 10
Appendix B............................................................................................................................................... 13
Appendix C ............................................................................................................................................... 14
Appendix D............................................................................................................................................... 14
3. CP-2 1 /20
Project Performance Report
Executive Summary
The following is the project performance report for the 40% project completion week in
detail. The project began 4/14/2008 and this performance report is as of 10/1/2008. The purpose
this project is to construct an indoor theme amusement park inside an existing building. In
summary, the budget for this project is $4,846,920, budget through 10/1/2008 was estimated at
$2,323,323.80, project actual costs through 10/1/2008 are $1,586,644.79, earned value is
$1,586,725.28, current CPI is 1.00, current SPI is 0.68 and EAC is $4,846,674.13.
Although the project is basically within budget as of 10/1/2008 based on the work rate,
the project is behind schedule. In order to complete the project on time at the current completion
rate adjustments must be made to the current project plan.
Driven by the fact that stakeholders ask for a faster delivery while not willing to reduce
the scope of work, emphasis is placed upon improving the speed by which work is performed to
correct SV. The control plan involves: removing all tasks having free slack in entire project,
scheduling overtime (10 hour days and weekends) to resources responsible for tasks that are in
progress, should have started, not started and critical path and additional resources placed on
tasks as needed throughout the remained of the project. With an 11/1/2008 status date results
revealed: an EV of is $4,799,796.80, increased CPI, increased SPI and a revised EAC of
$4,799,796.80.
As project manager, I am requesting approval to continue the project and allow the work
day weekends and overtime and 3 additional resources to be used as needed to bring the project
back on schedule.
1/20
4. CP-2 2 /20
Schedule 1
This section consists of an MSP Gantt chart schedule which incorporates the provided
project data, established baseline, and proper review date representing the anticipated 40%
completion date. The project has 56 tasks; 180 days of work, from April 14, 2008 to December
19, 2008; 46 dependences, and 43 resources (work and material types). The schedule depicts the
% of project completion and task completion and the anticipated completion date (status date) of
October 1, 2008 is shown as a red line in Gantt chart. For the schedule with project data,
baseline and review date of October 1, 2008 see Appendix A.
Below is a summary of completed tasks, tasks in progress, tasks that should have started,
tasks not started, and critical path tasks. They are shown without summary tasks since they are
not used in the Earned Value results to avoid roll-up data skews.
Completed Tasks
WBS Task Duration Start Finish Predecessors
1.1 Site Layout & Site Grading 10 days Mon 4/14/08 Fri 4/25/08
1.2 Footings & Foundations 55 days Mon 4/28/08 Fri 7/11/08 2
1.3 Masonry 60 days Mon 5/19/08 Fri 8/8/08 3SS+15 days
1.4 Frames, Columns and Beams 40 days Mon 7/7/08 Fri 8/29/08 4SS+35 days
1.6 Slab on Grade 35 days Mon 7/14/08 Fri 8/29/08 3
1.18.1 Stacks & Vents 30 days Mon 7/28/08 Fri 9/5/08 3FS+10 days
1.19.1 Boxes 25 days Mon 7/28/08 Fri 8/29/08 3FS+10 days
In Progress Tasks
WBS Task % Complete Duration Start Finish Predecessors
1.5 Joists & Roof Deck 40% 30 days Mon 9/1/08 Fri 10/10/08 5
1.7 Rough Carpentry 34% 35 days Mon 4/28/08 Fri 10/17/08 7
1.8 Interior Studs 60% 20 days Mon 9/1/08 Fri 9/26/08 7
1.11 Elevator 40% 30 days Mon 9/1/08 Fri 10/10/08 7
1.17.1 Hangers & Supports 93% 40 days Mon 7/28/08 Fri 9/19/08 3FS+10 days
1.18.2 Hangers & Supports 23% 30 days Mon 9/8/08 Fri 10/17/08
1.19.2 Conduit 48% 25 days Mon 9/1/08 Fri 10/3/08 28
1.21.2 Ropes course install & Training 20% 30 days Tue 9/9/08 Mon 10/20/08 7
Should Have Started Tasks
WBS Task Duration Start Finish Predecessors
1.17.2 Pipes & Fittings 1 day Mon 9/22/08 Fri 11/14/08 19
2/20
5. CP-2 3 /20
1.21.1.1 Ferris Wheel to ship 3 days Mon 9/29/08 Wed 10/1/08
Critical Path Tasks
WBS Task Duration Start Finish Predecessors
1.21 Attraction Install and Training 69 day Tue 9/9/08 Fri 12/12/08
1.21.5 Bowling install & Training 40 days Fri 10/17/08 Thu 12/11/08 7
1.21.8 Attraction install and training complete 1 day Fri 12/12/08 Fri 12/12/08 45,46,47,48,49,50,51
1.23 System and Security Training 3 days Mon 12/15/08 Wed 12/17/08 52
1.24 Final Walkthrough 1 day Thu 12/18/08 Thu 12/18/08 12,14,15,16,17,52,53,54
1.25 Grand Opening 1 day Fri 12/19/08 Fri 12/19/08 55
Not Started Tasks
WBS Task Duration Start Finish Predecessors
1.9 Interior Drywall 30 days Fri 10/17/08 Fri 11/21/08 9,6
1.10 Painting 35 days Mon 10/27/08 Fri 12/12/08 10FS-20 days
1.12 Doors 5 days Mon 10/20/08 Fri 10/24/08 8
1.13 Custom Theme Painting 15 days Mon 11/3/08 Fri 11/21/08 11SS+5d
1.14 Flooring 15 days Mon 11/17/08 Fri 12/5/08 10FS-5d
1.15 Finish Carpentry 15 days Mon 11/17/08 Fri 12/5/08 10FS-5d
1.16 Bathroom Compartments/Accessories 3 days Mon 9/22/08 Wed 12/10/08 16
1.17.2 Pipes & Fittings 40 days Mon 11/17/08 Fri 11/14/08 19
1.17.3 Test 5 days Mon 12/15/08 Fri 11/21/08 20
1.18.3 Ductwork & Piping 30 days Mon 10/20/08 Fri 11/28/08 24
1.18.4 Test 5 days Mon 12/1/08 Fri 12/5/08 25
1.19.3 Wiring Devices/Switches/Receptacles 20 days Mon 10/6/08 Fri 10/31/08 29
1.19.4 Light Fixtures 20 days Mon 11/3/08 Fri 11/28/08 30
1.19.5 Test 5 days Mon 12/1/08 Fri 12/5/08 31
1.20 Mechanicals Complete 1 day Mon 12/8/08 Mon 12/8/08 21,6,32
1.21.1.1 Ferris Wheel to ship 3 days Mon 9/29/08 Wed 10/1/08
1.21.1.2 Ferris Wheel Legs & fan install 6 days Thu 10/2/08 Thu 10/9/08 36,7
1.21.1.3 Ferris Wheel gondola install 6 days Fri 10/10/08 Fri 10/17/08 37
1.21.1.4 Ferris Wheel MEP install 6 days Mon 10/20/08 Mon 10/27/08 38
1.21.1.5 Ferris wheel platform design 2 days Tue 10/28/08 Wed 10/29/08 39
1.21.1.6 Ferris Wheel Platform 6 days Thu 10/30/08 Thu 11/6/08 40
1.21.1.7 Ferris Wheel Railing 6 days Fri 11/7/08 Fri 11/14/08 41
1.21.1.8 Ferris wheel turnstile 3 days Mon 11/17/08 Wed 11/19/08 42
1.21.1.9 Ferris wheel Training 1 days Thu 11/20/08 Thu 11/20/08 43
1.21.1.10 Ferris Wheel Certification 1 day Fri 11/21/08 Fri 11/21/08 44
1.21.3 Climbing wall install & Training 10 days Mon 11/24/08 Fri 12/5/08 7
1.21.4 Carousel install & Training 13 days Thu 11/6/08 Mon 11/24/08 7
1.21.5 Bowling install & Training 40 days Fri 10/17/08 Thu 12/11/08 7
1.21.6 Go Cart install & Training 45 days Mon 10/6/08 Fri 12/5/08 7
1.21.7 Mini Golf install & Training 15 days Mon 11/17/08 Fri 12/5/08 7
1.21.8 Attraction install and training complete 1 day Fri 12/12/08 Fri 12/12/08 45,46,47,48,49,50,51
1.22 Furniture Installation 5 days Mon 12/8/08 Fri 12/12/08
1.23 System and Security Training 3 days Mon 12/15/08 Wed 12/17/08 52
1.24 Final Walkthrough 1 day Thu 12/18/08 Thu 12/18/08 12,14,15,16,17,52,53,54
1.25 Grand Opening 1 day Fri 12/19/08 Fri 12/19/08 55
3/20
6. CP-2 4 /20
Performance Analysis
Earned value analysis is a method for measuring project performance. It indicates how
much of the budget should have been spent, in view of the amount of work done so far and the
baseline cost for the task, assignment, or resources. The performance analysis section utilizes the
earned value data to analyze the project cost and schedule performance. Earned Value
calculations are based on the October 1, 2008. For the project WBS see Appendix B.
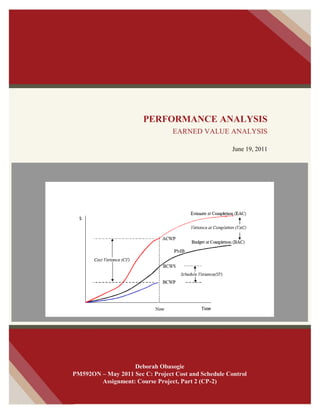
The following definitions are provided to help guide earned value reporting and analysis:
1. ACWP (Actual Cost of Worked Performed): Is the total cost taken to complete the work
as of a reporting date; PMI uses actual cost (AC). This is calculated as: AC or ACWP =
Hourly Rate * Total Hours Spent.
2. BAC (Budget at Completion): Is the total budget allocated to the project. BAC is calculated
using the following formula: BAC = Base lined Effort-hours * Hourly Rate.
3. BCWP (Budgeted Cost of Work Performed): Is the total cost of the work
completed/performed as of a reporting date, also known as earned value; PMI uses EV. EV
or BCWP = Base lined Cost * % Complete Actual.
4. BCWS (Budgeted Cost of Work Scheduled): Is the total cost of the work scheduled
/Planned as of a reporting date; PMI uses planned value (PV). BCWS = Hourly Rate * Total
Hours Planned or Scheduled.
5. CPI (Cost Performance Index): The ratio of budgeted cost to actual cost (BCWP/ACWP).
It’s an index showing the efficiency of the utilization of the resources on the project. The
4/20
7. CP-2 5 /20
formula is CPI = BCWP / ACWP. CPI value above 1 indicates efficiency in utilizing the
resources allocated to the project is good. CPI value below 1 indicates efficiency in utilizing
the resources allocated to the project is not good.
6. CV (Cost Variance): Any difference between the estimated cost of an activity and the
actual cost of that activity. It indicates how much over or under budget the project is.
Positive CV indicates the project is under budget. Negative CV indicates the project is over
budget. In earned value, BCWP less ACWP.
7. EAC (Estimate at Completion): Is the estimated cost of the project at the end of the
project. There are three methods to calculate EAC, however in our analysis we will use the
method where EAC = ACWP (if task is complete) + Budgeted cost (if task is not started) +
Task Budget / CPI (if task is underway).
8. ETC (Estimate to Complete): The estimated cost required to complete the remainder of the
project.
9. EV (Earned Value): This is also referred to as Budgeted Cost of Work Performed (BCWP).
See above.
10. SPI (Schedule Performance Index): Ratio (schedule efficiency ratio) between the planned
budgets verses the amount of budget earned to work accomplish. It is an index showing the
efficiency of the time utilized on the project. SPI value above 1 indicates project team is very
efficient in utilizing the time allocated to the project. SPI value below 1 indicates project team is less
efficient in utilizing the time allocated to the project. Formula: SPI = EV/PV.
11. SV (Schedule Variance): Measure of schedule slippage. The difference between the planned
budget and the amount of budget earned to work accomplish. A positive SV is an indication
5/20
8. CP-2 6 /20
that in-process work is ahead of schedule. A negative SV indicates that the in-process work
is behind schedule. Formula: SV = EV - PV.
12. % Completed Planned: The percentage of work which was planned to be completed by the
reporting date. This is calculated using the following formula: % Completed Planned = PV /
BAC.
13. % Completed Actual: The percentage of work which was actually completed by the
reporting date. This is calculated using the following formula % Completed Actual = AC /
EAC.
Summary of Performance
The entire Earned Value Report is depicted in Appendix C. Below is summary and
analysis of the report information.
Summary of Performance as of October 1, 2008
BCWS (PV) BCWP
(EV)
ACWP
(AC)
CV SV CPI SPI
$2,323,323.80 $1,586,725.28 $1,586,644.79 $80.49 -$736,598.53 1.00 0.68
Assess Cost Performance
By October 1, 2008, we have EV of $1,586,725.28 and an AC of $1,586,644.79. We have
a little more earned value than actual cost in the project. CV equals $80.49 and the CPI equals
1.00. These results display the project costs so far are exactly the same as the budget for work
actually done and that work was accomplished for less resource expenditure than planned. The
project is $80.49 under budget. A 1.00 CPI translates to you getting 1.00 dollars of results for
every dollar you put into the project.
Analysis Schedule Progress
6/20
9. CP-2 7 /20
The EV, $1,586,725.28, is the amount we expected to spend on the work that has been
accomplished to date. The PV is $2,323,323.80 which is the amount we expect to spend to date.
SV equals -$736,598.53 and the SPI equal 0.68. The results indicate that the project is
dangerously behind the estimated schedule, and that the project team is less efficient in utilizing
the time allocated to the project. A 0.68 SPI translates to the project progressing at 68 percent of
the rate originally planned.
Estimate at Completion
We will use actual cost to date (includes any variance) and add the budgeted cost of the
tasks that have not been started, and then add the performance adjusted costs of tasks underway.
You can think of this as a "one-time" adjustment to the project budget. Task budgets are
accounted for individually based on the task status at the time of the review and we also apply
the current task performance to the task budget for tasks underway. EAC is calculated as
follows: EAC = ACWP (if task is complete) + Budgeted cost (if task is not started) + Task
Budget / CPI (if task is underway). EAC equals $4,846,674.13 and BAC equals $4,846,920.00.
The EAC indicates the project actual cost will be less than the budgeted amount by $245.87
when calculating using the method.
Control Plan
Driven by the fact that stakeholders ask for a faster delivery while not willing to reduce
the scope of work, to correct SV emphasis is placed upon improving the speed by which work is
performed. The control plan involves: removing all tasks having free slack in entire project,
scheduling overtime (10 hour days and weekends) to resources responsible for tasks that are in
7/20
10. CP-2 8 /20
progress, should have started, not stated and critical path and additional resources (3) placed on
tasks as needed throughout the remained of the project.
Slack times are identified and minimized. Once there is acceptance, we start thinking of
ways to reduce slack times and improve productivity. Focus is on keeping estimates and
dependencies accurate. Strategies employed include: give additional tasks to the resource
assigned during the slack time, ask the resource to help out in other tasks (non-critical and
critical) and share the resource with another task.
Scheduling overtime is used to reduce the time on tasks that are in progress, should have
started, not stated and critical path as needed. Resources are scheduled to work parallel to have
task completed in half the time, or to join a task due to schedule slippage or to assign a more
productive resource who can finish earlier.
Among risks associated efficiency of process are costs, so each task will be evaluated
against its specific requirements. For example, there may be difference among resource rates
or/and tasks that cannot be performed by two persons, like hammering a nail. However, the
removal of slack is the greatest risk to the process.
Schedule variance is at a concerned level and must be completed as originally scheduled
in order to be back on schedule by 11/1/2008. With weekly monitoring through 11/1/2008 the
project should easily be back on schedule. At that time, a reevaluation of any task behind
schedule can be adjusted for the final push. The ideal state is result is BCWS = BCWP and
ACWP = EAC.
8/20
11. CP-2 9 /20
Revised Estimate at Completion
Below is the revised estimates by moving the project status date from 10/1/2008 to
11/1/2008 and increasing the percentage of work completed from 40% to only 72%.
Estimated Summary of Performance Results as of 11/1/2008
Estimated Summary of Performance as of 11/1/2008
BCWS
(PV)
BCWP
(EV)
ACWP
(AC)
CPI SPI EAC BAC
$3,253,945.24 $3,228,483.08 $3,197,094.80 1.01 0.99 $4,799,796.80 $4,846,920.00
At this point, the project CPI and SPI have increased. EAC now equals $4,799,796.80
and BAC equals $4,846,920.00. The difference between the estimated cost at completion and the
budgeted cost is $47,123.2. However as the project gets closer to completion we expect the
EAC and BAC to be the same amount.
Estimate to Complete
Now we can look at the difference between the updated estimate on how much the
project will cost, EAC, and how much you have already spent, AC. By taking the EAC (estimate
at completion) and subtract the AC (actual cost), or ETC = EAC-AC. The EAC is $4,846,920.00
subtract the AC is $3,197,094.80 equals $1,602,702, the result of how much more you expect to
spend to complete the project.
Schedule 2
Schedule 2 reflects the impact of the corrective actions. Although the start and finish
dates for the project are the same as schedule 1, the project duration has been reduced from 180
days to 144 days and the critical path has also been reduced from 115 hours to 92 hours. For
schedule 2 see Appendix D.
9/20