Irish life weekly investment bulletin
•
1 j'aime•762 vues

The weekly investment bulletin provides an overview of market performance and news from the past week: - Fears about the US economy caused investors to move into safe haven assets like government bonds and the yen, causing equities and commodities to fall sharply. - Comments from the Federal Reserve chairman helped improve sentiment by signaling the central bank's willingness to further support the economy. - Ireland was downgraded by S&P on concerns about its banking system, while most market indexes fell over the past week.

Recommandé
Contenu connexe
Tendances
Tendances (19)
En vedette
En vedette (18)
Similaire à Irish life weekly investment bulletin
Similaire à Irish life weekly investment bulletin (20)
Dernier
Dernier (20)
Irish life weekly investment bulletin
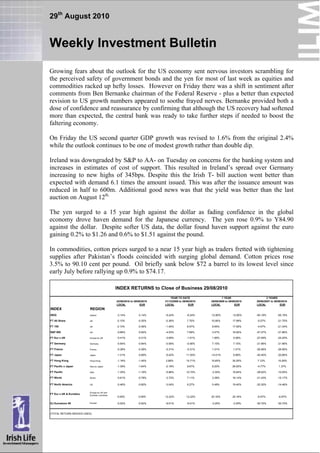
- 1. 29th August 2010 Weekly Investment Bulletin Growing fears about the outlook for the US economy sent nervous investors scrambling for the perceived safety of government bonds and the yen for most of last week as equities and commodities racked up hefty losses. However on Friday there was a shift in sentiment after comments from Ben Bernanke chairman of the Federal Reserve - plus a better than expected revision to US growth numbers appeared to soothe frayed nerves. Bernanke provided both a dose of confidence and reassurance by confirming that although the US recovery had softened more than expected, the central bank was ready to take further steps if needed to boost the faltering economy. On Friday the US second quarter GDP growth was revised to 1.6% from the original 2.4% while the outlook continues to be one of modest growth rather than double dip. Ireland was downgraded by S&P to AA- on Tuesday on concerns for the banking system and increases in estimates of cost of support. This resulted in Ireland’s spread over Germany increasing to new highs of 345bps. Despite this the Irish T- bill auction went better than expected with demand 6.1 times the amount issued. This was after the issuance amount was reduced in half to 600m. Additional good news was that the yield was better than the last auction on August 12th. The yen surged to a 15 year high against the dollar as fading confidence in the global economy drove haven demand for the Japanese currency. The yen rose 0.9% to Y84.90 against the dollar. Despite softer US data, the dollar found haven support against the euro gaining 0.2% to $1.26 and 0.6% to $1.51 against the pound. In commodities, cotton prices surged to a near 15 year high as traders fretted with tightening supplies after Pakistan’s floods coincided with surging global demand. Cotton prices rose 3.5% to 90.10 cent per pound. Oil briefly sank below $72 a barrel to its lowest level since early July before rallying up 0.9% to $74.17. INDEX RETURNS to Close of Business 29/08/2010 YEAR TO DATE 1 YEAR 3 YEARS 22/08/2010 to 29/08/2010 31/12/2009 to 29/08/2010 29/08/2009 to 29/08/2010 29/08/2007 to 29/08/2010 LOCAL EUR LOCAL EUR LOCAL EUR LOCAL EUR INDEX REGION ISEQ Ireland -3.14% -3.14% -9.24% -9.24% -12.80% -12.80% -65.19% -65.19% FT All Share UK 0.13% -0.35% -0.36% 7.70% 10.06% 17.99% -5.07% -21.75% FT 100 UK 0.13% -0.36% -1.40% 6.57% 9.65% 17.55% -4.57% -21.34% S&P 500 US -0.66% -0.92% -4.53% 7.69% 3.47% 16.92% -27.27% -21.96% FT Eur x UK Europe ex UK -0.41% -0.31% -3.69% -1.01% 1.85% 5.06% -27.09% -24.25% FT Germany Germany -0.94% -0.94% -0.06% -0.06% 7.15% 7.15% -21.96% -21.96% FT France France -0.38% -0.38% -5.31% -5.31% 1.01% 1.01% -26.56% -26.56% FT Japan Japan -1.31% -0.69% -9.42% 11.93% -14.01% 6.89% -45.40% -20.66% FT Hong Kong Hong Kong -1.16% -1.45% 2.89% 15.71% 15.65% 30.25% 7.12% 15.29% FT Pacific x Japan Asia ex Japan -1.39% -1.64% -2.18% 9.67% 8.20% 26.93% -4.77% 1.37% FT Pacific Asia -1.35% -1.19% -5.88% 10.72% -3.30% 16.84% -28.62% -10.05% FT World World -0.61% -0.78% -3.72% 7.11% 3.38% 16.14% -21.43% -15.17% FT North America US -0.46% -0.80% -3.04% 9.27% 5.48% 19.40% -20.30% -14.46% Europe ex UK and FT Eur x UK & Eurobloc Eurobloc countries 0.09% 0.09% 12.22% 12.22% 20.16% 20.16% -6.97% -6.97% DJ Eurostoxx 50 Europe -0.52% -0.52% -9.01% -9.01% -3.25% -3.25% -30.72% -30.72% (TOTAL RETURN INDICES USED)
- 2. 29th August 2010 Weekly Investment Bulletin Performance Report Offer to Offer - Local Currency Close of Business - 27th August 2010 Annualised Annualised Fund Name 1 Week 1 Month Year to Date 1 Year 3 Years 5 Years Performance Performance Irish Domestic Funds (Gross) European Equity Irish Life Europascope 2 G -2.54% -4.95% -10.21% -4.24% -33.42% -12.68% -9.58% -1.99% Guaranteed Irish Life Securescope 2 G -0.44% -0.44% 0.70% 2.33% -3.01% -1.01% 4.57% 0.90% International Equity Irish Life Globalscope 2 G -1.59% -2.80% -0.18% 7.54% -27.51% -10.17% -17.38% -3.75% Irish Life Fidelity Man Inter 1 G -1.91% -0.65% 9.75% 18.64% -12.92% -4.51% 6.46% 1.26% Irish Equity Irish Life Celticscope 2 G -6.49% -12.20% -16.69% -18.18% -71.92% -34.52% -64.63% -18.77% Managed Balanced Irish Life Wisdomscope 2 G -1.26% -1.85% 2.70% 7.52% -23.88% -8.70% -6.80% -1.40% Property Irish Life UK Property 1 G -0.11% 0.91% 14.54% 20.11% -38.41% -14.92% -26.75% -6.04% Irish Life Property 1 G 0.00% -0.22% 0.57% -4.20% -59.85% -26.23% -45.96% -11.58% Specialist Funds Irish Life BancScope 2 G -2.38% -4.95% 0.49% -2.69% -47.66% -19.41% -37.56% -8.99% Technology Irish Life Telescope 2 G -0.91% 1.05% 3.82% 11.40% -11.13% -3.86% 8.75% 1.69% Irish Life Techscope 2 G -1.91% -4.95% 6.96% 20.68% -4.16% -1.41% 6.96% 1.35% Irish Individual Pensions Cash (Ind) Irish Life (Ind) Exempt Cash 3 0.04% 0.19% 1.39% 2.02% 9.36% 3.03% 14.72% 2.78% Fixed Interest (Ind) Irish Life (Ind) Exempt Fixed Interest 3 0.99% 4.13% 9.69% 10.19% 26.25% 8.08% 23.49% 4.31% General Equity (Ind) Irish Life (Ind) Exempt Equity 3P -2.06% -3.24% 1.64% 9.11% -28.29% -10.49% -9.25% -1.92% Guaranteed (Ind) Irish Life (Ind) Exempt Guaranteed 3 0.00% 0.02% 0.27% 0.27% 1.53% 0.51% 7.38% 1.43% International Equity (Ind) Irish Life (Ind) Fidelity Managed Intl 4 -1.97% -0.82% 10.03% 19.18% -11.89% -4.13% 8.61% 1.67% Managed Balanced (Ind) Irish Life (Ind) Exempt Consensus -1.25% -1.76% 3.26% 8.46% -21.90% -7.91% -2.74% -0.55% Irish Group Pensions Managed Balanced (Grp) Irish Life (Grp) Exempt Active Managed 2P -1.49% -2.25% 2.41% 7.50% -22.59% -8.18% -4.41% -0.90% With Profit (Grp) Irish Life (Grp) Exempt Secure Perf 0.00% 0.00% 0.00% 0.00% 7.53% 2.45% 20.90% 3.87% Irish Unit Linked Funds (Net) American Equity Irish Life Nth American 4 N -1.40% -3.09% 4.33% 11.37% -12.29% -4.28% -3.03% -0.61% Cash Irish Life Cash 4 N 0.04% 0.11% 0.90% 1.28% 7.28% 2.37% 10.99% 2.11% European Equity Irish Life European 4 N -2.14% -3.33% -5.36% 0.44% -24.44% -8.92% 1.24% 0.25% Irish Life Europascope N -2.28% -4.45% -9.05% -5.10% -29.99% -11.20% -9.27% -1.93% Fixed Interest Irish Life Hi-Income 4 N 0.79% 3.29% 7.45% 7.74% 21.43% 6.69% 17.67% 3.31% Guaranteed Irish Life Securescope N -0.36% 0.00% 1.02% 2.36% -3.14% -1.06% 1.76% 0.35% International Equity Irish Life Globalscope N -1.55% -2.90% -0.35% 7.14% -29.54% -11.02% -21.70% -4.78% Irish Equity Irish Life Irish Equity 4 N -4.84% -9.77% -10.21% -11.43% -63.67% -28.64% -55.59% -14.99% Japanese Equity Irish Life Far East 4 N -2.13% -0.49% 8.70% 12.03% -18.88% -6.74% -0.62% -0.12% Managed Aggressive Irish Life Venture Man 4 N -1.77% -2.61% 1.01% 6.04% -25.81% -9.47% -10.38% -2.17% Managed Balanced Irish Life Active Man 4 N -1.27% -1.58% 1.92% 5.68% -22.52% -8.15% -7.99% -1.65% Irish Life Inter'l Man 4 N -1.04% -0.98% 2.92% 7.47% -14.98% -5.27% 0.97% 0.19% Irish Life Wisdomscope N -1.11% -1.58% 1.88% 5.59% -22.66% -8.21% -9.05% -1.88% Property Irish Life Property Mod 1 N 0.00% -0.37% 0.20% -4.46% -56.29% -24.11% -41.87% -10.28% Irish Life UK Property Inv N -0.07% 0.91% 13.58% 16.96% -36.86% -14.21% -26.68% -6.02% Specialist Funds Irish Life Telescope N -0.76% 0.87% 3.08% 9.83% -11.04% -3.83% 5.80% 1.13% Irish Life Techscope N -1.49% -3.87% 4.38% 17.09% -4.33% -1.47% 3.47% 0.69% UK Equity Irish Life UK Equity 4 N -1.00% -0.88% 6.11% 14.43% -23.11% -8.39% -6.84% -1.41% Income Reinvested on Ex-Dividend Date DISCLOSURE:- Irish Life Investment Managers Limited is regulated by the Financial Regulator. While Irish Life Investment Managers uses reasonable efforts to ensure that the information contained in this document is current, accurate and complete at the date of publication, no representations or warranties are made (express or implied) as to the reliability, accuracy or completeness of such information. Irish Life Investment Managers therefore cannot be held liable for any loss arising directly or indirectly from the use of, or any action taken in reliance on, any information contained in this document. This material is for information only and does not constitute an offer or recommendation to buy or sell any investment, or subscribe to any investment management or advisory service. The performance shown represents past performance and does not guarantee future results. Past performance is not indicative of future results.