
Recommandé
Contenu connexe
Plus de Spectrum
Plus de Spectrum (20)
Dernier
Dernier (20)
Threshold Analytics for the Call Center
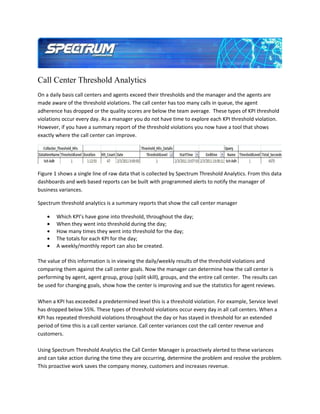
- 1. Call Center Threshold Analytics On a daily basis call centers and agents exceed their thresholds and the manager and the agents are made aware of the threshold violations. The call center has too many calls in queue, the agent adherence has dropped or the quality scores are below the team average. These types of KPI threshold violations occur every day. As a manager you do not have time to explore each KPI threshold violation. However, if you have a summary report of the threshold violations you now have a tool that shows exactly where the call center can improve. Figure 1 shows a single line of raw data that is collected by Spectrum Threshold Analytics. From this data dashboards and web based reports can be built with programmed alerts to notify the manager of business variances. Spectrum threshold analytics is a summary reports that show the call center manager • Which KPI’s have gone into threshold, throughout the day; • When they went into threshold during the day; • How many times they went into threshold for the day; • The totals for each KPI for the day; • A weekly/monthly report can also be created. The value of this information is in viewing the daily/weekly results of the threshold violations and comparing them against the call center goals. Now the manager can determine how the call center is performing by agent, agent group, group (split skill), groups, and the entire call center. The results can be used for changing goals, show how the center is improving and sue the statistics for agent reviews. When a KPI has exceeded a predetermined level this is a threshold violation. For example, Service level has dropped below 55%. These types of threshold violations occur every day in all call centers. When a KPI has repeated threshold violations throughout the day or has stayed in threshold for an extended period of time this is a call center variance. Call center variances cost the call center revenue and customers. Using Spectrum Threshold Analytics the Call Center Manager is proactively alerted to these variances and can take action during the time they are occurring, determine the problem and resolve the problem. This proactive work saves the company money, customers and increases revenue.
- 2. Brief Case Study: A retail sales call center was exceeding the number of calls in queue each day. The manager was aware the call center had one or two threshold violations per day. When the Spectrum threshold analytics was installed it was quickly determined the threshold violation would START early in the morning and sometime NEVER come out of threshold. The number of calls was not enough to trigger a change by the WFM so this gap was costing this retail call center revenue throughout the year by calls being abandoned. The manager added one more agent to this skill group and was able to reduce the abandonment rate from 5.8% to 2.6% and increase revenue by almost $5,000 per month. The ROI for this customer was approximately 11 months. Spectrum Threshold Analytics is not limited to the ACD. Spectrum can run analytics against any data source the customer provides Spectrum access to. Spectrum uses the customer’s threshold goals and then is able to run the Threshold Analytics reports. Dashboards and web based reports are most often used by Call Center Managers to review and analyze the threshold analytics. The dashboards are effectively used by managers to see a real time view of ACD, WFM, CRM, etc metrics and statistics. Web based reports are ideal for the manager and senior manager that are traveling or want a more detailed level of drill down into the statistics. A dashboard showing a summary report of threshold analytics as well as a set of gauges that are highlighting real time data. Threshold analytics offers a new view into the KPI thresholds for the call center. Managers now have the tools to see how the agent, group, groups, and entire call center is performing against the goals. This information can be used to more accurately determine staffing, agent performance levels, team leader performance and overall call center performance. A web report with two layers of drill down to determine the cause of the business variance.
- 3. Utilizing trended data the call center manager now has the tools to show how the call center is improving over time by showing the reduction in threshold violations over time. These same tools can be used to direct an agent to training, show that call center goals are too lenient or strict, assist with WFM scheduling and reinforce the value of the call center to management. Spectrum Threshold Analytics provides the Call Center Manager with the tools to make the call center more effective and efficient by pinpointing the areas that are not meeting company goals. Spectrum is a leading provider of Unified Contact Center Reporting. Contact Spectrum today to learn more about Contact Center Activity Monitoring and Unified Reporting. Follow Spectrum Corporation: • SlideShare • LinkedIn • Blog Dan Boehm VP Sales and Marketing Spectrum dan@specorp.com +1 713 986 8839