Mercer county real estate market update 7.26.10
•Télécharger en tant que PPT, PDF•
0 j'aime•314 vues

Mercer County Real Estate Market Stats 7 12-10 The facts are in the data. Know the market and get information that you can't find anywhere else on the web. Check out my market update and let me know how I can help you with your real estate needs. The following stats on West Windsor, Lawrence, East Windsor, Ewing, Hopewell, Cranbury, Plainsboro, South Brunswick, Montgomery, Hamilton, Franklin, Princeton Township, Princeton Boro, Robbinsville, Hightstown, Penningtion, and Monroe are provided: Active Listings NJ Pending in Last 30 Days Absorption Rate New Listings Net Gain (Loss) to Market Listings Reduced in 30 Days % of Inventory Reduced Expired Listings Withdrawn Listings Closed Listings

Recommandé
Contenu connexe
Plus de Weichert Real Estate Agent
Plus de Weichert Real Estate Agent (20)
Dernier
Dernier (20)
Mercer county real estate market update 7.26.10
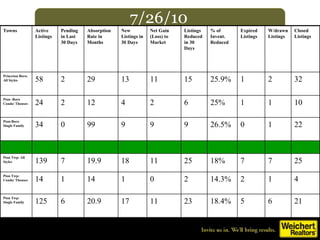
- 1. 7/26/10 Towns Active Listings Pending in Last 30 Days Absorption Rate in Months New Listings in 30 Days Net Gain (Loss) to Market Listings Reduced in 30 Days % of Invent. Reduced Expired Listings W/drawn Listings Closed Listings Princeton Boro: All Styles 58 2 29 13 11 15 25.9% 1 2 32 Pton -Boro Condo/ Thouses 24 2 12 4 2 6 25% 1 1 10 Pton-Boro Single Family 34 0 99 9 9 9 26.5% 0 1 22 Pton Twp: All Styles 139 7 19.9 18 11 25 18% 7 7 25 Pton Twp: Condo/ Thouses 14 1 14 1 0 2 14.3% 2 1 4 Pton Twp: Single Family 125 6 20.9 17 11 23 18.4% 5 6 21
- 2. 7/26/10 Towns Active Listings Pending in Last 30 Days Absorption Rate in Months New Listings in 30 Days Net Gain (Loss) to Market Li1stings Reduced in 30 Days % of Invent. Reduced Expired Listings W/drawn Listings Closed Listings West Windsor: All Styles 145 21 6.9 31 10 38 26.2% 6 8 40 West Windsor Condo/ T.Houses 26 3 8.7 11 8 5 19.2% 2 2 9 West Windsor 55+ 8 1 8 1 0 -- -- 0 5 2 West Windsor Single Family 111 17 6.5 19 2 33 29.7% 4 1 29 Lawrence: All Styles 246 9 27.3 42 33 55 22.3% 15 15 28 Lawrence: Condo/ THouses 75 3 25 14 11 24 32% 4 5 15 Lawrence: 55+ 23 2 11.5 4 2 -- -- 2 1 0 Lawrence: Single Family 148 4 37 24 20 31 20.1% 9 9 13
- 3. 7/26/10 Towns Active Listings Pending in Last 30 Days Absorption Rate in Months New Listings in 30 Days Net Gain (Loss) to Market Listings Reduced in 30 Days % of Invent. Reduced Expired Listings W/drawn Listings Closed Listings PlainsboroAll Styles 82 16 5 21 5 12 15% 2 0 13 Plainsboro Condo/ THouses 42 8 5.3 14 6 5 12% 1 0 4 Plainsboro 55+ 12 1 12 0 -1 0 0 0 0 0 Plainsboro Single Family 28 7 4 7 0 7 25% 1 0 9 Cranbury: All Styles 26 3 8.6 7 4 7 27% 1 0 2 Cranbury: 55+ 2 0 2 1 1 1 50% 0 0 1 Cranbury: Single Family 24 3 8 6 3 6 25% 1 0 1
- 4. 7/26/10 Towns Active Listings Pending in Last 30 Days Absorption Rate in Months New Listings in 30 Days Net Gain (Loss) to Market Listings Reduced in 30 Days % of Invent. Reduced Expired Listings W/drawn Listings Closed Listings Ewing: All Styles 290 4 72.5 44 40 71 24.5% 18 8 20 Ewing : Condo/ T.Houses 46 0 99 6 6 13 28.3% 3 3 2 Ewing 55+: 8 1 8 0 -1 -- -- 0 0 0 Ewing: Single Family 236 3 78.7 38 35 58 24.6% 15 5 18 East Windsor: All Styles 231 7 33 44 37 42 18.2% 11 6 14 East Windsor: Condo/ THouses 130 6 21.7 25 19 20 15.4% 7 2 5 East Windsor: 55+ 21 0 99 2 2 -- -- 2 0 2 East Windsor: Single Family 80 1 80 17 16 22 27.5% 2 4 7
- 5. 7/26/10 Towns Active Listings Pending in Last 30 Days Absorption Rate in Months New Listings in 30 Days Net Gain (Loss) to Market Listings Reduced in 30 Days % of Invent. Reduced Expired Listings W/drawn Listings Closed Listings Hopewell Twp. All Styles 180 18 10 32 14 29 16% 6 11 21 Hopewell Twp. Condo/ T.Houses 13 4 3 3 (1) 0 0 1 2 8 Hopewell Twp.: 55+ 11 0 99 - - - - - - Hopewell Twp Single Family 156 14 11 29 15 29 19% 5 9 13 Hamilton: All Styles 639 59 11 109 50 151 24% 54 23 48 Hamilton: Condo/ THouses 115 12 10 24 12 27 23% 13 6 15 Hamilton: Single Family 479 45 11 85 40 124 26% 41 17 33 Hamilton: 55+ 45 2 22.5
- 6. 7/26/10 Towns Active Listings Pending in Last 30 Days Absorption Rate in Months New Listings in 30 Days Net Gain (Loss) to Market Listings Reduced in 30 Days % of Invent. Reduced Expired Listings W/drawn Listings Closed Listings Robbinsville All Styles 154 10 15 28 18 39 25% 9 6 15 Robbinsville Condo/ T.Houses 76 7 11 10 3 18 24% 6 2 9 Single Family 78 3 26 18 15 21 27% 3 4 8 Hightstown Boro: All Styles 72 3 24 14 11 15 21% 12 4 0 Pennington 18 4 4.5 1 (3) 6 33% 1 1 2 Hopewell Boro 19 3 6 2 (1) 4 22% 0 6 3
- 7. 7/26/10 Towns Active Listings Pending in Last 30 Days Absorption Rate in Months New Listings in 30 Days Net Gain (Loss) to Market Listings Reduced in 30 Days % of Invent. Reduced Expired Listings W/drawn Listings Closed Listings South Brunswick All Styles 251 19 13 64 45 50 23% 17 3 32 South BrunswickCondo/ T.Houses 74 10 7.5 22 12 23 31% 3 1 13 South Brunswick 55+ 38 4 9 7 3 4 11% 1 0 1 South Brunswick Single Family 139 5 28 35 30 23 17% 13 2 18 Monroe: All Styles 479 43 11 86 43 87 18% 55 4 39 Monroe: 55+ 307 25 12 53 28 63 21% 28 3 25 Monroe: Single Family 172 18 9.5 33 15 24 14% 27 1 14
- 8. 7/26/10 Towns Active Listings Pending in Last 30 Days Absorption Rate in Months New Listings in 30 Days Net Gain (Loss) to Market Listings Reduced in 30 Days % of Invent. Reduced Expired Listings W/drawn Listings Closed Listings Montgomery All Styles 164 11 15 30 -16 45 27% 8 9 29 Montgomery Condo/Twnhms 23 3 8 2 -6 2 8% 1 3 4 Single Family 141 8 18 28 -10 43 30% 7 6 25 Hillsborough All Styles 259 16 16 53 7 62 24% 15 12 19 Hillsborough Condo/Twnhms 72 7 10 15 2 24 33% 5 4 4 Hillsborough Single Family 187 9 21 38 5 38 20% 10 8 15
Notes de l'éditeur
- Populate this table to show the local absorption rate in the various price ranges that are appropriate for your market area. Please add or delete rows as necessary to adequately reflect local conditions.
- Populate this table to show the local absorption rate in the various price ranges that are appropriate for your market area. Please add or delete rows as necessary to adequately reflect local conditions.
- Populate this table to show the local absorption rate in the various price ranges that are appropriate for your market area. Please add or delete rows as necessary to adequately reflect local conditions.
- Populate this table to show the local absorption rate in the various price ranges that are appropriate for your market area. Please add or delete rows as necessary to adequately reflect local conditions.
- Populate this table to show the local absorption rate in the various price ranges that are appropriate for your market area. Please add or delete rows as necessary to adequately reflect local conditions.
- Populate this table to show the local absorption rate in the various price ranges that are appropriate for your market area. Please add or delete rows as necessary to adequately reflect local conditions.
- Populate this table to show the local absorption rate in the various price ranges that are appropriate for your market area. Please add or delete rows as necessary to adequately reflect local conditions.
- Populate this table to show the local absorption rate in the various price ranges that are appropriate for your market area. Please add or delete rows as necessary to adequately reflect local conditions.