Guideline for interpreting correlation coefficient
•Télécharger en tant que PPTX, PDF•
5 j'aime•39,463 vues

Measure Goodness of fit

Recommandé
Contenu connexe
Tendances
Tendances (20)
En vedette
En vedette (18)
Similaire à Guideline for interpreting correlation coefficient
Similaire à Guideline for interpreting correlation coefficient (18)
Dernier
Dernier (20)
Guideline for interpreting correlation coefficient
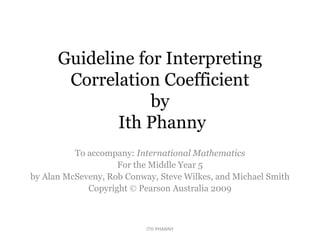
- 1. Guideline for Interpreting Correlation Coefficient by Ith Phanny To accompany: International Mathematics For the Middle Year 5 by Alan McSeveny, Rob Conway, Steve Wilkes, and Michael Smith Copyright Pearson Australia 2009 ITH PHANNY
- 2. Correlation Coefficient Interpretation Guideline The correlation coefficient (r) ranges from -1 (a perfect negative correlation) to 1 (a perfect positive correlation). In short, −1 ≤ 𝑟 ≤ 1. 0 0.2 0.4 1−1 −0.8 −0.6 −0.2−0.4 0.6 0.8 Negligible or no correlation Moderate correlation Weak correlation Strong correlation Very strong correlation Weak correlation Moderate correlation Strong correlation Very strong correlation Negative correlation Positive correlation ITH PHANNY
- 3. Correlation Coefficient Interpretation Guideline Rule of thumb: 0.0 = |r|: no correlation 0.0 < |r| < 0.2 : very weak correlation 0.2 ≤ |r| < 0.4 : weak correlation 0.4 ≤ |r| < 0.6 : moderately strong correlation 0.6 ≤ |r| ≤ 0.8 : strong correlation 0.8 ≤ |r| < 1.0 : very strong correlation 1.0 = |r| : perfect correlation ITH PHANNY
Notes de l'éditeur
- A variable: is some characteristics of a population or sample. Data: are the observed values of a variable Bivariate data: data collected that has two variables. Correlation: a connection between sets of data. This can be negative or positive, linear or non linear.
- (math, science)= (2,1); (7,6); (6,7); (5,6); (4,3); (5,7); (5,6); (3,4); (2,3); (6,5).