PSYC 355
SPSS Homework 3 Instructions - One-Way ANOVA
Part One:
Green & Salkind: Lesson 25, Exercises 1-3
Open Lesson 25 Exercise File 1 found in Blackboard Course content (under Syllabus and Assignment Instructions—Assignment Instructions—SPSS Homework 3—SPSS Homework 3 Files—Mod3_Lesson 25 Exercise File 1).
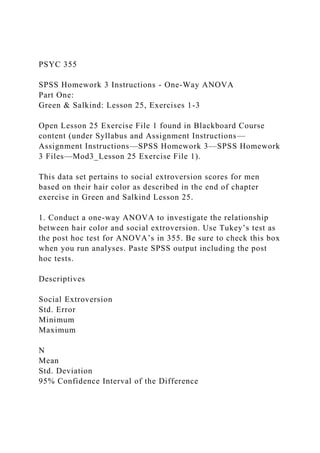
This data set pertains to social extroversion scores for men based on their hair color as described in the end of chapter exercise in Green and Salkind Lesson 25.
1. Conduct a one-way ANOVA to investigate the relationship between hair color and social extroversion. Use Tukey’s test as the post hoc test for ANOVA’s in 355. Be sure to check this box when you run analyses. Paste SPSS output including the post hoc tests.
Descriptives
Social Extroversion
Std. Error
Minimum
Maximum
N
Mean
Std. Deviation
95% Confidence Interval of the Difference
Lower
Upper
Blonde
Brunette
Redhead
Total
6
6
6
18
5.17
3.67
2.33
3.72
2.787
1.211
1.033
2.109
2.24
2.40
1.25
2.67
8.09
4.94
3.42
4.77
1.138
.494
.422
.497
2
2
1
1
10
5
4
10
ANOVA
Social Extroversions
Sum of Squares
df
Mean Square
F
Sig.
Between Groups
Within Groups
Total
24.111
51.500
75.611
2
15
17
12.056
3.433
3.511
.056
Social Extroversion
Hair Color
Turkey’s Test
Hair
Color
Mean Difference
Std. Error
Sig.
95% Confidence Interval of the Difference
Lower
Upper
Blonde
Blonde
Redheads
Brunet
Redhead
Blonde
Redhead
Blonde
Brunette
1.500
2.833
-1.500
1.333
-2.833
-1.333
1.070
1.070
1.070
1.070
1.070
1.070
.365
.045
.365
.446
.045
.446
-1.28
.05
-4.28
-1.45
-5.61
-4.11
4.28
5.61
1.28
4.11
-.05
1.45
2. Answer the following questions:
a. What is the mean extroversion score for blonds? F (2.21)=3.5
b. What is the F value for the group effect of hair color? 3.511
c. What is the p value associated with the above F value? -0.056
3. What is the effect size for the relationship between hair color and extroversion? The effect size is found in the SPSS output. Review section on effect size statistics in this lesson, and the SPSS tutorial, if needed. 0.32
4. Create a boxplot that displays the differences among the distributions for the three hair color groups. Remember to put your dependent variable in the “variable” box, and your independent, or grouping, variables in the “category axis” box.
Part Two:
1. Research Scenario: An investigator in child development research is studying whether parenting styles have an effect on second grade students’ behavior at school. She interviews 23 volunteer families from the same class and separates them into three groups of parenting styles: authoritarian (n = 8); authoritative (n = 8); and permissive (n = 7). Their teacher fills out a behavior inventory for each of the 23 children, and the investigator collects and scores them. The scores are contained in the table below. The scores can range from 0-20, and a higher score indicates more behavior problems. Conduct a one-way ANOVA to determine the effect of parenting sty ...
1. PSYC 355
SPSS Homework 3 Instructions - One-Way ANOVA
Part One:
Green & Salkind: Lesson 25, Exercises 1-3
Open Lesson 25 Exercise File 1 found in Blackboard Course
content (under Syllabus and Assignment Instructions—
Assignment Instructions—SPSS Homework 3—SPSS Homework
3 Files—Mod3_Lesson 25 Exercise File 1).
This data set pertains to social extroversion scores for men
based on their hair color as described in the end of chapter
exercise in Green and Salkind Lesson 25.
1. Conduct a one-way ANOVA to investigate the relationship
between hair color and social extroversion. Use Tukey’s test as
the post hoc test for ANOVA’s in 355. Be sure to check this box
when you run analyses. Paste SPSS output including the post
hoc tests.
Descriptives
Social Extroversion
Std. Error
Minimum
Maximum
N
Mean
Std. Deviation
95% Confidence Interval of the Difference
6. 1.45
2. Answer the following questions:
a. What is the mean extroversion score for blonds? F
(2.21)=3.5
b. What is the F value for the group effect of hair color? 3.511
c. What is the p value associated with the above F value? -0.056
3. What is the effect size for the relationship between hair color
and extroversion? The effect size is found in the SPSS output.
Review section on effect size statistics in this lesson, and the
SPSS tutorial, if needed. 0.32
4. Create a boxplot that displays the differences among the
distributions for the three hair color groups. Remember to put
your dependent variable in the “variable” box, and your
independent, or grouping, variables in the “category axis” box.
Part Two:
1. Research Scenario: An investigator in child development
research is studying whether parenting styles have an effect on
second grade students’ behavior at school. She interviews 23
volunteer families from the same class and separates them into
three groups of parenting styles: authoritarian (n = 8);
authoritative (n = 8); and permissive (n = 7). Their teacher fills
out a behavior inventory for each of the 23 children, and the
investigator collects and scores them. The scores are contained
in the table below. The scores can range from 0-20, and a
higher score indicates more behavior problems. Conduct a one-
way ANOVA to determine the effect of parenting styles on
behavior inventory scores.
The steps will be the same as the ones you have been practicing
in Part One of the assignment—the only difference is that you
are now responsible for creating the data file as well. Remember
to name and define your variables under the “Variable View,”
then return to the “Data View” to enter the data.
7. Authoritarian
8, 13, 4, 15, 5, 4, 9, 12
Authoritative
8, 5, 6, 4, 2, 5, 10, 13
Permissive
10, 8, 16, 9, 8, 3, 15
1. What is the F ratio for the parenting style effect?
2. What is the effect size for the overall effect of parenting
style on behavior inventory scores? According to general
conventions, is this effect small, medium, or large? (See Effect
Size Statistics section in Lesson 25 of Green and Salkind for
conventions.)
3. Write an APA-style Results section based on your analysis.
All homework “Results sections” should follow the example
given in the SPSS tutorials and the Course Content document
“Writing Results of Statistical Tests in APA Format.”
Remember to include a decision about the null hypothesis.
Part 3: Cumulative Homework: Choose the correct method from
tests learned in previous modules.
1. Research scenario: In a study of the relationship between
violent pornography and aggression toward women, 16 male
volunteers are selected and randomly assigned to one of two
groups. One group views a violent, sexually explicit film, and
the other group sees a nature film. A test to measure aggressive
feelings toward women is then administered to all participants.
(High scores = high aggressive feelings). Is there a significant
difference between the groups on feelings of aggression towards
women? Choose the correct test to analyze this question, set up
the SPSS file, and run the analysis. Follow the directions under
the table below.
8. Nature Film
4
5
7
9
6
4
2
3
5
Explicit Film
6
8
5
11
10
7
7
a) Paste appropriate SPSS output here.
b) Paste appropriate SPSS graph here.
c) Write an APA-style results section describing the outcome.
All homework “Results sections” should follow the example
given in the Course Content document “Writing Results of
Statistical Tests in APA Format” (note: you do not have to refer
to a figure).
Submit this assignment by 11:59 p.m. (ET) on Monday of
Module/Week 3.
Page 1 of 4