
Recommandé
Contenu connexe
En vedette
Similaire à The ZDSD Rat as a Translational Model for Obesity, Metabolic Syndrome, Diabetes and its Complications
Similaire à The ZDSD Rat as a Translational Model for Obesity, Metabolic Syndrome, Diabetes and its Complications (20)
Plus de PreClinOmics
Plus de PreClinOmics (7)
Dernier
Dernier (20)
The ZDSD Rat as a Translational Model for Obesity, Metabolic Syndrome, Diabetes and its Complications
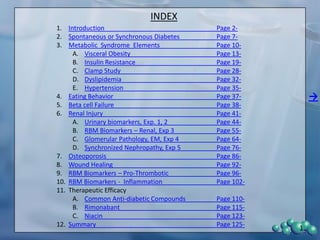
- 1. INDEX 1. Introduction Page 2- 2. Spontaneous or Synchronous Diabetes Page 7- 3. Metabolic Syndrome Elements Page 10- A. Visceral Obesity Page 13- B. Insulin Resistance Page 19- C. Clamp Study Page 28- D. Dyslipidemia Page 32- E. Hypertension Page 35- 4. Eating Behavior Page 37- → 5. Beta cell Failure Page 38- 6. Renal Injury Page 41- A. Urinary biomarkers, Exp. 1, 2 Page 44- B. RBM Biomarkers – Renal, Exp 3 Page 55- C. Glomerular Pathology, EM, Exp 4 Page 64- D. Synchronized Nephropathy, Exp 5 Page 76- 7. Osteoporosis Page 86- 8. Wound Healing Page 92- 9. RBM Biomarkers – Pro-Thrombotic Page 96- 10. RBM Biomarkers - Inflammation Page 102- 11. Therapeutic Efficacy A. Common Anti-diabetic Compounds Page 110- B. Rimonabant Page 115- C. Niacin Page 123- 12. Summary Page 125- 1
- 2. ← → The ZDSD Rat as a Translational Model for the Development of Drugs for Obesity, Metabolic Syndrome and Diabetes that Demonstrates Many of the Serious Complications of Diabetes. PreClinOmics, Inc. PDF Return to Index, For Web Use Refresh Above 2
- 3. • Most rodent models of type 2 diabetes Background have a monogenetic mutation that is responsible for the initiation of obesity and subsequent insulin resistance. • The two most common obesity- causing mutations are ← – the leptin receptor → • Zucker Fatty; ZF rat • Zucker Diabetic Fatty; ZDF rat • db/db mouse – the leptin molecule • ob/ob mouse • Both leptin and leptin receptor mutations are rare in humans. • The ZDSD rat does not have these mutations but still has obesity PDF Return to Index, For Web Use Refresh Above metabolic syndrome and diabetes. 3
- 4. Development Scheme Zucker Diabetic-Sprague Dawley Rat (ZDSD) • Produced by crossing diet induced obese (DIO) rat derived from the Crl:CD(SD) strain (exhibiting polygenetic obesity and ← insulin resistance) with homozygous lean ZDF/Crl rat (which → will express beta cell failure with the Leprfa/Leprfa genotype). • Selectively bred for obesity and diabetes. • Selected for genetically matched breeders to develop phenotypic homogeneity. • Studied male rats at different ages. PDF Return to Index, For Web Use Refresh Above 4
- 5. Characteristics of The ZDSD Rat • Unique translational model for obesity, metabolic syndrome/type II diabetes - 35 generations inbred • Polygenic obesity and phenotype can be modulated by diet. • Phenotype is expressed in the presence of a functional leptin ← pathway. → • Insulin resistance development starts at an early age. • Early onset of hyperglycemia and slower progression to frank diabetes when compared to the ZDF rat. – Slower deterioration of beta cell function. • Manifests diabetic complications: Diabetic nephropathy Hypertension Cardiovascular markers Inflammation Osteoporosis Delayed Wound Healing • In production PDF Return to Index, For Web Use Refresh Above 5
- 6. The ZDSD Rat: One rodent – Many Models ZDSD Obesity Metabolic Syndrome Diabetes Obesity Model before Metabolic Syndrome Diabetes Model diabetes develops, ← → 5-16 weeks of age Natural/Spontaneous Diet Synchronized Insulin Development (LabDiet 5008) (RD D12468 or Purina Test Resistance Slower & more random Diet 5SCA) Diabetic Diabetic Hyperlipidemia Nephropathy Nephropathy Obesity Osteoporosis Osteoporosis Cardiovascular/ Cardiovascular/ Inflammatory Inflammatory Hypertension Biomarkers Biomarkers PDF Return to Index, For Delayed Wound Delayed Wound Delayed Wound Healing Healing Web Use Refresh Above Healing 6
- 7. Spontaneous 700 development of 600 diabetes 500 Body weight (g) 400 The ZDSD Rat when 300 maintained on Lab Diet 5008 200 chow will spontaneously ← develop diabetes as it ages 100 → 4 5 6 7 8 9 10 11 12 13 14 15 16 17 18 19 20 21 22 23 24 25 26 beyond 16 wks. As fed serum Age (weeks) glucose levels begin to 450 increase above ~350 mg/dl, 400 body weight begins to Serum glucose (mg/dL) 350 decrease. 300 250 200 150 100 10 11 12 13 14 15 16 17 18 19 20 21 22 23 24 25 26 Age (weeks) PDF Return to Index, For Web Use Refresh Above 7
- 8. Synchronization 600 of diabetic onset Glucose (mg/dl) 400 SD Male Rats The ZDSD Rat can be placed ZDSD Males on either D12468 (Research 200 ZDSD Females Diets) or 5SCA (LabDiet) to synchronize the onset of 0 diabetes. ← 10 11 12 13 14 15 16 17 18 19 20 21 22 23 24 25 Age (wks) → When the ZDSD rat was 600 placed on either diet at 17 wks of age, the plasma 400 Weight (g) glucose levels of the animals averaged over 450 mg/dl 200 SD Male Rats ZDSD Males within 1 week. Following a ZDSD Females return to LabDiet 5008 at 19 0 wks of age, the animals 10 11 12 13 14 15 16 17 18 19 20 21 22 23 24 25 Age (wks) maintained the diabetic state. PCO now recommends a 3 Area shaded in grey indicates week synchronization time frame of diabetogenic diet PDF Return to Index, For Web Use Refresh Above protocol 8
- 9. Synchronization of diabetic onset % Body Fat by QNMR Body composition 30 changes in response 25 ← to diabetogenic diet 20 SD Male Rats → % Body Fat ZDSD Males (5SCA or D12468). 15 ZDSD Females 10 5 0 10 11 12 13 14 15 16 17 18 19 20 21 22 23 24 25 Age (wks) Area shaded in grey indicates time frame of diabetogenic diet PDF Return to Index, For Web Use Refresh Above 9
- 10. ZDSD as a preclinical model of Metabolic Syndrome Metabolic syndrome affects a large proportion of the population and is becoming increasingly important in adolescents. The syndrome has many components including central obesity, insulin resistance, dyslipidemia and hypertension. In addition, the syndrome features a chronic low grade inflammatory state, vascular endothelial dysfunction, and a prothrombotic environment. Long standing ← → metabolic syndrome can thus pre-dispose to atherosclerosis, microvasculature disease (retina), stroke, renal injury and diabetes. Due to the complicated mechanisms involved in the syndrome and its sequelae, current standard of care reflects poly-pharmacy and is aimed at controlling atherogenic dyslipidemia, hyperglycemia and hypertension as well as intervening in secondary diseases such as renal dysfunction, stroke, and micro-vascular disease related to retinopathy. Development of new chemical entities with the potential to control more than one risk factor is hampered by currently available animal models. To that end, the ZDSD rat was designed to spontaneously develop a phenotype that mimics many aspects of the human metabolic syndrome, including hypertension and the progression to frank diabetes with long-standing disease. PDF Return to Index, For Web Use Refresh Above 10
- 11. Metabolic Syndrome • Metabolic syndrome is most frequently defined by a presence of certain traits, ← → including: – abdominal obesity – insulin resistance – Dyslipidemia – elevated blood pressure and – pro-thrombotic and pro-inflammatory states PDF Return to Index, For Web Use Refresh Above 11
- 12. Characteristics of Metabolic Syndrome Seen in the ZDSD Rat • Increased body weight with increased abdominal fat ← → • Insulin resistance / Glucose intolerance • Hyper-lipidemia • Increased blood pressure / Hypertension • Increased Serum BioMarkers of Coagulation inflamation and Vascular Disease • Increased fed and fasting glucose and PDF Return to Index, For HbA1c levels Web Use Refresh Above 12
- 13. Visceral Obesity A prominent component of metabolic syndrome is insulin resistance which is thought to be mediated by an increase in metabolically active visceral fat. Visceral fat accumulation occurs in human patients in the presence of a functional leptin ← pathway as leptin deficiencies and receptor defects are rarely reported. According → to published growth charts for male leptin resistant ZDF rats, the new ZDSD rats are heavier when fed a normal diet (PMI 5008) and exhibit a body composition (increased % fat) comparable to age matched DIO-LE model which is a mainstay for anti-obesity research. In addition, the ZDSD responds to a common reference anti- obesity agent (rimonabant) with significant loss of body fat. Interestingly, ZDSD rats are not typically nocturnal in that they exhibit significant feed intake during the daylight hours. Exogenously administered leptin results in an acute anorexic effect quite similar to normal SD rats and indicates the presence of a functioning leptin pathway PDF Return to Index, For Web Use Refresh Above 13
- 14. Comparative Growth Curves in SD and ZDSD Rat Fed 5008 chow ZDSD rats were significantly ← (15%) heavier than their SD → counterparts at 8 weeks of age. In addition, the rate of body weight gain was increased in ZDSD animals as evidenced by an 82% vs 62% weight gain in SD animals during the 24 weeks. PDF Return to Index, For Web Use Refresh Above All time points statistically different 14 Study # 09-550-170
- 15. Spontaneous Development of Obesity in ZDSD Rats Fed 5008 Chow Body composition was assessed using QNMR . The percentage of body weight ← identified as fat was 50 % → higher in ZDSD compared to SD controls as early as 8 weeks of age. Body fat percentage continued to increase throughout the study and remained significantly higher than control rats at each time- point. PDF Return to Index, For Web Use Refresh Above All time points statistically different 15 Study # 09-550-170
- 16. Visceral Obesity in the ZDSD Rat CT Scan Sub-cutaneous fat ← → Retroperitoneal fat Visceral fat PDF Return to Index, For Web Use Refresh Above 16
- 17. Terminal Body Weight Comparison ZDF CRL-SD, CD 700 +/fa ZDSD, Diabetic 7-11 weeks ZDSD, Diabetic 12-21 weeks 600 ← → 500 Weight (g) 400 300 200 100 PDF Return to Index, For Terminal animal weights in diabetic and control animals. Web Use Refresh Above 17
- 18. Terminal Comparison Liver Weight Food & Water Consumption 30 ZDF 350 CRL-SD, CD +/fa ZDSD, Diabetic 7-11 weeks ZDF 25 300 ZDSD, Diabetic 12-21 weeks CRL-SD, CD +/fa ← 250 ZDSD, Diabetic 7-11 weeks → Amount/rat (gram) ZDSD, Diabetic 12-21 weeks 20 Weight (gram) 200 15 150 10 100 5 50 0 0 Terminal liver weights, water intake and food consumption are highest in the diabetic groups. PDF Return to Index, For Web Use Refresh Above 18
- 19. Development of Insulin Resistance in the ZDSD Rat on 5008 Purina chow • Rats tested started at 8 weeks of age (SD & ZDSD) • Weight, glucose and insulin measured weekly ← • Animals fasted every two weeks for OGTT → • Data analyzed – Weight – Body composition – Glucose levels – OGTT glucose and insulin – Glucose disposal – HOMA-IR PDF Return to Index, For Web Use Refresh Above 19
- 20. Comparative Growth Curves in SD and ZDSD Rat Fed 5008 chow ZDSD rats were significantly ← (15%) heavier than their SD → counterparts at 8 weeks of age. In addition, the rate of body weight gain was increased in ZDSD animals as evidenced by an 82% vs 62% weight gain in SD animals during the 24 weeks. PDF Return to Index, For Web Use Refresh Above All time points statistically different 20 Study # 09-550-170
- 21. Spontaneous Development of Obesity in ZDSD Rats Fed 5008 Chow Body composition was assessed using QNMR . The percentage of body weight ← identified as fat was 50 % → higher in ZDSD compared to SD controls as early as 8 weeks of age. Body fat percentage continued to increase throughout the study and remained significantly higher than control rats at each time- point. PDF Return to Index, For Web Use Refresh Above All time points statistically different 21 Study # 09-550-170
- 22. Spontaneous Development of Hyperglycemia in ZDSD Rats Fed 5008 Chow ← → PDF Return to Index, For Web Use Refresh Above All time points statistically different 22 Study # 09-550-170
- 23. Spontaneous Development of Glucose Intolerance Shown by OGTT in ZDSD Rats Fed 5008 Chow ← → PDF Return to Index, For Web Use Refresh Above 23
- 24. Spontaneous Development of Insulin Resistance Shown by OGTT in ZDSD Rats Fed 5008 Chow ← → PDF Return to Index, For Web Use Refresh Above 24
- 25. Spontaneous Development of Impairment in Glucose Disposal in ZDSD Rats as Demonstrated by OGTT, AUC Impairment in glucose disposal as represented by the area under the ← glucose curve during an → oral glucose tolerance test developed spontaneously in ZDSD rats and was evident as early as 8 weeks of age (fed Purina 5008 chow). PDF Return to Index, For Web Use Refresh Above All time points statistically different 25 Study # 09-550-170
- 26. Progressive Development of Insulin Resistance (HOMA-IR) in ZDSD Rats ZDSD rats become increasingly more insulin ← resistant with age as → evidenced by the calculated HOMA-IR. The insulin resistance is evident compared to SD rats as early as 8 weeks of age (fed Purina 5008 chow). PDF Return to Index, For Web Use Refresh Above All time points statistically different 26
- 27. Glucose and Glycated Hemoglobin Levels in CD and Prediabetic ZDSD Rats Glucose in CD vs ZDSD Glycated Hb in CD vs ZDSD 16 weeks of age 16 weeks of age 150 4.0 CD CD Blood Glucose mg/dL ← 140 ZDSD 3.8 ZDSD → Glycated Hb 130 3.6 120 3.4 110 3.2 100 3.0 D SD D SD C C ZD ZD PDF Return to Index, For Web Use Refresh Above 27
- 28. Pre-diabetic Insulin Design Sensitivity, – Rosiglitazone treatment: 3 mg/kg hyperinsulinemic- PO, QD for 2 weeks euglycemic glucose – Comparison of insulin sensitivity clamp at 9 wks of age in • The ZDSD Rat, ← → • Zucker Fatty (ZF), and • Sprague Dawley (SD) rats – Assessed by exogenous glucose infusion rate (GIR) during hyperinsulinemic (25 mU/kg/min)-euglycemic glucose clamp PDF Return to Index, For Web Use Refresh Above 28
- 29. Body Weight and Basal Glucose of Rats Before Undergoing Glucose Clamp Basal Blood Glucose (mg/dl) 500 200 Vehicle (n=6-8) Rosiglitazone (3 mg/kg PO, n=6-8) 400 # 160 Body Weight (g) 300 120 ← → 200 80 100 40 0 0 SD (age) SD (wt) ZDSD ZF SD (age) SD (wt) ZDSD ZF Rat Strain (SD rats are age or weight matched) Rat Strain (SD rats are age or weight matched) * P<0.05 compared to SD rat (age matched) group # P<0.05 compared to vehicle treated group PDF Return to Index, For Web Use Refresh Above 29
- 30. ZDSD and ZF Rats are Insulin Resistant which Improved with Rosiglitazone Treatment 60 Vehicle (n=6-8) Rosiglitazone (3 mg/kg PO, n=6-8) Glucose Infusion Rate 50 (mg/kg/min) # ← 40 # → 30 20 10 0 SD (age) SD (wt) ZDSD ZF Rat Strain (SD rats are age or weight matched) * P<0.05 compared to SD rat (age matched) group PDF Return to Index, For Web Use Refresh Above # P<0.05 compared to vehicle treated group 30
- 31. ZDSD Rats Have Modest Visceral and Whole Body Obesity Unlike ZF Rats 12 # 40 # Vehicle (n=6-8) Epididymal Fat Pad (g) Rosiglitazone (3 mg/kg PO, n=6-8) Vehicle (n=6-8) 10 30 Body Fat (%) 8 ← 6 20 → 4 10 2 0 0 SD (age) SD (wt) ZDSD ZF SD (age) SD (wt) ZDSD ZF Rat Strain (SD rats are age or weight matched) Rat Strain (SD rats are age or weight matched) * P<0.05 compared to SD rat (age matched) group # P<0.05 compared to vehicle treated group PDF Return to Index, For Web Use Refresh Above 31
- 32. Dyslipidemia Patients with Type II diabetes and metabolic syndrome often present with dyslipidemia including elevated cholesterol and triglycerides and decreased HDL- ← C. These lipids have been shown to impact cardiovascular and renal co- → morbidities. Hypertriglyceridemia expresses as early as 12 weeks of age in ZDSD rats when maintained on a normal diet and levels progress up to 500 mg/dL by 15 weeks. Similar to the fructose fed rat, a model commonly used for the study of dyslipidemia, the spontaneous nature of the ZDSD lipid abnormality may provide a relevant model for the examination of compounds affecting the up-regulated lipogenic pathway seen in metabolic syndrome. The dyslipidemia in this model responds to classic reference agents including rosiglitazone. Increases in cholesterol are not as dramatic and may be induced by feeding a high fat diet PDF Return to Index, For Web Use Refresh Above 32
- 33. Terminal Comparison of Models 1300 1200 1100 1000 ZDF CRL-SD, CD 700 +/fa 900 ZDSD, Diabetic 7-11 weeks (mg/dL) ZDSD, Diabetic 12-21 weeks 800 600 ← 700 → Analytes 500 600 Weight (g) 500 400 400 300 300 200 100 200 0 100 TG e L s O co H C lu G Glucose, triglyceride and cholesterol levels. Glucose, triglyceride and cholesterol PDF Return to Index, For levels are elevated in all of the diabetic groups (ZDF and ZDSD). The model and Web Use Refresh Above duration of diabetes did not have a significant effect on these measurements. 33
- 34. Dyslipidemia in ZDSD Treatment ofEffect of 7 Days of Niacin Treatment with Niacin Weight Glucose Vehicle 250 Vehicle 600 Niacin Niacin 200 Glucose (mg/dL) Weight (grams) 400 150 100 * 200 50 ← 0 0 → Fed Fasted Fed Fasted Fed Fasted Fed Fasted Before Treatment After Treatment Before Treatment After Treatment Triglyceride Free Fatty Acids 600 Vehicle 1.5 Vehicle Niacin Niacin Triglyceride (mg/dL) FFA (mEq/L) 400 1.0 * 200 0.5 * * * 0 0.0 Fed Fasted Fed Fasted Fed Fasted Fed Fasted Before Treatment After Treatment Before Treatment After Treatment PDF Return to Index, For Web Use Refresh Above 7 days of treatment 34
- 35. Hypertension ← → High blood pressure is a key symptom of metabolic syndrome and is a major contributor to the increased risk of cardiovascular disease, kidney disease and ischemic stroke seen in these patients. Examination of the interactions of all the components of the syndrome in rats is complicated by the absence of high blood pressure in current models (i.e., Zucker fatty rat). Indirect evidence of probable elevated pressure in the form of elevated biomarkers for an activated RAAS ,endothelial dysfunction and aberrant vasoconstriction is noted in ZDSD rats. Direct evidence of Hypertension has been confirmed in the pre-diabetic state via the tail-cuff method. PDF Return to Index, For Web Use Refresh Above 35
- 36. Blood pressure in ZDSD vs CD Rats 8-16 weeks of age 160 ZDSD CD 140 Systolic BP ← → 120 100 80 60 70 80 90 100 Age in Days Blood pressure data produced in collaboration with Dr. Subah Packer’s Laboratory, IU School of Medicine PDF Return to Index, For Web Use Refresh Above 36
- 37. 30 ANOVA/pooled t Leptin Physiology dark cycle (p<0.05) compared light cycle to SD animals 25 daily total Food intake (g/period) Food intake of ZDSD Rats is 20 more evenly divided between 15 day and night 10 ← 5 → 0 SD ZDSD 10 ANOVA/pooled t (p<0.05) compared Food Intake of ZDSD Rats is 9 to corresponding saline control Food intake 4 hrs after treatment 8 Reduced in Response to 7 Leptin Indicating a 6 Functioning Leptin Pathway. 5 Leptin was given just before 4 3 the start of the dark cycle and 2 food intake was measured for 1 the first 4 dark hours. 0 SD-saline SD-leptin ZDSD-saline ZDSD-leptin PDF Return to Index, For Assessment of leptin pathway function as determined by Web Use Refresh Above feeding response to leptin injection (1 mg/kg, IP) 37
- 38. Insulin Levels Decline as Diabetes Progresses Glucose Insulin 8 600 7 11-13 WEEKS ← 500 6 15 WEEKS 17 WEEKS → Insulin (ng/ml) 5 Glucose (mg/dl) 400 4 300 11-17 WEEKS 3 200 2 100 1 0 0 5 7 9 11 13 15 17 19 21 23 25 27 29 5 7 9 11 13 15 17 19 21 23 25 27 29 Age (wks) Age (wks) Insulin levels of the group that become diabetic between 11-17 weeks of age. The animals that become diabetic earlier have higher insulin levels than those who become diabetic later. PDF Return to Index, For Web Use Refresh Above 38
- 39. Average Glucose Pancreatic Insulin Content % Diabetic 500 The glucose levels for ZDSD rats 400 Glucose (mg/dL) were followed from 16 to 28 300 weeks of age (upper figure). At 200 28 weeks of age approximately 100 3.6% 13.1% 18.0% 32.8% 52.5% 62.3% 70.5% 75.8% 75% of the animals were overtly ← diabetic. The average glucose 0 15 20 25 30 → levels for each animal (16 to 28 Age (weeks) weeks) were correlated with Correlation Between insulin content of the pancreas Pancreatic Insulin and when the animals were Blood Glucose Level terminated at about 28 weeks of 600 age (lower figure). Higher Glucose (mg/dL) 400 average glucose levels were associated with lower insulin 200 content in the pancreas. 0 PDF Return to Index, For Web Use Refresh Above 0 200 400 600 800 Insulin ng/g 39
- 40. Representative Islets from ZDSD Rats Pre-diabetic Diabetic ← → PDF Return to Index, For Web Use Refresh Above 40
- 41. Renal Injury Obesity and metabolic syndrome are clear predictors ← of chronic kidney disease largely due to the → potentiation of chronic inflammation by insulin resistance. In addition, the lipoprotein abnormalities, increased hemodynamics, hypercoagulability and vascular dysfunction associated with metabolic syndrome have all been implicated as causative for renal disease. Biomarkers for renal dysfunction (i.e., IL6, TNF-α,NGAL,KIM-1, VEGF etc.) as well as significant albuminuria , elevated free fatty acids with oxidative stress, and histological analysis have shown the ZDSD rat to exhibit nephropathy that closely mimics that observed in obese insulin resistant patients. PDF Return to Index, For Web Use Refresh Above 41
- 42. Diabetic Nephropathy in the ZDSD Rat • Increased kidney weight • Increased urinary markers for kidney disease ← → • Increased serum markers for kidney disease • Glomerular sclerosis • Nodular sclerosis, KW nodules • Thickening basement membrane of glomerular capillaries • Podocyte effacement on capillaries PDF Return to Index, For Web Use Refresh Above 42
- 43. Terminal Comparison Kidney Weight Urine Analysis 300 7 ZDF CRL-SD, CD +/fa 250 6 ZDSD, Diabetic 7-11 weeks ZDF ZDSD, Diabetic 12-21 weeks CRL-SD, CD +/fa 5 200 ZDSD, Diabetic 7-11 weeks ZDSD, Diabetic 12-21 weeks ← → Weight (gram) 4 150 3 100 2 50 1 0 0 Terminal kidney weights are highest in the ZDSD Rat groups. These increased kidney weights and high urinary volume along with increased micro-albumin concentration and the total amount of micro- albumin indicate that there may be significant diabetic nephropathy in the ZDSD Rat model. PDF Return to Index, For Web Use Refresh Above 43
- 44. Experiment 1 ← ZDSD Diabetic Nephropathy → Spontaneous Diabetes ELISA Analysis of Markers PDF Return to Index, For Web Use Refresh Above 44
- 45. WEIGHT GLUCOSE 600 600 SD SD ZDSD ZDSD Weight (grams) Glucose (mg/dL) 500 400 400 200 ← 300 10 12 14 16 18 20 22 24 26 28 30 0 10 12 14 16 18 20 22 24 26 28 30 → Age (weeks) Age (weeks) Urine volume 200 Urinary volume (mls/24hr) SD ZDSD 150 100 50 0 10 20 22 24 26 30 Age (weeks) PDF Return to Index, For Web Use Refresh Above 45
- 46. Urinary albumin beta-2 microglobulin Urinary -2 microglobulin (g/day) 150 2000 Urinary albumin (mg/day) SD SD 125 ZDSD ZDSD 1500 100 75 1000 50 500 25 ← 0 10 20 22 24 26 30 0 10 20 22 24 26 30 → Age (weeks) Age (weeks) Cystatin C KIM-1 30 15.0 Urinary cystatin C ( g/day) SD SD Urinary KIM-1 (ng/day) ZDSD 12.5 ZDSD 20 10.0 7.5 10 5.0 2.5 0 0.0 10 20 22 24 26 30 10 20 22 24 26 30 Age (weeks) Age (weeks) PDF Return to Index, For Web Use Refresh Above 46
- 47. Experiment 2 Urine BioMarkers of Renal Disease Study Details ← • Male ZDSD Rats were allowed to become diabetic → spontaineously on Purina 5008 and aged to 33 weeks. Two groups of animals were selected for further study: animals that were diabetic for longer than 16 weeks and animals that were diabetic for less than 8 weeks. • Mesoscale (MSD) urine panels were run on urine (Argutus AKI test, Kidney Injury Panel 1 and Rat Clusterin) • Pathological evaluation of the kidneys was done. PDF Return to Index, For Web Use Refresh Above 47
- 48. Data From Urinary Excretion Study ← → PDF Return to Index, For Web Use Refresh Above 48
- 49. Urinary Excretion of Kidney Markers ← → PDF Return to Index, For Web Use Refresh Above 49
- 50. Urinary Excretion of Kidney Markers ← → PDF Return to Index, For Web Use Refresh Above 50
- 51. Pathological Evaluation of Kidney • Glomerulopathy: Changes in the renal glomeruli consisted of one or more of the following: increased cellularity in the mesangium; increased in mesangial connective tissue; thickening of Bowman’s capsule; hypertrophy of capsular epithelium; dilation of the capsular space. Individual glomeruli appeared moderately enlarged. The lesions were highly variable within individual glomeruli and between glomeruli within a kidney. The changes were most usually segmental, although a rare glomeruli was fibrotic (condensed). Expanded mesangial material stained positively with the PAS stain and to a lesser extent with the Trichrome stain. ← • Tubular dilation/degeneration: This change was mainly in the cortex and consisted of irregularly dilated, → empty tubules, that sometimes were lined by cuboidal epithelium that stained basophilic compared to the expected normal eosinophilic tubular epithelium. In some individual tubules the epithelium were flattened. These dilated/degenerate tubules were randomly scattered throughout the cortex, and sometimes were associated with protein casts and/or non-suppurative inflammation (see below). Focal mild increases in fibrous connective tissue within the interstitial space was present, frequently in association with the interstitial inflammatory response, but not restrictively so. • Protein casts: Individual tubules contained acellular, uniformly staining eosinophilic material consistent with protein. These protein casts were present in the cortex and in the medulla, as well as at the cortico- medullary junction in various sections. Often, several such dilated tubules containing protein casts were clustered together, usually in the cortex. • Inflammation: The inflammatory process consisted of focal collections of lymphocytes and macrophages, which were seen in the cortical interstitial space, adjacent to individual glomeruli PDF Return to Index, For Web Use Refresh Above and individual blood vessels, and in association with the renal pelvic epithelium. 51
- 52. ← → PDF Return to Index, For Web Use Refresh Above 52
- 53. ← → PDF Return to Index, For Web Use Refresh Above 53
- 54. Kidney Histopathology of the ZDSD Rat 4.0 A Novel Animal Model of Diabetes non-diabetic compared to Non-diabetic animals (t-test) diabetic 3.5 Histopathology Score (0-5) 3.0 ← 2.5 → 2.0 1.5 1.0 0.5 0.0 Glomerulopathy Tubular dilation Protein casts Inflammation PDF Return to Index, For Web Use Refresh Above /degeneration 54
- 55. Experiment 3 ← → Serum BioMarkers of Renal Disease RBM Collaboration PDF Return to Index, For Web Use Refresh Above 55 Rules Based Medicine
- 56. Renal Injury Obesity and metabolic syndrome are clear predictors of chronic kidney disease largely due to the potentiation of chronic inflammation by insulin resistance. In addition, the ← → lipoprotein abnormalities, increased hemodynamics, hypercoagulability and vascular dysfunction associated with metabolic syndrome have all been implicated as causative for renal disease. Biomarkers for renal dysfunction (i.e., IL6, TNF-α, NGAL, KIM-1, VEGF etc.) as well as significant albuminuria , elevated free fatty acids with oxidative stress, and histological analysis have shown the ZDSD rat to exhibit nephropathy that closely mimics that observed in obese insulin resistant patients. PDF Return to Index, For Web Use Refresh Above 56
- 57. Experimental details • Male ZDSD rats were placed on a high-fat diet (RD12468) between 17 and 19 weeks of age. 15 out ← of 21 animals in this experiment developed diabetes → during this period (this is usually 90%+). • Rules Based Medicine panels (Rat Metabolic MAP, Rat Kidney MAP and RodentMAP™) were run on serum samples that were collected: – before diabetes developed (14 weeks) – while diabetic on the high fat diet (18 weeks) and – one week after they were taken off the high fat diet PDF Return to Index, For (20 weeks). Web Use Refresh Above 57
- 58. Serum BioMarkers of Renal Disease Neutrophil Gelatinous Associated Protein •also called lipocalin2 compared to SD •levels up-regulated during 1400 Sprague-Dawley (5) inflammation ZDSD (6) Diabetic ZDSD (15) •protective protein can trigger 1200 nephrogenesis Serum NGAL (ng/ml) ← •associated with obesity, insulin 1000 → resistance and hyperglycemia 800 600 400 200 14 18 20 Age (weeks) 14 weeks = non-diabetic 18 weeks = on diabetogenic diet one week 20 weeks = off diabetogenic diet one week PDF Return to Index, For Web Use Refresh Above 58
- 59. Serum BioMarkers of Renal Disease Beta-2-microglobulin 80 •a protein present in all nucleated cells Sprague-Dawley (5) which is normally reabsorbed in renal ZDSD (6) Serum beta-2-microglobulin (ug/ml) tubules 75 Diabetic ZDSD (15) •increased circulating levels indicate glomerular membrane disease and 70 ← inflammation → 65 # 60 55 compared to SD # Diabetic vs. non-diabetic 50 14 18 20 Age (weeks) 14 weeks = non-diabetic 18 weeks = on diabetogenic diet one week 20 weeks = off diabetogenic diet one week PDF Return to Index, For Web Use Refresh Above 59
- 60. Serum BioMarkers of Renal Disease Kidney-injury molecule-1 0.30 •a membrane protein, not normally compared to SD Sprague-Dawley (5) # diabetic vs. non-diabetic present but appears in urine in ZDSD (6) 0.25 Diabetic ZDSD (15) response to acute kidney tubular injury Serum Kim-1 (ng/ml) 0.20 •highly sensitive predictor of renal # ← injury when elevated in urine 0.15 → 0.10 0.05 0.00 14 18 20 Age (weeks) 14 weeks = non-diabetic 18 weeks = on diabetogenic diet one week 20 weeks = off diabetogenic diet one week PDF Return to Index, For Web Use Refresh Above 60
- 61. Serum BioMarkers of Renal Disease Glutathione-S-transferase-alpha 60 compared to SD •enzyme that reduces toxin levels by Sprague-Dawley (5) ZDSD (6) # Diabetic vs. non-diabetic 50 conjugation with glutathione Diabetic ZDSD (15) Serum GST-alpha (ng/ml) •localized in proximal convoluted 40 tubules, medullary tubules and loop of Henle 30 ← •in diabetes, hyperglycemia triggers → oxidative stress which increases the 20 # renal excretion of this enzyme and therefore removes this protective 10 function and increases blood levels. 0 •Biomarker for tubular kidney disease 14 18 20 Age (weeks) 14 weeks = non-diabetic 18 weeks = on diabetogenic diet one week 20 weeks = off diabetogenic diet one week PDF Return to Index, For Web Use Refresh Above 61
- 62. Serum BioMarkers of Renal Disease Clusterin 500 •(apolipoprotein J) is a protein highly Sprague-Dawley (5) comapred to SD correlated with apoptosis and the ZDSD (6) # Diabetic vs. non-diabetic clearance of cellular debri Diabetic ZDSD (15) 400 •It is elevated in glomeruli and tubules Serum Clusterin (g/ml) of diabetic kidneys ← 300 → 200 # 100 14 18 20 Age (weeks) 14 weeks = non-diabetic 18 weeks = on diabetogenic diet one week 20 weeks = off diabetogenic diet one week PDF Return to Index, For Web Use Refresh Above 62
- 63. Serum BioMarkers of Renal Disease von Willebrand factor 300 compared to SD •required for platelet adhesion, makes Serum von Willebrand Factor (ng/ml) # Diabetic vs. non-diabetic platelets "sticky“ 250 # •vWF binds inactive Factor VIII, # protecting it from degradation 200 •defiency leads to bleeding disorders •increased levels predispose to stroke ← •increases precede microalbuminuria 150 → in diabetic nephropathy 100 Sprague-Dawley (5) 50 ZDSD (6) Diabetic ZDSD (15) 0 14 18 20 Age (weeks) 14 weeks = non-diabetic 18 weeks = on diabetogenic diet one week 20 weeks = off diabetogenic diet one week PDF Return to Index, For Web Use Refresh Above 63
- 64. Experiment 4 ← → Diabetic Nephropathy, EM of Glomerular Pathology PDF Return to Index, For Web Use Refresh Above 64
- 65. Experimental details • Male ZDSD rats allowed to become spontaneously diabetic. ← • Animals were terminated by perfusion at about 35 → weeks of age. We evaluated the following groups: – Control CD rats – ZDSD rats that had been diabetic from 12-13 weeks – ZDSD rats that had been diabetic from 16-17 weeks • Took pictures of glomerular capillaries and BM – Measured GBM thickness – Evaluated podocyte morphology PDF Return to Index, For Web Use Refresh Above 65
- 66. Glomerular Capillary Control, Age Matched Diabetic, 12 Weeks ← → 66 PDF Return to Index, For Web Use Refresh Above 66
- 67. Glomerular Capillary, Basement Membrane Control, Age Matched Diabetic, 12 Weeks ← → PDF Return to Index, For Web Use Refresh Above 67
- 68. Glomerular Capillary, Basement Membrane Control, Age Matched Diabetic, 12 Weeks ← → PDF Return to Index, For Web Use Refresh Above 68
- 69. Glomerular Capillary Control, Age Matched Diabetic, 16.5 Weeks ← → 69 PDF Return to Index, For Web Use Refresh Above 69
- 70. Glomerular Capillary, Basement Membrane Control, Age Matched Diabetic, 16.5 Weeks ← → PDF Return to Index, For Web Use Refresh Above 70
- 71. Glomerular Basement Membrane Thickness 500 Thickness in nm 400 ← → 300 200 100 0 ks ks ol tr ee ee on W W C 12 .5 D 16 C Time of diabetes in the ZDSD Rat 09-550-187 PDF Return to Index, For Web Use Refresh Above 71
- 72. Scanning Microscopy Glomerular Capillaries Control Diabetic ← → PDF Return to Index, For Web Use Refresh Above 72
- 73. Scanning Microscopy Control Glomerular Capillary with Normal Podocyte Foot Processes ← → PDF Return to Index, For Web Use Refresh Above 73
- 74. Scanning Microscopy Diabetic Glomerular Capillaries Demonstrating Effacement ← → PDF Return to Index, For Web Use Refresh Above 74