
Recommandé
Recommandé
Contenu connexe
Similaire à 413TeChnology as a vaRiable anD Responsive oRg ani.docx
Similaire à 413TeChnology as a vaRiable anD Responsive oRg ani.docx (20)
Plus de priestmanmable
Plus de priestmanmable (20)
Dernier
Dernier (20)
413TeChnology as a vaRiable anD Responsive oRg ani.docx
- 1. 41 3 TeChnology as a vaRiable anD Responsive oRg aniz aTional Dynamism Introduction This chapter focuses on defining the components of technology and how they affect corporate organizations. In other words, if we step back momentarily from the specific challenges that information tech- nology (IT) poses, we might ask the following: What are the generic aspects of technology that have made it an integral part of strategic and competitive advantage for many organizations? How do organizations respond to these generic aspects as catalysts of change? Furthermore, how do we objectively view the role of technology in this context, and how should organizations adjust to its short- and long-term impacts? Technological Dynamism To begin, technology can be regarded as a variable, independent
- 2. of others, that contributes to the life of a business operation. It is capable of producing an overall, totalizing, yet distinctive, effect on organizations— it has the unique capacity to create accelerations of corporate events in an unpredictable way. Technology, in its aspect of unpredictability, is necessarily a variable, and in its capacity as accel- erator— its tendency to produce change or advance— it is dynamic. My contention is that, as a dynamic kind of variable, technology, via responsive handling or management, can be tapped to play a special role in organizational development. It can be pressed into service as the dynamic catalyst that helps bring organizations to maturity in dealing not only with new technological quandaries, but also with other agents of change. Change generates new knowledge, which in turn requires a structure of learning that should, if managed properly, 4 2 INFORMATION TECHNOLO GY result in transformative behavior, supporting the continued evolution of organizational culture. Specifically, technology speeds up events, such as the expectation of getting a response to an e-mail, and
- 3. requires organizations to respond to them in ever-quickening time frames. Such events are not as predictable as those experienced by individuals in organizations prior to the advent of new technologies— particu- larly with the meteoric advance of the Internet. In viewing technology then as a dynamic variable, and one that requires systemic and cul- tural organizational change, we may regard it as an inherent, internal driving force— a form of technological dynamism. Dynamism is defined as a process or mechanism responsible for the development or motion of a system. Technological dynamism charac- terizes the unpredictable and accelerated ways in which technology, specifically, can change strategic planning and organizational behav- ior/culture. This change is based on the acceleration of events and interactions within organizations, which in turn create the need to better empower individuals and departments. Another way of under- standing technological dynamism is to think of it as an internal drive recognized by the symptoms it produces. The new events and interac- tions brought about by technology are symptoms of the dynamism that technology manifests. The next section discusses how
- 4. organiza- tions can begin to make this inherent dynamism work in their favor on different levels. Responsive Organizational Dynamism The technological dynamism at work in organizations has the power to disrupt any antecedent sense of comfortable equilibrium or an unwelcome sense of stasis. It also upsets the balance among the vari- ous factors and relationships that pertain to the question of how we might integrate new technologies into the business— a question of what we will call strategic integration— and how we assimilate the cul- tural changes they bring about organizationally— a question of what we call cultural assimilation. Managing the dynamism, therefore, is a way of managing the effects of technology. I propose that these orga- nizational ripples, these precipitous events and interactions, can be addressed in specific ways at the organizational management level. The set of integrative responses to the challenges raised by technology 4 3teChnolo GY As A vArIAble And resp onsIve is what I am calling responsive organizational dynamism,
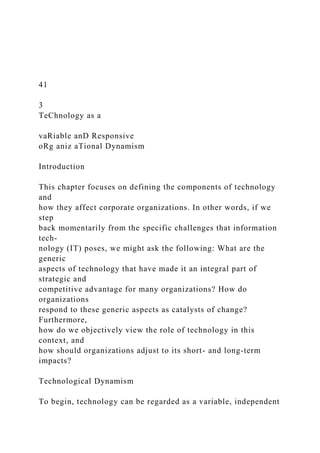
- 5. which will also receive further explication in the next few chapters. For now, we need to elaborate the two distinct categories that present themselves in response to technological dynamism: strategic integration and cul- tural assimilation. Figure 3.1 diagrams the relationships. Strategic Integration Strategic integration is a process that addresses the business- strategic impact of technology on organizational processes. That is, the business-strategic impact of technology requires immediate orga- nizational responses and in some instances zero latency. Strategic integration recognizes the need to scale resources across traditional business– geographic boundaries, to redefine the value chain in the life cycle of a product or service line, and generally to foster more agile business processes (Murphy, 2002). Strategic integration, then, Technology as an independent variable Creates Organizational dynamism
- 6. Acceleration of events that require different infrastructures and organizational processes Requires Strategic integration Cultural assimilation Symptoms and implications Figure 3.1 Responsive organizational dynamism. 4 4 INFORMATION TECHNOLO GY is a way to address the changing requirements of business processes caused by the sharp increases in uses of technology. Evolving tech- nologies have become catalysts for competitive initiatives that create new and different ways to determine successful business investment. Thus, there is a dynamic business variable that drives the need for technology infrastructures capable of greater flexibility and of exhib-
- 7. iting greater integration with all business operations. Historically, organizational experiences with IT investment have resulted in two phases of measured returns. The first phase often shows negative or declining productivity as a result of the investment; in the second phase, we often see a lagging of, although eventual return to, productivity. The lack of returns in the first phase has been attributed to the nature of the early stages of technology exploration and experimentation, which tend to slow the process of organizational adaptation to technology. The production phase then lags behind the ability of the organization to integrate new technologies with its existing processes. Another complication posed by technological dynamism via the process of strategic integration is a phenomenon we can call factors of multiplicity — essentially, what happens when several new technology opportunities overlap and create myriad projects that are in various phases of their developmental life cycle. Furthermore, the problem is compounded by lagging returns in productivity, which are complicated to track and to represent to management. Thus, it is important that organizations find ways to shorten the period between investment and technology’ s effective deployment. Murphy
- 8. (2002) identifies several factors that are critical to bridging this delta: 1. Identifying the processes that can provide acceptable business returns from new technological investments 2. Establishing methodologies that can determine these processes 3. Finding ways to actually perform and realize expected benefits 4. Integrating IT projects with other projects 5. Adjusting project objectives when changes in the business require them Technology complicates these actions, making them more difficult to resolve; hence the need to manage the complications. To tackle these compounded concerns, strategic integration can shorten life cycle maturation by focusing on the following integrating factors: 4 5teChnolo GY As A vArIAble And resp onsIve • Addressing the weaknesses in management organizations in terms of how to deal with new technologies, and how to bet- ter realize business benefits • Providing a mechanism that both enables organizations to deal with accelerated change caused by technological innova- tions and integrates them into a new cycle of processing and
- 9. handling change • Providing a strategic learning framework by which every new technology variable adds to organizational knowledge, par- ticularly using reflective practices (see Chapter 4) • Establishing an integrated approach that ties technology accountability to other measurable outcomes using organiza- tional learning techniques and theories To realize these objectives, organizations must be able to • Create dynamic internal processes that can function on a daily basis to deal with understanding the potential fit of new technologies and their overall value to the business • Provide the discourse to bridge the gaps between IT- and non-IT-related investments and uses into an integrated system • Monitor investments and determine modifications to the life cycle • Implement various organizational learning practices, includ- ing learning organization, knowledge management, change management, and communities of practice, all of which help foster strategic thinking and learning that can be linked to performance (Gephardt & Marsick, 2003) Another important aspect of strategic integration is what Murphy (2002) calls “ consequential interoperability,” in which “ the conse- quences of a business process” are understood to “ dynamically trigger integration” (p. 31). This integration occurs in what he calls the five
- 10. pillars of benefits realization: 1. Strategic alignment: The alignment of IT strategically with business goals and objectives. 2. Business process impact: The impact on the need for the organi- zation to redesign business processes and integrate them with new technologies. 4 6 INFORMATION TECHNOLO GY 3. Architecture: The actual technological integration of appli- cations, databases, and networks to facilitate and support implementation. 4. Payback: The basis for computing return on investment (ROI) from both direct and indirect perspectives. 5. Risk: Identifying the exposure for underachievement or fail- ure in the technology investment. Murphy’ s (2002) pillars are useful in helping us understand how technology can engender the need for responsive organizational dyna- mism (ROD), especially as it bears on issues of strategic integration. They also help us understand what becomes the strategic integration component of ROD. His theory on strategic alignment and business process impact supports the notion that IT will increasingly
- 11. serve as an undergirding force, one that will drive enterprise growth by identify- ing the initiators (such as e-business on the Internet) that best fit busi- ness goals. Many of these initiators will be accelerated by the growing use of e-business, which becomes the very driver of many new market realignments. This e-business realignment will require the ongoing involvement of executives, business managers, and IT managers. In fact, the Gartner Group forecasted that 70% of new software applica- tion investments and 5% of new infrastructure expenditures by 2005 would be driven by e-business. Indeed, this has occurred and contin- ues to expand. The combination of evolving business drivers with accelerated and changing customer demands has created a business revolution that best defines the imperative of the strategic integration component of ROD. The changing and accelerated way businesses deal with their customers and vendors requires a new strategic integration to become a reality rather than remain a concept discussed but affecting little action. Without action directed toward new strategic integration, organizations would lose competitive advantage, which would
- 12. affect profits. Most experts see e-business as the mechanism that will ulti- mately require the integrated business processes to be realigned, thus providing value to customers and modifying the customer– vendor relationship. The driving force behind this realignment emanates from the Internet, which serves as the principle accelerator of the change in transactions across all businesses. The general need to optimize 47teChnolo GY As A vArIAble And resp onsIve resources forces organizations to rethink and to realign business pro- cesses to gain access to new business markets. Murphy’ s (2002) pillar of architecture brings out yet another aspect of ROD. By architecture we mean the focus on the effects that technol- ogy has on existing computer applications or legacy systems (old exist- ing systems). Technology requires existing IT systems to be modified or replacement systems to be created that will mirror the new busi- ness realignments. These changes respond to the forces of strategic integration and require business process reengineering (BPR) activi-
- 13. ties, which represent the reevaluation of existing systems based on changing business requirements. It is important to keep in mind the acceleration factors of technology and to recognize the amount of organizational effort and time that such projects take to complete. We must ask the following question: How might organizations respond to these continual requirements to modify existing processes? I discuss in other chapters how ROD represents the answer to this question. Murphy’ s (2002) pillar of direct return is somewhat limited and nar- row because not all IT value can be associated with direct returns, but it is important to discuss. Technology acceleration is forcing organiza- tions to deal with broader issues surrounding what represents a return from an investment. The value of strategic integration relies heavily on the ability of technology to encapsulate itself within other departments where it ultimately provides the value. We show in Chapter 4 that this issue also has significance in organizational formation. What this means is simply that value can be best determined within individual business units at the microlevel and that these appropriate-level busi- ness units also need to make the case for why certain
- 14. investments need to be pursued. There are also paybacks that are indirect; for example, Lucas (1999) demonstrates that many technology investments are non- monetary. The IT department (among others) becomes susceptible to great scrutiny and subject to budgetary cutbacks during economically difficult times. This does not suggest that IT “ hide” itself but rather that its investment be integrated within the unit where it provides the most benefit. Notwithstanding the challenge to map IT expenditures to their related unit, there are always expenses that are central to all departments, such as e-mail and network infrastructure. These types of expenses can rarely provide direct returns and are typically allocated across departments as a cost of doing business. 4 8 INFORMATION TECHNOLO GY Because of the increased number of technology opportuni- ties, Murphy’ s (2002) risk pillar must be a key part of strategic integration. The concept of risk assessment is not new to an organiza- tion; however, it is somewhat misunderstood as it relates to technology assessment. Technology assessment, because of the acceleration factor, must be embedded within the strategic decision-making process.
- 15. This can only be accomplished by having an understanding of how to align technology opportunities for business change and by understanding the cost of forgoing the opportunity as well as the cost of delays in delivery. Many organizations use risk assessment in an unstructured way, which does not provide a consistent framework to dynamically deal with emerging technologies. Furthermore, such assessment needs to be managed at all levels in the organization as opposed to being an event-driven activity controlled only by executives. Summary Strategic integration represents the objective of dealing with emerg- ing technologies on a regular basis. It is an outcome of ROD, and it requires organizations to deal with a variable, that forces acceleration of decisions in an unpredictable fashion. Strategic integration would require businesses to realign the ways in which they include technol- ogy in strategic decision making. Cultural Assimilation Cultural assimilation is a process that focuses on the organizational aspects of how technology is internally organized, including the
- 16. role of the IT department, and how it is assimilated within the organiza- tion as a whole. The inherent, contemporary reality of technologi- cal dynamism requires not only strategic but also cultural change. This reality demands that IT organizations connect to all aspects of the business. Such affiliation would foster a more interactive culture rather than one that is regimented and linear, as is too often the case. An interactive culture is one that can respond to emerging technology decisions in an optimally informed way, and one that understands the impact on business performance. 4 9teChnolo GY As A vArIAble And resp onsIve The kind of cultural assimilation elicited by technological dyna- mism and formalized in ROD is divided into two subcategories: the study of how the IT organization relates and communicates with “ others,” and the actual displacement or movement of traditional IT staff from an isolated “ core” structure to a firm-wide, integrated framework. IT Organization Communications with “ Others” The Ravell case study shows us the limitations and
- 17. consequences of an isolated IT department operating within an organization. The case study shows that the isolation of a group can lead to marginalization, which results in the kind of organization in which not all individuals can participate in decision making and implementation, even though such individuals have important knowledge and value. Technological dynamism is forcing IT departments to rethink their strategic posi- tion within the organizational structure of their firm. No longer can IT be a stand-alone unit designed just to service outside departments while maintaining its separate identity. The acceleration factors of technology require more dynamic activity within and among depart- ments, which cannot be accomplished through discrete communica- tions between groups. Instead, the need for diverse groups to engage in more integrated discourse, and to share varying levels of techno- logical knowledge, as well as business-end perspectives, requires new organizational structures that will of necessity give birth to a new and evolving business— social culture. Indeed, the need to assimilate technology creates a transformative effect on organizational cultures, the way they are formed and re-formed, and what they will need
- 18. from IT personnel. Movement of Traditional IT Staff To facilitate cultural assimilation from an IT perspective, IT must become better integrated with non-IT personnel. This form of inte- gration can require the actual movement of IT staff into other depart- ments, which begins the process of a true assimilation of resources among business units. While this may seem like the elimination of 5 0 INFORMATION TECHNOLO GY the integrity or identity of IT, such a loss is far from the case. The elimination of the IT department is not at all what is called for here; on the contrary, the IT department is critical to the function of cul- tural assimilation. However, the IT department may need to be struc- tured differently from the way it has been so that it can deal primarily with generic infrastructure and support issues, such as e-mail, net- work architecture, and security. IT personnel who focus on business- specific issues need to become closely aligned with the appropriate
- 19. units so that ROD can be successfully implemented. Furthermore, we must acknowledge that, given the wide range of available knowledge about technology, not all technological knowl- edge emanates from the IT department. The question becomes one of finding the best structure to support a broad assimilation of knowledge about any given technology; then, we should ask how that knowledge can best be utilized by the organization. There is a pitfall in attempting to find a “ standard” IT organizational structure that will address the cultural assimilation of technology. Sampler’ s (1996) research, and my recent research with chief executives, confirms that no such standard structure exists. It is my position that organizations must find their own unique blend, using organizational learning con- structs. This simply means that the cultural assimilation of IT may be unique to the organization. What is then more important for the success of organizational development is the process of assimilation as opposed to the transplanting of the structure itself. Today, many departments still operate within “ silos” where they are unable to meet the requirements of the dynamic and unpredictable nature of technology in the business environment. Traditional
- 20. orga- nizations do not often support the necessary communications needed to implement cultural assimilation across business units. However, business managers can no longer make decisions without considering technology; they will find themselves needing to include IT staff in their decision-making processes. On the other hand, IT departments can no longer make technology-based decisions without concerted efforts toward assimilation (in contrast to occasional partnering or project-driven participation) with other business units. This assimi- lation becomes mature when new cultures evolve synergistically as opposed to just having multiple cultures that attempt to work in con- junction with each other. The important lesson from Ravell to keep 51teChnolo GY As A vArIAble And resp onsIve in mind here is that the process of assimilating IT can create new cultures that in turn evolve to better support the requirements estab- lished by the dynamism of technology. Eventually, these new cultural formations will not perceive them-
- 21. selves as functioning within an IT or non-IT decision framework but rather as operating within a more central business operation that understands how to incorporate varying degrees of IT involvement as necessary. Thus, organizational cultures will need to fuse together to respond to new business opportunities and requirements brought about by the ongoing acceleration of technological innovation. This was also best evidenced by subsequent events at Ravell. Three years after the original case study, it became necessary at Ravell to inte- grate one of its business operations with a particular group of IT staff members. The IT personnel actually transferred to the business unit to maximize the benefits of merging both business and technical cul- tures. Interestingly, this business unit is currently undergoing cultural assimilation and is developing its own behavioral norms influenced by the new IT staff. However, technology decisions within such groups are not limited to the IT transferred personnel. IT and non-IT staff need to formulate decisions using various organizational learning techniques. These techniques are discussed in the next chapter. Summary
- 22. Without appropriate cultural assimilation, organizations tend to have staff that “ take shortcuts, [then] the loudest voice will win the day, ad hoc decisions will be made, accountabilities lost, and lessons from suc- cesses and failures will not become part of ... wisdom” (Murphy, 2002, p. 152). As in the case of Ravell Corporation, it is essential, then, to provide for consistent governance that fits the profile of the existing cul- ture or can establish the need for a new culture. While many scholars and managers suggest the need to have a specific entity responsible for IT governance, one that is to be placed within the operating structure of the organization, such an approach creates a fundamental problem. It does not allow staff and managers the opportunity to assimilate tech- nologically driven change and understand how to design a culture that can operate under ROD. In other words, the issue of governance is misinterpreted as a problem of structural positioning or hierarchy when 5 2 INFORMATION TECHNOLO GY it is really one of cultural assimilation. As a result, many business solu- tions to technology issues often lean toward the prescriptive,
- 23. instead of the analytical, in addressing the real problem. Murphy’ s (2002) risk pillar theory offers us another important component relevant to cultural assimilation. This approach addresses the concerns that relate to the creation of risk cultures formed to deal with the impact of new systems. New technologies can actually cause changes in cultural assimilation by establishing the need to make cer- tain changes in job descriptions, power structures, career prospects, degree of job security, departmental influence, or ownership of data. Each of these potential risks needs to be factored in as an important part of considering how best to organize and assimilate technology through ROD. Technology Business Cycle To better understand technology dynamism, or how technology acts as a dynamic variable, it is necessary to define the specific steps that occur during its evolution in an organization. The evolution or business cycle depicts the sequential steps during the maturation of a new technology from feasibility to implementation and through subsequent evolution. Table 3.1 shows the five components that comprise the cycle: feasibil-
- 24. ity, measurement, planning, implementation, and evolution. Table 3.1 Technology Business Cycle CYCLE COMPONENT COMPONENT DESCRIPTION Feasibility Understanding how to view and evaluate emerging technologies, from a technical and business perspective. Measurement Dealing with both the direct monetary returns and indirect nonmonetary returns; establishing driver and support life cycles. Planning Understanding how to set up projects, establishing participation across multiple layers of management, including operations and departments. Implementation Working with the realities of project management; operating with political factions, constraints; meeting milestones; dealing with setbacks; having the ability to go live with new systems. Evolution Understanding how acceptance of new technologies affects cultural change, and how uses of technology will change as individuals and organizations become more knowledgeable about technology, and generate new ideas about how it can be used; objective is established through organizational dynamism, creating new knowledge and an evolving organization.
- 25. 5 3teChnolo GY As A vArIAble And resp onsIve Feasibility The stage of feasibility focuses on a number of issues surrounding the practicality of implementing a specific technology. Feasibility addresses the ability to deliver a product when it is needed in com- parison to the time it takes to develop it. Risk also plays a role in feasibility assessment; of specific concern is the question of whether it is possible or probable that the product will become obsolete before completion. Cost is certainly a huge factor, but viewed at a “ high level” (i.e., at a general cost range), and it is usually geared toward meeting the expected ROI of a firm. The feasibility process must be one that incorporates individuals in a way that allows them to respond to the accelerated and dynamic process brought forth by technological innovations. Measurement Measurement is the process of understanding how an investment in technology is calculated, particularly in relation to the ROI of
- 26. an organization. The complication with technology and measurement is that it is simply not that easy to determine how to calculate such a return. This problem comes up in many of the issues discussed by Lucas (1999) in his book Information Technology and the Productivity Paradox. His work addresses many comprehensive issues, surround- ing both monetary and nonmonetary ROI, as well as direct ver- sus indirect allocation of IT costs. Aside from these issues, there is the fact that for many investments in technology the attempt to compute ROI may be an inappropriate approach. As stated, Lucas offered a “ garbage can” model that advocates trust in the operational management of the business and the formation of IT representatives into productive teams that can assess new technologies as a regu- lar part of business operations. The garbage can is an abstract con- cept for allowing individuals a place to suggest innovations brought about by technology. The inventory of technology opportunities needs regular evaluation. Lucas does not really offer an explana- tion of exactly how this process should work internally. ROD, how- ever, provides the strategic processes and organizational– cultural needs that can provide the infrastructure to better understand
- 27. and 5 4 INFORMATION TECHNOLO GY evaluate the potential benefits from technological innovations using the garbage can model. The graphic depiction of the model is shown in Figure 3.2. Planning Planning requires a defined team of user and IT representatives. This appears to be a simple task, but it is more challenging to understand how such teams should operate, from whom they need support, and what resources they require. Let me be specific. There are a number of varying types of “ users” of technology. They typically exist in three tiers: executives, business line managers, and operations users. Each of these individuals offers valuable yet different views of the benefits of technology (Langer, 2002). I define these user tiers as follows: 1. Executives: These individuals are often referred to as execu- tive sponsors. Their role is twofold. First, they provide input into the system, specifically from the perspective of pro- ductivity, ROI, and competitive edge. Second, and per- haps more important, their responsibility is to ensure that
- 28. users are participating in the requisite manner (i.e., made Garbage can model of IT value Failed systems Direct benefits Indirect benefits User needs, etc. C on ve rs io n eff ec ti ve ne ss �e IT value pipeline
- 29. Figure 3.2 Garbage can model of IT value. (From Lucas, H.C., Information Technology and the Productivity Paradox. Oxford University Press, New York, 1999.) 5 5teChnolo GY As A vArIAble And resp onsIve to be available, in the right place, etc.). This area can be problematic because internal users are typically busy doing their jobs and sometimes neglect to provide input or to attend project meetings. Furthermore, executive sponsors can help control political agendas that can hurt the success of the project. 2. Business line managers: This interface provides the most information from a business unit perspective. These indi- viduals are responsible for two aspects of management. First, they are responsible for the day-to-day productivity of their unit; therefore, they understand the importance of productive teams, and how software can assist in this endeavor. Second, they are responsible for their staff. Thus, line managers need to know how software will affect their operational staff. 3. Functional users: These are the individuals in the trenches who understand exactly how processing needs to get done. While their purview of the benefits of the system is relatively nar- rower than that of the executives and managers, they provide the concrete information that is required to create the feature/ functions that make the system usable. The planning process becomes challenging when attempting to get the three user communities to integrate their needs and “
- 30. agree to agree” on how a technology project needs to be designed and managed. Implementation Implementation is the process of actually using a technology. Implementation of technology systems requires wider integration within the various departments than other systems in an organization because usually multiple business units are affected. Implementation must combine traditional methods of IT processes of development yet integrate them within the constraints, assumptions, and cultural (perhaps political) environments of different departments. Cultural assimilation is therefore required at this stage because it delves into the structure of the internal organization and requires individual participation in every phase of the development and implementation 5 6 INFORMATION TECHNOLO GY cycle. The following are some of the unique challenges facing the implementation of technological projects: 1. Project managers as complex managers: Technology projects require multiple interfaces that often lie outside the traditional user community. They can include interfacing with writers,
- 31. editors, marketing personnel, customers, and consumers, all of whom are stakeholders in the success of the system. 2. Shorter and dynamic development schedules: Due to the dynamic nature of technology, its process of development is less lin- ear than that of others. Because there is less experience in the general user community, and there are more stakeholders, there is a tendency by those in IT, and executives, to underes- timate the time and cost to complete the project. 3. New untested technologies: There is so much new technol- ogy offered to organizations that there is a tendency by IT organizations to implement technologies that have not yet matured— that are not yet the best products they will eventu- ally be. 4. Degree of scope changes: Technology, because of its dynamic nature, tends to be prone to scope creed — the scope of the orig- inal project expanding during development. 5. Project management: Project managers need to work closely with internal users, customers, and consumers to advise them on the impact of changes to the project schedule. Unfortunately, scope changes that are influenced by changes in market trends may not be avoidable. Thus, part of a good strategy is to manage scope changes rather than attempt to stop them, which might not be realistic. 6. Estimating completion time: IT has always had difficulties in knowing how long it will take to implement a technology. Application systems are even more difficult because of the number of variables and unknowns.
- 32. 7. Lack of standards: The technology industry continues to be a profession that does not have a governing body. Thus, it is impossible to have real enforced standards that other pro- fessions enjoy. While there are suggestions for best prac- tices, many of them are unproven and not kept current with 5 7teChnolo GY As A vArIAble And resp onsIve changing developments. Because of the lack of successful application projects, there are few success stories to create new and better sets of best practices. 8. Less-specialized roles and responsibilities: The IT team tends to have staff members who have varying responsibilities. Unlike traditional new technology-driven projects, separation of roles and responsibilities is more difficult when operating in more dynamic environments. The reality is that many roles have not been formalized and integrated using something like ROD. 9. Broad project management responsibilities: Project management responsibilities need to go beyond those of the traditional IT manager. Project managers are required to provide manage- ment services outside the traditional software staff. They need to interact more with internal and external individuals, as well as with non-traditional members of the development team, such as Web text and content staff. Therefore, there are many more obstacles that can cause implementation problems. Evolution The many ways to form a technological organization with a natural
- 33. capacity to evolve have been discussed from an IT perspective in this chapter. However, another important factor is the changing nature of application systems, particularly those that involve e- businesses. E-business systems are those that utilize the Internet and engage in e-commerce activities among vendors, clients, and internal users in the organization. The ways in which e-business systems are built and deployed suggest that they are evolving systems. This means that they have a long life cycle involving ongoing maintenance and enhancement. They are, if you will, “ living systems” that evolve in a manner similar to organizational cultures. So, the traditional beginning-to-end life cycle does not apply to an e-business proj- ect that must be implemented in inherently ongoing and evolving phases. The important focus is that technology and organizational development have parallel evolutionary processes that need to be in balance with each other. This philosophy is developed further in the next chapter. 5 8 INFORMATION TECHNOLO GY Drivers and Supporters
- 34. There are essentially two types of generic functions performed by departments in organizations: driver functions and supporter func- tions. These functions relate to the essential behavior and nature of what a department contributes to the goals of the organization. I first encountered the concept of drivers and supporters at Coopers & Lybrand, which was at that time a Big 8* accounting firm. I stud- ied the formulation of driver versus supporter as it related to the role of our electronic data processing (EDP) department. The firm was attempting to categorize the EDP department as either a driver or a supporter. Drivers were defined in this instance as those units that engaged in frontline or direct revenue-generating activities. Supporters were units that did not generate obvious direct revenues but rather were designed to support frontline activities. For example, operations such as internal accounting, purchasing, or office management were all classified as supporter departments. Supporter departments, due to their nature, were evaluated on their effectiveness and efficiency or economies of scale. In contrast, driver organizations were expected to generate direct revenues and other ROI value for the firm. What
- 35. was also interesting to me at the time was that drivers were expected to be more daring— since they must inevitably generate returns for the business. As such, drivers engaged in what Bradley and Nolan (1998) coined “ sense and respond” behaviors and activities. Let me explain. Marketing departments often generate new business by investing or “ sensing” an opportunity quickly because of competitive forces in the marketplace. Thus, they must sense an opportunity and be allowed to respond to it in a timely fashion. The process of sensing opportunity, and responding with competitive products or services, is a stage in the cycle that organizations need to support. Failures in the cycles of sense and respond are expected. Take, for example, the * The original “ Big 8” consisted of the eight large accounting and management con- sulting firms— Coopers & Lybrand, Arthur Anderson, Touche Ross, Deloitte Haskins & Sells, Arthur Young, Price Waterhouse, Pete Marwick Mitchell, and Ernst and Whinney— until the late 1980s, when these firms began to merge. Today, there are four: Price Waterhouse Coopers, Deloitte & Touche, Ernst & Young, and KPMG (Pete Marwick and others).
- 36. 5 9teChnolo GY As A vArIAble And resp onsIve launching of new fall television shows. Each of the major stations goes through a process of sensing which shows might be interesting to the viewing audience. They respond, after research and review, with a number of new shows. Inevitably, only a few of these selected shows are actually successful; some fail almost immediately. While relatively few shows succeed, the process is acceptable and is seen by manage- ment as the consequence of an appropriate set of steps for competing effectively— even though the percentage of successful new shows is low. Therefore, it is safe to say that driver organizations are expected to engage in high-risk operations, of which many will fail, for the sake of creating ultimately successful products or services. The preceding example raises two questions: (1) How does sense and respond relate to the world of IT? and (2) Why is it important? IT is unique in that it is both a driver and a supporter. The latter is the generally accepted norm in most firms. Indeed, most IT functions are established to support myriad internal functions, such as
- 37. • Accounting and finance • Data center infrastructure (e-mail, desktop, etc.) • Enterprise-level application (enterprise resource planning, ERP) • Customer support (customer relationship management, CRM) • Web and e-commerce activities As one would expect, these IT functions are viewed as overhead related, as somewhat of a commodity, and thus are constantly man- aged on an economy-of-scale basis— that is, how can we make this operation more efficient, with a particular focus on cost containment? So, what then are IT driver functions? By definition, they are those that engage in direct revenues and identifiable ROI. How do we define such functions in IT because most activities are sheltered under the umbrella of marketing organization domains? (Excluding, of course, software application development firms that engage in marketing for their actual application products.) I define IT driver functions as those projects that, if delivered, would change the relationship between the organization and its customers; that is, those activities that directly affect the classic definition of a market: forces of supply and demand, which are governed by the customer (demand) and the vendor (sup- plier) relationship. This concept can be shown in the case
- 38. example that follows. 6 0 INFORMATION TECHNOLO GY Santander versus Citibank Santander Bank, the major bank of Spain, had enjoyed a dominant market share in its home country. Citibank had attempted for years to penetrate Santander’ s dominance using traditional approaches (open- ing more branch offices, marketing, etc.) without success, until, that is, they tried online banking. Using technology as a driver, Citibank made significant penetration into the market share of Santander because it changed the customer– vendor relationship. Online bank- ing, in general, has had a significant impact on how the banking industry has established new markets, by changing this relationship. What is also interesting about this case is the way in which Citibank accounted for its investment in online banking; it knows little about its total investment and essentially does not care about its direct pay- back. Rather, Citibank sees its ROI in a similar way that depicts driver/marketing behavior; the payback is seen in broader terms to affect not only revenue generation, but also customer support and
- 39. quality recognition. Information Technology Roles and Responsibilities The preceding section focuses on how IT can be divided into two dis- tinct kinds of business operations. As such, the roles and responsibili- ties within IT need to change accordingly and be designed under the auspices of driver and supporter theory. Most traditional IT depart- ments are designed to be supporters, so that they have a close- knit organization that is secure from outside intervention and geared to respond to user needs based on requests. While in many instances this type of formation is acceptable, it is limited in providing the IT department with the proper understanding of the kind of business objectives that require driver-type activities. This was certainly the experience in the Ravell case study. In that instance, I found that making the effort to get IT support personnel “ out from their com- fortable shells” made a huge difference in providing better service to the organization at large. Because more and more technology is becoming driver essential, this development will require of IT per- sonnel an increasing ability to communicate to managers and execu-
- 40. tives and to assimilate within other departments. 61teChnolo GY As A vArIAble And resp onsIve The Ravell case, however, also brought to light the huge vacuum of IT presence in driver activities. The subsequent chief executive inter- view study also confirmed that most marketing IT-oriented activities, such as e-business, do not fall under the purview of IT in most orga- nizations. The reasons for this separation are correlated with the lack of IT executive presence within the management team. Another aspect of driver and supporter functions is the concept of a life cycle. A life cycle, in this respect, refers to the stages that occur before a product or service becomes obsolete. Technology products have a life cycle of value just as any other product or service. It is important not to confuse this life cycle with processes during devel- opment as discussed elsewhere in this chapter. Many technical products are adopted because they are able to deliver value that is typically determined based on ROI calculations. However, as products mature within an organization, they tend to become more of
- 41. a commodity, and as they are normalized, they tend to become support- oriented. Once they reach the stage of support, the rules of economies of scale become more important and relevant to evaluation. As a prod- uct enters the support stage, replacement based on economies of scale can be maximized by outsourcing to an outside vendor who can provide the service cheaper. New technologies then can be expected to follow this kind of life cycle, by which their initial investment requires some level of risk to provide returns to the business. This initial investment is accomplished in ROD using strategic integration. Once the evalua- tions are completed, driver activities will prevail during the maturation process of the technology, which will also require cultural assimilation. Inevitably, technology will change organizational behavior and struc- ture. However, once the technology is assimilated and organizational behavior and structures are normalized, individuals will use it as a per- manent part of their day-to-day operations. Thus, driver activities give way to those of supporters. Senior managers become less involved, and line managers then become the more important group that completes the transition from driver to supporter.
- 42. Replacement or Outsource After the technology is absorbed into operations, executives will seek to maximize the benefit by increased efficiency and effectiveness. 6 2 INFORMATION TECHNOLO GY Certain product enhancements may be pursued during this phase; they can create “ mini-loops” of driver-to-supporter activities. Ultimately, a technology, viewed in terms of its economies of scale and longevity, is considered for replacement or outsourcing. Figure 3.3 graphically shows the cycle. The final stage of maturity of an evolving driver therefore includes becoming a supporter, at which time it becomes a commodity and, finally, an entity with potential for replacement or outsourcing. The next chapter explores how organizational learning theories can be used to address many of the issues and challenges brought forth in this chapter. Mini loop technology enhancementsTechnology driver
- 43. Evaluation cycle Driver maturation Support status Replacement or outsource Economies of scale Figure 3.3 Driver-to-supporter life cycle. CoverHalf TitleTitle PageCopyright PageContentsForewordAcknowledgments Author Introduction1: The “Ravell” CorporationIntroductionA New ApproachThe Blueprint for IntegrationEnlisting Support Assessing ProgressResistance in the RanksLine Management to the RescueIT Begins to ReflectDefining an Identity for Information TechnologyImplementing the Integration: A Move toward Trust and ReflectionKey Lessons Defining Reflection and Learning for an Organization Working toward a Clear Goal Commitment to Quality Teaching Staff “Not to Know” Transformation of Culture Alignment with Administrative DepartmentsConclusion2: The IT DilemmaIntroductionRecent BackgroundIT in the Organizational ContextIT and Organizational StructureThe Role of IT in Business StrategyWays of Evaluating ITExecutive Knowledge and Management of ITIT: A View from the TopSection 1: Chief Executive Perception of the Role of ITSection 2: Management and Strategic IssuesSection 3: Measuring IT Performance and ActivitiesGeneral ResultsDefining the IT DilemmaRecent Developments in Operational Excellence3: Technology as a
- 44. Variable and Responsive Organizational DynamismIntroductionTechnological DynamismResponsive Organizational DynamismStrategic IntegrationSummaryCultural AssimilationIT Organization Communications with “ Others” Movement of Traditional IT StaffSummaryTechnology Business CycleFeasibilityMeasurementPlanningImplementationEvolution Drivers and SupportersSantander versus Citibank Information Technology Roles and ResponsibilitiesReplacement or Outsource4: Organizational Learning Theories and TechnologyIntroductionLearning OrganizationsCommunities of PracticeLearning Preferences and Experiential LearningSocial Discourse and the Use of LanguageIdentitySkillsEmotionLinear Development in Learning Approaches5: Managing Organizational Learning and TechnologyThe Role of Line ManagementLine ManagersFirst-Line ManagersSupervisorManagement VectorsKnowledge ManagementChange Management Change Management for IT OrganizationsSocial Networks and Information Technology6: Organizational Transformation and the Balanced ScorecardIntroductionMethods of Ongoing EvaluationBalanced Scorecards and DiscourseKnowledge Creation, Culture, and Strategy7: Virtual Teams and OutsourcingIntroductionStatus of Virtual TeamsManagement ConsiderationsDealing with Multiple LocationsExternalizationInternalizationCombinationSocializatio nExternalization DynamismInternalization DynamismCombination DynamismSocialization DynamismDealing with Multiple Locations and OutsourcingRevisiting Social DiscourseIdentitySkillsEmotion8: Synergistic Union of IT and Organizational LearningIntroductionSiemens AGAftermathICAPFive Years LaterHTCIT History at HTCInteractions of the CEOThe ProcessTransformation from the TransitionFive Years LaterSummary9: Forming a Cyber Security CultureIntroductionHistoryTalking to the BoardEstablishing a Security CultureUnderstanding What It Means to Be
- 45. CompromisedCyber Security Dynamism and Responsive Organizational DynamismCyber Strategic IntegrationCyber Cultural AssimilationSummaryOrganizational Learning and Application DevelopmentCyber Security RiskRisk ResponsibilityDriver /Supporter Implications10: Digital Transformation and Changes in Consumer BehaviorIntroductionRequirements without Users and without InputConcepts of the S-Curve and Digital Transformation Analysis and Design Organizational Learning and the S- CurveCommunities of PracticeThe IT Leader in the Digital Transformation EraHow Technology Disrupts Firms and IndustriesDynamism and Digital DisruptionCritical Components of “ Digital” Organization Assimilating Digital Technology Operationally and CulturallyConclusion11: Integrating Generation Y Employees to Accelerate Competitive AdvantageIntroductionThe Employment Challenge in the Digital EraGen Y Population AttributesAdvantages of Employing Millennials to Support Digital TransformationIntegration of Gen Y with Baby Boomers and Gen XDesigning the Digital EnterpriseAssimilating Gen Y Talent from Underserved and Socially Excluded PopulationsLanger Workforce Maturity ArcTheoretical Constructs of the LWMAThe LWMA and Action ResearchImplications for New Pathways for Digital TalentDemographic Shifts in Talent ResourcesEconomic SustainabilityIntegration and TrustGlobal Implications for Sources of TalentConclusion12: Toward Best PracticesIntroductionChief IT ExecutiveDefinitions of Maturity Stages and Dimension Variables in the Chief IT Executive Best Practices ArcMaturity StagesPerformance DimensionsChief Executive OfficerCIO Direct Reporting to the CEOOutsourcingCentralization versus Decentralization of ITCIO Needs Advanced DegreesNeed for StandardsRisk ManagementThe CEO Best Practices Technology ArcDefinitions of Maturity Stages and Dimension Variables in the CEO Technology Best Practices ArcMaturity StagesPerformance DimensionsMiddle ManagementThe Middle Management Best
- 46. Practices Technology ArcDefinitions of Maturity Stages and Dimension Variables in the Middle Manager Best Practices ArcMaturity StagesPerformance DimensionsSummaryEthics and Maturity13: ConclusionIntroductionGlossaryOrganizational Learning DefinitionsReferences Index Chapter 3: Software Learning Objectives Upon successful completion of this chapter, you will be able to: • define the term software; • identify and describe the two primary categories of software; • describe the role ERP software plays in an organization; • describe cloud computing and its advantages and disadvantages for use in an organization; and • define the term open-source and identify its primary characteristics. Introduction
- 47. The second component of an information system is software, the set of instructions that tells the hardware what to do. Software is created by developers through the process of programming (covered in more detail in Chapter 10). Without software, the hardware would not be functional. 54 | Chapter 3: Software Types of Software Software can be broadly divided into two categories: operating systems and application software. Operating systems manage the hardware and create the interface between the hardware and the user. Application software performs specific tasks such as word processing, accounting, database management, video games, or browsing the web. Operating Systems An operating system is first loaded into the computer by the boot program, then it manages all of the programs in the
- 48. computer, including both programs native to the operating system such as file and memory management and application software. Operating systems provide you with these key functions: 1. managing the hardware resources of the computer; 2. providing the user-interface components; Chapter 3: Software | 55 Linux Ubuntu desktop 3. providing a platform for software developers to write applications. All computing devices require an operating system. The most popular operating systems for personal computers are: Microsoft Windows, Apple’s Mac OS, and various versions of Linux. Smartphones and tablets run operating systems as well, such as iOS (Apple), Android (Google), Windows Mobile (Microsoft), and Blackberry.
- 49. Microsoft provided the first operating system for the IBM-PC, released in 1981. Their initial venture into a Graphical User Interface (GUI) operating system, known as Windows, occurred in 1985. Today’s Windows 10 supports the 64-bit Intel CPU. Recall that “64-bit” indicates the size of data that can be moved within the computer. Apple introduced the Macintosh computer 1984 with the first commercially successful GUI. Apple’s operating system for the Macintosh is known as “Mac OS ” and also uses an Intel CPU supporting 64-bit processing. Mac OS versions have been named after mountains such as El Capitan, Sierra, and High Sierra. Multitasking, virtual memory, and voice input have become standard features of both operating systems. The Linux operating system is open source, meaning individual developers are allowed to make modifications
- 50. to the programming code. Linux is a version of the Unix operating. Unix runs on large and expensive minicomputers. Linux developer Linus Torvalds, a professor in Finland and the creator of Linux, wanted to find a way to make Unix run on less expensive personal computers. Linux has many variations and now powers a large percentage of web servers in the world. 56 | Information Systems for Business and Beyond (2019) Sidebar: Why Is Microsoft Software So Dominant in the Business World? If you’ve worked in business, you may have noticed that almost all computers in business run a version of Microsoft Windows. However, in classrooms from elementary to college, there is almost
- 51. a balance between Macs and PCs. Why has this not extended into the business world? As discussed in Chapter 1, many businesses used IBM mainframe computers back in the 1960s and 1970s. When businesses migrated to the microcomputer (personal computer) market, they elected to stay with IBM and chose the PC. Companies took the safe route, invested in the Microsoft operating system and in Microsoft software/applications. Microsoft soon found itself with the dominant personal computer operating system for businesses. As the networked PC began to replace the mainframe computer, Microsoft developed a network operating system along with a complete suite of programs focused on business users. Today Microsoft Office in its various forms controls 85% of the market. 1 Application Software
- 52. The second major category of software is application software. 1. [1] Chapter 3: Software | 57 Image of Microsoft Excel Application software is utilized directly today to accomplish a specific goal such as word processing, calculations on a spreadsheet, or surfing the Internet using your favorite browser. The “Killer” App When a new type of digital device is invented, there are generally a small group of technology enthusiasts who will purchase it just for the joy of figuring out how it works. A “killer” application is one that becomes so essential that large numbers of people will buy a
- 53. device just to run that application. For the personal computer, the killer application was the spreadsheet. The first spreadsheet was created by an MBA student at Harvard University who tired of making repeated calculations to determine the optimal result on a problem and decided to create a tool that allowed the user to easily change values and recalculate formulas. The result was the spreadsheet. Today’s dominant spreadsheet is Microsoft Excel which still retains the basic functionality of the first spreadsheet. Productivity Software Along with the spreadsheet, several other software applications have become standard tools for the workplace. Known as productivity software, these programs allow office employees to complete their daily work efficiently. Many times these applications 58 | Information Systems for Business and Beyond (2019)
- 54. come packaged together, such as in Microsoft’s Office suite. Here is a list of some of these applications and their basic functions: • Word processing Users can create and edit documents using this class of software. Functions include the ability to type and edit text, format fonts and paragraphs, as well as add, move, and delete text throughout the document. Tables and images can be inserted. Documents can be saved in a variety of electronic file formats with Microsoft Word’s DOCX being the most popular. Documents can also be converted to other formats such as Adobe’s PDF (Portable Document Format) or a .TXT file. • Spreadsheet This class of software provides a way to do numeric calculations and analysis, displaying the result in charts and graphs. The working area is divided into rows and columns, where users can enter numbers, text, or formulas. It is the formulas that make a spreadsheet powerful, allowing the user to develop complex calculations that can change based on the numbers entered. The most popular spreadsheet package
- 55. is Microsoft Excel, which saves its files in the XLSX format. • Presentation Users can create slideshow presentations using this class of software. The slides can be projected, printed, or distributed to interested parties. Text, images, audio, and visual can all be added to the slides. Microsoft’s PowerPoint is the most popular software right now, saving its files in PPTX format. • Some office suites include other types of software. For example, Microsoft Office includes Outlook, its e-mail package, and OneNote, an information-gathering collaboration tool. The professional version of Office also includes Microsoft Access, a database package. (Databases are covered more in Chapter 4.) Microsoft popularized the idea of the office-software productivity Chapter 3: Software | 59 bundle with their release of the Microsoft Office Suite. This package
- 56. continues to dominate the market and most businesses expect employees to know how to use this software. However, many competitors to Microsoft Office do exist and are compatible with the file formats used by Microsoft (see table below). Microsoft also offers a cloud-based version of their office suite named Microsoft Office 365. Similar to Google Drive, this suite allows users to edit and share documents online utilizing cloud-computing technology. Utility Software and Programming Software Utility software includes programs that allow you to fix or modify your computer in some way. Examples include anti-malware software and programs that totally remove software you no longer want installed. These types of software packages were created to fill shortcomings in operating systems. Many times a subsequent
- 57. release of an operating system will include these utility functions as part of the operating system itself. Programming software’s purpose is to produce software. Most of 60 | Information Systems for Business and Beyond (2019) https://commons.wikimedia.org/wiki/User:Wgsimon Screen shot of Tableau (click to enlarge) these programs provide developers with an environment in which they can write the code, test it, and convert/compile it into the format that can then be run on a computer. This software is typically identified as the Integrated Development Environment (IDE) and is provided free from the corporation that developed the programming language that will be used to write the code. Sidebar: “PowerPointed” to Death As presentation software has gained acceptance as the
- 58. primary method to formally present information to a group or class, the art of giving an engaging presentation is becoming rare. Many presenters now just read the bullet points in the presentation and immediately bore those in attendance, who can already read it for themselves. The real problem is not with PowerPoint as much as it is with the person creating and presenting. Author and chief evangelist Guy Kawasaki has developed the 10/20/ 30 rule for Powerpoint users. Just remember: 10 slides, 20 minutes, 30 point font.” 2 If you are determined to improve your PowerPoint skills, read Presentation Zen by Garr Reynolds. New digital presentation technologies are being developed that
- 59. go beyond Powerpoint. For example, Prezi uses a single canvas for the presentation, allowing presenters to place text, images, and 2. [2] Chapter 3: Software | 61 https://opentextbook.site/informationsystems2019/wp- content/uploads/sites/3/2018/07/TABLUE.png https://opentextbook.site/informationsystems2019/wp- content/uploads/sites/3/2018/07/TABLUE.png http://www.amazon.com/gp/product/0321811984 other media on the canvas, and then navigate between these objects as they present. Tools such as Tableau allow users to analyze data in depth and create engaging interactive visualizations. Sidebar: I Own This Software, Right? Well… When you purchase software and install it on your computer, are you the owner of that software? Technically, you are not! When you install software, you are actually just being given a license to use it.
- 60. When you first install a package, you are asked to agree to the terms of service or the license agreement. In that agreement, you will find that your rights to use the software are limited. For example, in the terms of the Microsoft Office software license, you will find the following statement: “This software is licensed, not sold. This agreement only gives you some rights to use the features included in the software edition you licensed.” For the most part, these restrictions are what you would expect. You cannot make illegal copies of the software and you may not use it to do anything illegal. However, there are other, more unexpected terms in these software agreements. For example, many software agreements ask you to agree to a limit on liability. Again, from Microsoft: “Limitation on and exclusion of damages. You can recover from Microsoft and its suppliers only direct damages up to
- 61. the amount you paid for the software. You cannot recover any other damages, including consequential, lost profits, special, indirect or incidental damages.” This means if a problem with the software causes harm to your business, you cannot hold Microsoft or the supplier responsible for damages. 62 | Information Systems for Business and Beyond (2019) Applications for the Enterprise As the personal computer proliferated inside organizations, control over the information generated by the organization began splintering. For instance, the customer service department creates a customer database to keep track of calls and problem reports, and the sales department also creates a database to keep track of customer information. Which one should be used as the master list of customers? Or perhaps someone in sales might create a spreadsheet to calculate sales revenue, while someone in finance
- 62. creates a different revenue document that meets the needs of their department, but calculates revenue differently. The two spreadsheets will report different revenue totals. Which one is correct? And who is managing all of this information? Enterprise Resource Planning In the 1990s the need to bring an organization’s information back under centralized control became more apparent. The Enterprise Resource Planning (ERP) system (sometimes just called enterprise software) was developed to bring together an entire organization within one program. ERP software utilizes a central database that is implemented throughout the entire organization. Here are some key points about ERP. • A software application. ERP is an application that is used by Chapter 3: Software | 63
- 63. many of an organization’s employees. • Utilizes a central database. All users of the ERP edit and save their information from the same data source. For example, this means there is only one customer table in the database, there is only one sales (revenue) table in the database, etc. • Implemented organization-wide. ERP systems include functionality that covers all of the essential components of a business. An organization can purchase modules for its ERP system that match specific needs such as order entry, manufacturing, or planning. ERP systems were originally marketed to large corporations. However, as more and more large companies began installing them, ERP vendors began targeting mid-sized and even smaller businesses. Some of the more well-known ERP systems include those from SAP, Oracle, and Microsoft. In order to effectively implement an ERP system in an organization, the organization must be ready to make a full commitment. All aspects of the organization are affected as old
- 64. systems are replaced by the ERP system. In general, implementing an ERP system can take two to three years and cost several million dollars. So why implement an ERP system? If done properly, an ERP system can bring an organization a good return on their investment. By consolidating information systems across the enterprise and using the software to enforce best practices, most organizations see an overall improvement after implementing an ERP. Business processes as a form of competitive advantage will be covered in Chapter 9. 64 | Information Systems for Business and Beyond (2019) Customer Relationship Management A Customer Relationship Management (CRM) system manages an organization’s customers. In today’s environment, it is
- 65. important to develop relationships with your customers, and the use of a well- designed CRM can allow a business to personalize its relationship with each of its customers. Some ERP software systems include CRM modules. An example of a well-known CRM package is Salesforce. Supply Chain Management Supply Chain Many organizations must deal with the complex task of managing their supply chains. At its simplest, a supply chain is the linkage between an organization’s suppliers, its manufacturing facilities, and the distributors of its products. Each link in the chain has a multiplying effect on the complexity of the process. For example, if there are two suppliers, one manufacturing facility, and two
- 66. distributors, then the number of links to manage = 4 ( 2 x 1 x 2 ). However, if two more suppliers are added, plus another manufacturing facility, and two more distributors, then the number of links to manage = 32 ( 4 x 2 x 4 ). Also, notice in the above illustration that all arrows have two heads, indicating that information flows in both directions. Suppliers are part of a business’s supply chain. They provide information such as price, size, quantity, etc. to the business. In turn, the business provides information such as quantity on hand at every store to the supplier. The key to successful supply chain management is the information system. Chapter 3: Software | 65 https://commons.wikimedia.org/wiki/Category:Supply_chain#/m edia/File:A_company%27s_supply_chain_(en).png A Supply Chain Management (SCM) system handles the interconnection between these links as well as the inventory of
- 67. the products in their various stages of development. As discussed previously much of Walmart’s success has come from its ability to identify and control the supply chain for its products. Walmart invested heavily in their information system so they could communicate with their suppliers and manage the thousands of products they sell. Walmart realized in the 1980s that the key to their success was information systems. Specifically, they needed to manage their complex supply chain with its thousands of suppliers, thousands of retail outlets, and millions of customers. Their success came from being able to integrate information systems to every entity (suppliers, warehouses, retail stores) through the sharing of sales and inventory data. Take a moment to study the diagram above…look for the double-headed arrow. Notice that data flows down the supply chain from suppliers to retail stores. But it also flows up the supply chain, back to the suppliers so they can be
- 68. up to date regarding production and shipping. Mobile Applications Just as with the personal computer, mobile devices such as 66 | Information Systems for Business and Beyond (2019) smartphones and electronic tablets also have operating systems and application software. These mobile devices are in many ways just smaller versions of personal computers. A mobile app is a software application designed to run specifically on a mobile device. As shown in Chapter 2, smartphones are becoming a dominant form of computing, with more smartphones being sold than personal computers. A greater discussion of PC and smartphone sales appears in Chapter 13, along with statistics regarding the decline in tablet sales. Businesses have adjusted to this trend by increasing their investment in the development of apps for mobile
- 69. devices. The number of mobile apps in the Apple App Store has increased from zero in 2008 to over 2 million in 2017. 3 Building a mobile app will will be covered in Chapter 10. Cloud Computing Historically, for software to run on a computer an individual copy of the software had to be installed on the computer. The concept of “cloud” computing changes this. Cloud Computing The “cloud” refers to applications, services, and data storage located on the Internet. Cloud service providers rely on giant server farms and massive storage devices that are connected via the Internet. Cloud computing allows users to access software and data storage services on the Internet. You probably already use cloud computing in some form. For example, if you access your e-mail via your web browser, you
- 70. are 3. [3] Chapter 3: Software | 67 using a form of cloud computing if you are using Google Drive’s applications. While these are free versions of cloud computing, there is big business in providing applications and data storage over the web. Cloud computing is not limited to web applications. It can also be used for services such as audio or video streaming. Advantages of Cloud Computing • No software to install or upgrades to maintain. • Available from any computer that has access to the Internet. • Can scale to a large number of users easily. • New applications can be up and running very quickly. • Services can be leased for a limited time on an as-needed basis. • Your information is not lost if your hard disk crashes or your
- 71. laptop is lost or stolen. • You are not limited by the available memory or disk space on your computer. Disadvantages of Cloud Computing • Your information is stored on someone else’s computer. • You must have Internet access to use it. • You are relying on a third-party to provide these services. Cloud computing has the ability to really impact how organizations manage technology. For example, why is an IT department needed to purchase, configure, and manage personal computers and software when all that is really needed is an Internet connection? 68 | Information Systems for Business and Beyond (2019) Using a Private Cloud Many organizations are understandably nervous about giving up control of their data and some of their applications by using cloud
- 72. computing. But they also see the value in reducing the need for installing software and adding disk storage to local computers. A solution to this problem lies in the concept of a private cloud. While there are various models of a private cloud, the basic idea is for the cloud service provider to section off web server space for a specific organization. The organization has full control over that server space while still gaining some of the benefits of cloud computing. Virtualization Virtualization is the process of using software to simulate a computer or some other device. For example, using virtualization a single physical computer can perform the functions of several virtual computers, usually referred to as Virtual Machines (VMs). Organizations implement virtual machines in an effort to reduce the number of physical servers needed to provide the necessary
- 73. services to users. This reduction in the number of physical servers also reduces the demand for electricity to run and cool the physical servers. For more detail on how virtualization works, see this informational page from VMWare. Chapter 3: Software | 69 http://www.vmware.com/virtualization/virtualization- basics/how-virtualization-works.html http://www.vmware.com/virtualization/virtualization- basics/how-virtualization-works.html Example program “Hello World” written in Java Software Creation Modern software applications are written using a programming language such as Java, Visual C, C++, Python, etc. A programming language consists of a set of commands
- 74. and syntax that can be organized logically to execute specific functions. Using this language a programmer writes a program (known as source code) that can then be compiled into machine-readable form, the ones and zeroes necessary to be executed by the CPU. Languages such as HTML and Javascript are used to develop web pages. Open-Source Software When the personal computer was first released, computer enthusiasts banded together to build applications and solve problems. These computer enthusiasts were motivated to share any programs they built and solutions to problems they found. This collaboration enabled them to more quickly innovate and fix problems. As software began to become a business, however, this idea of sharing everything fell out of favor with many developers. When a program takes hundreds of hours to develop, it is
- 75. understandable that the programmers do not want to just give it away. This led to a new business model of restrictive software licensing which required payment for software, a model that is still dominant today. This model is sometimes referred to as closed source, as the source code is not made available to others. 70 | Information Systems for Business and Beyond (2019) There are many, however, who feel that software should not be restricted. Just as with those early hobbyists in the 1970s, they feel that innovation and progress can be made much more rapidly if they share what has been learned. In the 1990s, with Internet access connecting more people together, the open-source movement gained steam. Open Office Suite
- 76. Open-source software makes the source code available for anyone to copy and use. For most people having access to the source code of a program does little good since it is challenging to modify existing programming code. However, open-source software is also available in a compiled format that can be downloaded and installed. The open-source movement has led to the development of some of the most used software in the world such as the Firefox browser, the Linux operating system, and the Apache web server. Many businesses are wary of open-source software precisely because the code is available for anyone to see. They feel that this increases the risk of an attack. Others counter that this openness actually decreases the risk because the code is exposed to thousands of programmers who can incorporate code changes to quickly patch vulnerabilities. There are thousands of open-source applications available for
- 77. download. For example, you can get the productivity suite from Chapter 3: Software | 71 Open Office. One good place to search for open-source software is sourceforge.net, where thousands of programs are available for free download. Summary Software gives the instructions that tell the hardware what to do. There are two basic categories of software: operating systems and applications. Operating systems interface with the computer hardware and make system resources available. Application software allows users to accomplish specific tasks such as word processing, presentations, or databases. This group is also referred to as productivity software. An ERP system stores all data in a centralized database that is made accessible to all programs and
- 78. departments across the organization. Cloud computing provides access to software and databases from the Internet via a web browser. Developers use various programming languages to develop software. Study Questions 1. Develop your own definition of software being certain to explain the key terms. 2. What are the primary functions of an operating system? 3. Which of the following are operating systems and which are applications: Microsoft Excel, Google Chrome, iTunes, Windows, Android, Angry Birds. 4. What is your favorite software application? What tasks does it help you accomplish? 72 | Information Systems for Business and Beyond (2019) http://sourceforge.net/ 5. How would you categorize the software that runs on mobile devices? Break down these apps into at least three basic
- 79. categories and give an example of each. 6. What does an ERP system do? 7. What is open-source software? How does it differ from closed- source software? Give an example of each. 8. What does a software license grant to the purchaser of the software? Exercises 1. Find a case study online about the implementation of an ERP system. Was it successful? How long did it take? Does the case study tell you how much money the organization spent? 2. If you were running a small business with limited funds for information technology, would you consider using cloud computing? Find some web-based resources that support your decision. 3. Go to sourceforge.net and review their most downloaded software applications. Report on the variety of applications you find. Then pick one that interests you and report back on what
- 80. it does, the kind of technical support offered, and the user reviews. 4. Review this article on the security risks of open-source software. Write a short analysis giving your opinion on the different risks discussed. 5. List three examples of programming languages? What features in each language makes it useful to developers? Chapter 3: Software | 73 http://sourceforge.net/ http://www.zdnet.com/six-open-source-security-myths- debunked-and-eight-real-challenges-to-consider-7000014225 Lab 1. Download Apache Open Office and create a document. Note: If your computer does not have Java Runtime Environment (JRE) 32-bit (x86) installed, you will need to download it first from this site.Open Office runs only in 32-bit (x86) mode. Here is a link to the Getting Started documentation for Open Office. How does it compare to Microsoft Office? Does the fact that
- 81. you got it for free make it feel less valuable? 1. Statista. (2017). Microsoft – Statistics & Facts. Retrieved from https://www.statista.com/topics/823/microsoft/ 2. Kawasaki, G. (n.d.). The 10/20/30 Rules for PowerPoint. Retrieved from https://guykawasaki.com/the_102030_rule/.↵ 3. Statista. (2018). Number of apps in Apple App Store July 2008 to January 2017. Retrieved from https:https://www.statista.com/ statistics/263795/number-of-available-apps-in-the-apple- app-store/.↵ 74 | Information Systems for Business and Beyond (2019) http://www.openoffice.org/download http://www.oracle.com/technetwork/java/javase/downloads/jre8- downloads-2133155.html http://wiki.openoffice.org/w/images/3/3c/0108GS33- GettingStartedWithBase.pdf Chapter 4: Data and Databases Learning Objectives Upon successful completion of this chapter, you
- 82. will be able to: • Describe the differences between data, information, and knowledge; • Describe why database technology must be used for data resource management; • Define the term database and identify the steps to creating one; • Describe the role of a database management system; • Describe the characteristics of a data warehouse; and • Define data mining and describe its role in an organization. Chapter 4: Data and Databases | 75 Introduction You have already been introduced to the first two components of
- 83. information systems: hardware and software. However, those two components by themselves do not make a computer useful. Imagine if you turned on a computer, started the word processor, but could not save a document. Imagine if you opened a music player but there was no music to play. Imagine opening a web browser but there were no web pages. Without data, hardware and software are not very useful! Data is the third component of an information system. Data, Information, and Knowledge There have been many definitions and theories about data, information, and knowledge. The three terms are often used interchangeably, although they are distinct in nature. We define and illustrate the three terms from the perspective of information systems. 76 | Information Systems for Business and Beyond (2019)
- 84. Data are the raw facts, and may be devoid of context or intent. For example, a sales order of computers is a piece of data. Data can be quantitative or qualitative. Quantitative data is numeric, the result of a measurement, count, or some other mathematical calculation. Qualitative data is descriptive. “Ruby Red,” the color of a 2013 Ford Focus, is an example of qualitative data. A number can be qualitative too: if I tell you my favorite number is 5, that is qualitative data because it is descriptive, not the result of a measurement or mathematical calculation. Information is processed data that possess context, relevance, and purpose. For example, monthly sales calculated from the collected daily sales data for the past year are information. Information typically involves the manipulation of raw data to obtain an indication of magnitude, trends, in patterns in the data for a
- 85. purpose. Knowledge in a certain area is human beliefs or perceptions about relationships among facts or concepts relevant to that area. For example, the conceived relationship between the quality of goods Chapter 4: Data and Databases | 77 and the sales is knowledge. Knowledge can be viewed as information that facilitates action. Once we have put our data into context, aggregated and analyzed it, we can use it to make decisions for our organization. We can say that this consumption of information produces knowledge. This knowledge can be used to make decisions, set policies, and even spark innovation. Explicit knowledge typically refers to knowledge that can be expressed into words or numbers. In contrast, tacit knowledge includes insights and intuitions, and is difficult to transfer to
- 86. another person by means of simple communications. Evidently, when information or explicit knowledge is captured and stored in computer, it would become data if the context or intent is devoid. The final step up the information ladder is the step from knowledge (knowing a lot about a topic) to wisdom. We can say that someone has wisdom when they can combine their knowledge and experience to produce a deeper understanding of a topic. It often takes many years to develop wisdom on a particular topic, and requires patience. Big Data Almost all software programs require data to do anything useful. For example, if you are editing a document in a word processor such as Microsoft Word, the document you are working on is the data. The word-processing software can manipulate the data: create
- 87. a new document, duplicate a document, or modify a document. Some other examples of data are: an MP3 music file, a video file, a spreadsheet, a web page, a social media post, and an e-book. Recently, big data has been capturing the attention of all types of organizations. The term refers to such massively large data sets that conventional data processing technologies do not have sufficient 78 | Information Systems for Business and Beyond (2019) power to analyze them. For example, Walmart must process millions customer transactions every hour across the world. Storing and analyzing that much data is beyond the power of traditional data management tools. Understanding and developing the best tools and techniques to manage and analyze these large data sets are a problem that governments and businesses alike are trying to solve. Databases
- 88. The goal of many information systems is to transform data into information in order to generate knowledge that can be used for decision making. In order to do this, the system must be able to take data, allow the user to put the data into context, and provide tools for aggregation and analysis. A database is designed for just such a purpose. Why Databases? Data is a valuable resource in the organization. However, many people do not know much about database technology, but use non- database tools, such as Excel spreadsheet or Word document, to store and manipulate business data, or use poorly designed databases for business processes. As a result, the data are redundant, inconsistent, inaccurate, and corrupted. For a small data set, the use of non-database tools such as spreadsheet may not cause serious problem. However, for a large organization, corrupted data could lead to serious errors and destructive
- 89. consequences. The common defects in data resources management are explained as follows. (1) No control of redundant data People often keep redundant data for convenience. Redundant Chapter 4: Data and Databases | 79 data could make the data set inconsistent. We use an illustrative example to explain why redundant data are harmful. Suppose the registrar’s office has two separate files that store student data: one is the registered student roster which records all students who have registered and paid the tuition, and the other is student grade roster which records all students who have received grades. As you can see from the two spreadsheets, this data management system has problems. The fact that “Student 4567 is Mary Brown,
- 90. and her major is Finance” is stored more than once. Such occurrences are called data redundancy. Redundant data often make data access convenient, but can be harmful. For example, if Mary Brown changes her name or her major, then all her names and major stored in the system must be changed altogether. For small data systems, such a problem looks trivial. However, when the data system is huge, making changes to all redundant data is difficult if not impossible. As a result of data redundancy, the entire data set can be corrupted. (2) Violation of data integrity Data integrity means consistency among the stored data. We use the above illustrative example to explain the concept of data integrity and how data integrity can be violated if the data system is flawed. You can find that Alex Wilson received a grade in MKT211;
- 91. however, you can’t find Alex Wilson in the student roster. That is, the two rosters are not consistent. Suppose we have a data integrity control to enforce the rules, say, “no student can receive a grade unless she/he has registered and paid tuition”, then such a violation of data integrity can never happen. (3) Relying on human memory to store and to search needed data The third common mistake in data resource management is the 80 | Information Systems for Business and Beyond (2019) over use of human memory for data search. A human can remember what data are stored and where the data are stored, but can also make mistakes. If a piece of data is stored in an un-remembered place, it has actually been lost. As a result of relying on human memory to store and to search needed data, the entire data set eventually becomes disorganized. To avoid the above common flaws in data resource management,
- 92. database technology must be applied. A database is an organized collection of related data. It is an organized collection, because in a database, all data is described and associated with other data. For the purposes of this text, we will only consider computerized databases. Though not good for replacing databases, spreadsheets can be ideal tools for analyzing the data stored in a database. A spreadsheet package can be connected to a specific table or query in a database and used to create charts or perform analysis on that data. Data Models and Relational Databases Databases can be organized in many different ways by using different models. The data model of a database is the logical structure of data items and their relationships. There have been several data models. Since the 1980s, the relational data model has been popularized. Currently, relational database systems are
- 93. commonly used in business organizations with few exceptions. A relational data model is easy to understand and use. In a relational database, data is organized into tables (or relations). Each table has a set of fields which define the structure of the data stored in the table. A record is one instance of a set of fields in a table. To visualize this, think of the records as the rows (or tuple) of the table and the fields as the columns of the table. In the example below, we have a table of student data, with each row representing a student record , and each column representing Chapter 4: Data and Databases | 81 one filed of the student record. A special filed or a combination of fields that determines the unique record is called primary key (or key). A key is usually the unique identification number of
- 94. the records. Rows and columns in a table Designing a Database Suppose a university wants to create a School Database to track data. After interviewing several people, the design team learns that the goal of implementing the system is to give better insight into students’ performance and academic resources. From this, the team decides that the system must keep track of the students, their grades, courses, and classrooms. Using this information, the design team determines that the following tables need to be created: • STUDENT: student name, major, and e-mail. • COURSE: course title, enrollment capacity. • GRADE: this table will correlate STUDENT with COURSE, allowing us to have any given student to enroll multiple courses and to receive a grade for each course.
- 95. • CLASSROOM: classroom location, classroom type, and classroom capacity 82 | Information Systems for Business and Beyond (2019) Now that the design team has determined which tables to create, they need to define the specific data items that each table will hold. This requires identifying the fields that will be in each table. For example, course title would be one of the fields in the COURSE table. Finally, since this will be a relational database, every table should have a field in common with at least one other table (in other words, they should have relationships with each other). A primary key must be selected for each table in a relational database. This key is a unique identifier for each record in the table. For example, in the STUDENT table, it might be possible to use the student name as a way to identify a student. However, it is
- 96. more than likely that some students share the same name. A student’s e-mail address might be a good choice for a primary key, since e- mail addresses are unique. However, a primary key cannot change, so this would mean that if students changed their e-mail address we would have to remove them from the database and then re-insert them – not an attractive proposition. Our solution is to use student ID as the primary key of the STUDENT table. We will also do this for the COURSE table and the CLASSROOM table. This solution is quite common and is the reason you have so many IDs! The primary key of table can be just one field, but can also be a combination of two or more fields. For example, the combination of StudentID and CourseID the GRADE table can be the primary key of the GRADE
- 97. table, which means that a grade is received by a particular student for a specific course. The next step of design of database is to identify and make the relationships between the tables so that you can pull the data together in meaningful ways. A relationship between two tables is implemented by using a foreign key. A foreign key is a field in one table that connects to the primary key data in the original table. For example, ClassroomID in the COURSE table is the foreign key that connects to the primary key ClassroomID in the CLASSROOM table. With this design, not only do we have a way to organize all of the data we need and have successfully related all the table together to Chapter 4: Data and Databases | 83 Tables of the student
- 98. database meet the requirements, but have also prevented invalid data from being entered into the database. You can see the final database design in the figure below: Normalization When designing a database, one important concept to understand is normalization. In simple terms, to normalize a database means to design it in a way that: 1) reduces data redundancy; and 2) ensure data integrity. In the School Database design, the design team worked to achieve these objectives. For example, to track grades, a simple (and wrong) solution might have been to create a Student field in the COURSE table and then just list the names of all of the students there. However, this design would mean that if a student takes two or
- 99. more courses, then his or her data would have to be entered twice or more times. This means the data are redundant. Instead, the designers solved this problem by introducing the GRADE table. In this design, when a student registers into the school system before taking a course, we first must add the student to the STUDENT table, where their ID, name, major, and e-mail address are entered. Now we will add a new entry to denote that the student takes a specific course. This is accomplished by adding a record with the StudentD and the CourseID in the GRADE table. If this student takes a second course, we do not have to duplicate the entry of the student’s name, major, and e-mail; instead, we 84 | Information Systems for Business and Beyond (2019) only need to make another entry in the GRADE table of the second course’s ID and the student’s ID.
- 100. The design of the School database also makes it simple to change the design without major modifications to the existing structure. For example, if the design team were asked to add functionality to the system to track instructors who teach the courses, we could easily accomplish this by adding a PROFESSOR table (similar to the STUDENT table) and then adding a new field to the COURSE table to hold the professors’ ID. Data Types When defining the fields in a database table, we must give each field a data type. For example, the field StudentName is text string, while EnrollmentCapacity is number. Most modern databases allow for several different data types to be stored. Some of the more common data types are listed here: • Text: for storing non-numeric data that is brief, generally
- 101. under 256 characters. The database designer can identify the maximum length of the text. • Number: for storing numbers. There are usually a few different number types that can be selected, depending on how large the largest number will be. • Boolean: a data type with only two possible values, such as 0 or 1, “true” or “false”, “yes” or “no”. • Date/Time: a special form of the number data type that can be interpreted as a number or a time. • Currency: a special form of the number data type that formats all values with a currency indicator and two decimal places. • Paragraph Text: this data type allows for text longer than 256 characters. • Object: this data type allows for the storage of data that cannot Chapter 4: Data and Databases | 85 Open Office Database Management
- 102. System be entered via keyboard, such as an image or a music file. There are two important reasons that we must properly define the data type of a field. First, a data type tells the database what functions can be performed with the data. For example, if we wish to perform mathematical functions with one of the fields, we must be sure to tell the database that the field is a number data type. For example, we can subtract the course capacity from the classroom capacity to find out the number of extra seats available. The second important reason to define data type is so that the proper amount of storage space is allocated for our data. For example, if the StudentName field is defined as a Text(50) data type, this means 50 characters are allocated for each name we want to store. If a student’s name is longer than 50 characters, the database will truncate it.