SlideShare une entreprise Scribd logo
1  sur  82
76
CHAPTER 4
Assessing Health and Health Behaviors
Objectives
this chapter will enable the reader to:
1. Describe the expected outcomes of a nursing health
assessment.
2. Identify the components of a nursing health assessment
conducted for an individual client.
3. Examine life span, language, and culturally appropriate
nursing health assessment tools for children, adults, and older
adults.
4. Compare the similarities and differences among the various
approaches to assessing the family, mindful of cultural
influences.
5. Evaluate the criteria for conducting a screening in the
community.
6. Compare the similarities and differences among the various
approaches to assessing
the community.
Athorough assessment of health and health behaviors is the
foundation for tailoring a health promotion-prevention plan.
Assessment provides the database for making clinical judgments
about the client’s health strengths, health problems, nursing
diagnoses, desired health or behavioral outcomes, as well as the
interventions likely to be effective. This information also forms
the nature of the client–nurse partnership such as the frequency
of con- tact and the need for coordination with other health
professionals. The portfolio of assessment measures depends on
the characteristics of the client, including developmental stage
and cul- tural orientation. The nurse assesses age, language, and
cultural appropriateness of the various measures selected.
Cultural competence is the ability to communicate effectively
with people of different cultures. Providing culturally
competent care is the cornerstone of the nursing assessment.
The nurse’s aware- ness of her own attitude toward cultural
differences and her cultural worldview and characteristics
Chapter4 • AssessingHealthandHealthBehaviors 77
are critical to her understanding and knowledge of various
cultures. Recognizing that diversity exists in all cultures based
on educational level, socioeconomic status, religion, rural/urban
residence, and individual and family characteristics will ensure
a more successful encounter (The Office of Minority Health,
2013). An online cultural educational program, designed
specifically for nurses and featur- ing videotaped case studies
and interactive tools, is available.
The Enhanced National Standards for Culturally and
Linguistically Appropriate Services, based on a definition of
culture expanded to include geography, spirituality, language,
race and ethnicity, and biology, provides a practical guide to
culturally and linguistically sensitive care (The Office of
Minority Health, 2013).
Technology is having a significant impact on health care. The
Electronic Health Record (EHR) promotes involvement of the
client in developing a dynamic, tailored database. The EHR
offers great promise to improve health and increase the client’s
satisfaction with his care. Data aggregation, cross-continuum
coordination, and clinical care plan management are critical
com- ponents of the EHR. It allows storage and almost
instantaneous access to data while improving quality and
efficiency in health care and improving communication among
providers, insurers, and consumers (Figure 4–1).
Promising developments in EHRs are facilitating widespread
usage. Among these are cooperation between health care
providers and technology companies to create standards for
seamless communication, regardless of vendor; cost
subsidization of implementing EHRs to encourage physician
usage; and incentives offered by Centers for Medicare and
Medicaid Services (CMS).
The Health Information Technology for Economic and Clinical
Health (HITECH) Act of 2009 provides incentives to physicians
and hospitals to make “meaningful use” of EHRs by meeting
objectives that positively affect the care of their patients. For
example, one objective states that more than 50% of patients
who request an electronic copy of their health information
should have it within three business days. Clients should be
encouraged to request their elec- tronic health information so
that they know what is in their record and can participate more
fully in their care (CMS.gov, 2009).
Data Aggregation
· Data acquisition and exchange platforms for ADT feeds,
claim,s and clinical data
· Ability to import provider directory files
· Algorithms and analytics for inclusion/exclusion criteria by
population
· Processes, algorithms for patient-provider attribution
Cross-Continuum Coordination
• Shared care plans
• Activity tracking and real-time
notification of encounters (ED, admission, discharge)
• Disease registries
• Health information exchanges
• Enhanced communication aides
for care team connectivity
• Patient outreach and messaging
Clinical Care Plan Management
• EMR, case and utilization management systems
• Workflow automation and rules engines
• Assessment tools, clinical care protocols, and work lists •
Analytics for high-risk patient
identification
• Telehealth and home monitoring capabilities
FIGURE 4–1 IT Support for Care Management Progresses
Beyond EHR Functionality Source: Comstock, J. Asthmapolis,
now Propeller, moves beyond asthma. Mobilhealthnews.
September 10, 2013; Propeller Health, available at
http://propellerhealth.com/, accessed September 25, 2013. The
Advisory Board Company interviews and analysis.
78 Part2 • PlanningforHealthPromotionandPrevention
While there are many benefits of the EMR, there are also
questions to answer about best practices for the successful
implementation of patient-accessible EMRs. These questions
include cost, security, privacy, consumer and provider
education, and user-friendly systems. To over- come some of
the current issues, researchers are investigating tamper-resistant
and portable health folders and evidence-based designs to
evaluate consumer health informatics (Chen, Lu, & Jan, 2012;
Li, Lee, Jian, & Kuo, 2009). In addition, access to web-based
portal links (electronic patient portals) for patients to view and
modify their record encourages adoption by patients.
Doctors who are more willing to open their doctors’ notes via
secure Internet portals, and patients who take advantage of the
opportunity to access them, create transparency between pro-
viders and patients. This ensures more open communications
and shared responsibility for the patient’s health. Most patients
are willing to accept some compromises to privacy in order to
have more access to their health records and to make records
more transparent (Robert Wood Johnson Foundation, 2009).
With the implementation of EMRs, computers are showing up in
more and more health care settings. The introduction of
computers into the examination room potentially is a barrier to
meaningful provider/patient relationships. Health care providers
should face the client while they are entering data, being careful
to maintain eye contact and engagement with the client. To do
otherwise is to focus on the technology, and not the client.
The Personal Health Record (PHR) is a another application to
help consumers take charge of their health and has the potential
to improve care, lower costs, and help clients obtain and
manage the care they need. The PHR belongs to the user and is
distinct from physician records (Figure 4–2).
Insurance Company
· Claims data
· Disease management
profile
· Medications
· Risk score
Data Sources for PHR
Patient
· Chronic condition management data, from patient or connected
devices
· Appointment requests
· Allergies
· Medications
· Family history
· Proxy access, consent data
Personal Health Record
FIGURE 4–2 PHRs: Allowing Patients to Actively Manage
Their Data Company Interviews and Analysis, 2013.
Provider
· Physician visits
· Hospitalizations
· Lab, test results
· Medications
· Pre-visit intake forms
· Reminders, messages
· Billing information
· Referral information
Source: The Advisory Board
Chapter4 • AssessingHealthandHealthBehaviors 79
GPS Device on Inhaler Provides Accurate Information on
Asthma Complications
Inhaler usage automatically tracked, shared with physician
Physician reviews patterns and trends with patient during next
scheduled visit
Physician able to proactively reach out to patient between visits
if usage increases
Passive Tracking Improves Outcomes
80% Increase in medication adherence among users
>66% Proportion of app users who were well-controlled
Case in Brief: Propeller Health
• Health care technology firm based in Madison, Wisconsin
• Attachable GPS device for asthma and COPD inhalers sends
real-time breathing and medication adherence data to provider
FIGURE 4–3 New Technologies Fostering Self-Care Source:
The Advisory Board Company Interviews and Analysis, 2013.
CMS initiated a pilot PHR program in 2009 for clients to add
supplemental information to their health record, authorize
access to third parties such as family members, and track and
view claims. The evaluation of this pilot showed the preferences
of consumers to include download- able data, direct on-line
communication between client and provider, simplified log-ins,
and strong technical support.
Nursing clinics, community health centers, and primary care
centers are using EHRs, PHRs, and/or cell phone technology to
offer comprehensive resources, including easily cus- tomized
and self-managed online portfolios (see Figure 4–3). The
smartphone, named one of the top medical trends for 2013,
increases greatly the option of clients’ involvement in their
health care. Governmental approval of mobile software
applications such as ones that help clients monitor potential
skin cancers, or that provide doctors with a mobile electrocar-
diogram, are being promoted as ways to fight disease and get
health care costs under control (ANA, SmartBrief, 2012).
Social media such as Facebook and Twitter optimize
communications with clients. Tai- lored health information,
delivered through these new informatics interventions, has the
poten- tial for enhancing self-efficacy, improving decision
making, increasing healthy behaviors, and fostering self-care.
The potential for consumers to be involved in the ownership and
mainte- nance of their health record with “cradle-to-grave”
information is especially relevant for com- puter users and
technology-savvy consumers who interface with providers and
health systems. Age, race, and culture are significant
discriminators of computer/Internet home usage, with 65 and
older people’s usage at 29.8% and all other age groups’ usage
ranging from 55.2% to 62.6%. Whites (56.1%) are more likely
to use a home computer to connect to the Internet than Blacks
(41.7%) and Hispanics (35.4%) are. Age is the greatest
influence on the focus of Internet searches; for example,
persons 45 years and older conduct Internet searches about
health care more
80 Part2 • PlanningforHealthPromotionandPrevention
TABLE 4–1
Reported Activity of People Using the Internet, by Selected
Individual Characteristics: 2010 Population age 15 and over
Number in thousands
Percent of those connected to the Internet who engage in each
type of Internet activity
Selected
characteristics the Internet
Take a
course online healthcare services job
Total connected to
Search for
Search about government Search for a
Total 145,286
11.4 35.5 33.2 24.8
13.4 17.6 19.8 31.5 13.5 35.3 34.1 34.3 12.2 38.1 36.4 27.0 10.2
42.8 39.1 19.1
4.3 46.2 34.6 4.0
11.2 36.0 33.2 23.6 11.4 37.0 33.8 23.1 12.0 30.1 30.9 32.3
9.7 27.5 27.8 27.9
10.9 29.6 32.0 25.1 11.8 41.0 34.3 24.5
11.6 36.1 33.4 24.5 8.8 27.1 27.6 26.3 11.5 37.9 37.7 28.6
Age
15–24 years 25–34 years 35–44 years 45–64 years
65 years and over
Race and Hispanic Origin
30,687 27,963 26,471 47,917 12,248
White 119,892 Non-Hispanic 106,947 Black 14,953 Hispanic
14,309 (of any race)
Gender
Male 70,229 Female 75,057
Language spoken at home
Speaks English only at home Speaks Spanish at home Speaks
other language at home
126,776 11,141 7,368
Source: U.S. Department of Commerce. 2010 Census Report
frequently than do those under 45 (Table 4–1; U.S. Department
of Commerce Census, 2012). Non-computer users and
vulnerable populations are at greater risk, which may exacerbate
health disparities unless a safeguard system protects these
groups. Safeguards include developing the concept of health
care partners, opportunities for clients to access a computer, and
staff available to enter information at the client’s request.
Another technology making a significant impact on health care
is telehealth, the use of electronics and telecommunications to
support long-distance care. Health assessment occurs in a
variety of settings including hospitals, clinics, offices,
community centers, schools, and
Chapter4 • AssessingHealthandHealthBehaviors 81
FIGURE 4–4 Telehealth Improves Access to Care Source:
http://www.telehealth.va.gov
homes; and the home is becoming a primary setting for
assessing and delivering health services due in large measure to
telehealth. The Veterans Administration is a major player in
funding, developing, and using telehealth. As technology
improves and cost decreases, telehealth is likely to have an even
greater impact on health care (Figure 4–4). Three points are
spurring adoption of telehealth:
•
Governmentalsupportandintegrationintoaccountablecareorganiza
tions • Consumerdemand
• Technologicalinnovation
NURsING FRAmEwoRks FoR HEALTH AssEssmENT
Health assessment performed by the nurse is a collaborative
partnership with the client that pro- motes mutual input into
decision making and planning to improve the client’s health and
well- being. The initial assessment provides a valuable baseline
to compare subsequent assessments.
The desired outcomes describe the following:
1. Health assets
2. Health problems
3. Health-related lifestyle strengths
4. Key health-related beliefs
5. Health behaviors that put the client at risk 6. Changes that
improve the quality of life
Nursing frameworks are available for nurses to assess and
diagnose health and health behaviors. Nursing assessment is the
systematic collection of data about a client’s health status,
beliefs, and behaviors relevant to developing a health
promotion-prevention plan, whereas nurs- ing diagnosis is the
identification and enhancement of assessment to maximize
health status.
82 Part2 • PlanningforHealthPromotionandPrevention
Nursing diagnostic classification systems (taxonomies)
primarily focus on the individual and aspects of illness. Hence,
positive health states (or strengths) of the individual, family, or
community are not always adequately addressed in these
taxonomies. As health promotion and prevention knowledge
expands, taxonomies continue to include new definitions
supportive of a health promotion/wellness perspective.
The North American Nursing Diagnosis International (NANDA-
I) nursing diagnosis tax- onomy responds to the nine human
response patterns: exchanging, communicating, relating,
valuing, choosing, moving, perceiving, knowing, and feeling
(National Association of Nursing Diagnosis-International,
2013). The defining characteristics of each diagnosis, as well as
related factors and risk factors, provide guidance about the
critical assessment areas for the diagnosis. The NANDA-I
classification provides a way to diagnose and intervene in
selected health promo- tion and wellness processes and
problems across the span of nursing practice (Popkess-Vawter,
2008). For example, stress overload occurs when the client
presents feelings of tension and pres- sure that interfere with
effective decision making, resulting in physical or
psychological distress. Potential interventions, including active
listening and decision-making support, address the stress
overload diagnosis (Lunney, 2008).
Other examples of wellness nursing diagnoses/processes (client
strengths) include the following:
1. Nutrition adequate to meet or maintain body requirements 2.
Exercise level appropriate to maintain wellness state
3. Strength derived from one’s spirituality
Case studies and sample care plans are available to illustrate
how diagnostic statements provide direction for health
promotion-prevention care planning.
Gordon (2009) grouped the NANDA-I diagnoses into 11
functional health patterns to assist in classifying nursing
diagnoses:
1. Health perception–health management 2. Nutritional–
metabolic
3. Elimination
4. Activity–exercise
5. Sleep–rest
6. Cognitive–perceptual
7. Self-perception–self-concept 8. Role–relationship
9. Sexuality–reproductive
10. Coping–stress tolerance 11. Value–belief
Gordon provides guidelines to conduct a nursing history and
examination to assess clients’ functional health patterns. As
assessment proceeds, diagnostic hypotheses generate targeted or
more detailed data collection. Refer to Gordon’s Manual of
Nursing Diagnosis for recommended formats to assess
functional health patterns in infants and young children, adults,
families, and communities (Gordon, 2009).
The Omaha Visiting Nurse Association System is a useful guide
for community health nurs- ing practice, a method of
documentation, and a framework for community management.
The Omaha System incorporates the needs of individuals and
families in the categories of environ- ment, psychosocial,
physiological, and health behavior needs. These categories use
key words such
Chapter4 • AssessingHealthandHealthBehaviors 83
as individual, family, or health promotion in the individual and
family categories. Nurse research- ers have shown the
usefulness of the Omaha System in quantifying nursing practice
in community health, rural nursing practice, primary care, and
wellness centers. A difficulty in developing nurs- ing
classification systems for communities is that nursing
diagnoses/problem classifications focus on nursing practice,
whereas community problems focus more on interdisciplinary
practice.
Nursing Interventions Classification (NIC), a system that
generates standardized nursing actions and interventions for
providing care, is relevant for community health because
nursing services are categorized and linked to direct
reimbursement (Bulechek, Butcher, Dochterman, & Wagner,
2013). However, NIC does not have categories for the health
behaviors of communities. The Nursing Outcomes Classification
(NOC) system measures the responses of an individual, family,
and community behavior/perception to a nursing intervention
and is useful in all settings with individuals, families, and
communities (Moorhead, Johnson, Maas, & Swanson, 2013).
The next phase of knowledge generation in nursing is the
integration of terminologies into EHR information systems to
support standards of care across settings worldwide. Integration
will make it easier to describe and share interventions that work
or do not work to help people be healthy and reduce costs.
Research using data from information systems embedded with
nursing standards and terminology builds nursing knowledge
and documents the contribution of nursing to health care.
GUIdELINEs FoR PREvENTIvE sERvIcEs ANd scREENINGs
An increasing emphasis on the prevention of disease has
resulted in the development of varying sets of guidelines for the
delivery of preventive services to individuals, families, and
communities across the life span. These guidelines focus on
clinical care directed toward prevention of specific diseases
such as HIV disease and behavioral morbidity such as substance
abuse.
The Guide to Clinical Preventive Services (U.S. Preventive
Services Task Force, 2012) is an authoritative source for
making decisions about preventive services. In 2009, the U.S.
Preventive Services Task Force (USPSTF) recommended
limiting the use of screening mammography. The
recommendation garnered the media’s attention and, according
to one study, the percentage of women screened the year
following the recommendation declined by 4.3%, suggesting
that the recommendation had a chilling effect on the willingness
of women to get mammograms. How- ever, Block and
colleagues examined data from the Behavioral Risk Factor
Surveillance Study and observed no change in rates among
women who had mammograms the previous year, but did
observe lower rates of mammogram use among women who
reported no mammogram in the previous year (Block, 2013).
Other experts report 1.3 million overdiagnosed breast cancers
over 30 years, meaning that their screening detected tumors that
would never lead to clinical symptoms (Bleyer & Welsh, 2012).
However, the American Cancer Society and the American
Radiology Association continue to recommend that women
undergo a yearly mammogram beginning at age 40.
Screening is not right for everyone or every health problem.
Screenings to detect particular, unrecognized health problems in
individuals who are members of at-risk groups reduce false
alarms. However, data are not sufficient to address all the
uncertainties of general screenings.
Screenings uncover health problems in an efficient and
economically feasible manner when the following factors are
present:
1. The specific population has a high prevalence of the disease
or health problem. 2. Treatment is available if the condition is
identified.
3. Screening instruments are valid and reliable.
84 Part2 • PlanningforHealthPromotionandPrevention
The cost of conducting screenings bears on the decision to offer
large-scale screenings. For example, conducting a screening to
detect osteoporosis requires special equipment, and the cost
may be high due to the number of machines needed to screen in
a timely, efficient manner. In addition to cost, targeted
screenings should consider race/ethnicity, age, and low income
and how these factors relate to increased or decreased
willingness to participate in screenings, along with the risks and
benefits (Kressin, Manze, Russell, Katz, Claudio, Green, &
Wang, 2010).
Elective Preventive Services Selector (ePSS) is a quick, hands-
on tool available to pri- mary care providers to identify
screening services that are appropriate for particular clients
based on the recommendations of the U.S. Preventive Services
Task Force, and can be searched by client characteristics, such
as age, sex, and behavioral risk factors. ePSS is available as
Web and Mobile applications for the iPhone, iPad, and other
mobile devices. Through these appli- cation nurses and other
clinicians have preventive information—recommendations,
clinical considerations, and selected practice tools—available at
the point of care (U.S. Preventive Ser- vices Task Force, 2012).
Guide to Clinical Preventive Services (U.S. Department of
Commerce Census, 2012) and Bright Futures: Guidelines for
Health Supervision of Infants, Children, and Adolescents
(Hagan, Shaw, & Duncan, 2008) also are important guidelines
for nurses to be familiar with and use to ensure that clients
across the life span benefit from state-of-the-art preventive
services.
AssEssmENT oF THE INdIvIdUAL cLIENT
Assessment of the individual client in the context of health
promotion extends beyond physical assessment to include a
comprehensive examination of other health parameters and
health behaviors. The purpose of the assessment, setting,
culture, and age determine the components of health assessment.
The components are as follows:
• Functionalhealthpatterns • Physicalfitness
• Nutrition
• Lifestress
• Spiritualhealth
• Socialsupportsystems
• Healthbeliefsandlifestyle
Functional assessment of health patterns comprises a health
history, including hereditary and family characteristics, and
physical assessment. Assessment components focus on individu-
als and have particular relevance for health promotion and
prevention.
Physical Fitness
Physical activity is an important part of personal health status
(see Chapter 6). Determining one’s level of physical fitness is a
critical part of the nursing assessment. A sedentary lifestyle, for
many individuals, begins early in childhood and continues into
adulthood. The assess- ment is applicable to clients of all ages,
with restrictions on some components for physically
compromised individuals. Skill-related physical fitness and
health-related physical fitness focus on different qualities.
Skill-related fitness focuses on qualities that contribute to
successful athletic performance: agility, speed, power, and
reaction time. Health-related fitness focuses on qualities that
contribute
Chapter4 • AssessingHealthandHealthBehaviors 85 to general
health and include cardio-respiratory endurance (aerobic
capacity); muscular endur-
ance, strength, and flexibility; and body composition.
cARdIo-REsPIRAToRy (cR) ENdURANcE (AERoBIc
cAPAcITy). Aerobic capacity is the most important component
of fitness. Fitness reflects the ability of the CR system to
efficiently adjust to and recover from exercise. Research shows
that individuals with an acceptable aerobic capacity have a
reduced risk of obesity, diabetes, high blood pressure, and other
health problems.
mUscULAR ENdURANcE, sTRENGTH, ANd FLExIBILITy.
The goal of muscular endurance, strength, and flexibility tests
is to determine the functional health status of the
musculoskeletal system. It is important to have strong muscles
that maintain body structure and endurance. The strength and
endurance of the upper body muscles are good indicators of
overall fitness. Flexibil- ity, the ability to move muscles and
joints through their maximum range of motion, also is an
important component of physical fitness. Flexibility decreases
with age and chronic illness. The lack of ability to flex or
extend muscles or joints often reflects poor health habits, such
as seden- tary lifestyle, poor posture, or faulty body mechanics.
Loss of flexibility greatly decreases one’s ability to move about
with ease and comfort.
Body comPosITIoN. The increased prevalence of overweight
and obesity in children and adults in the United States is a
concern for both the public and private sectors. The availability
of high-fat and low-cost fast foods and the decline in levels of
physical activity contribute to these trends. Increased levels of
body fat are associated with cardiovascular disease, diabetes,
and stroke in adults; and diabetes, hypertension, and increased
cholesterol levels occur more frequently in overweight and
obese children.
Estimates of body fat include underwater weighing,
bioelectrical impedance, skin fold measures, and other
anthropometry measures such as the Body Mass Index (BMI).
Each method has limitations leading to measurement errors of
2% to 3% for estimates of body fat, with the BMI error rate as
great as 6% because body weight includes bone and muscle
mass and not just fat composition.
Bioelectrical impedance analysis (BIA) provides a measure of
body fat when a small, safe electrical current passes through the
body, carried by water and electrolytes of the fluid spaces.
Impedance is greatest in fat tissue, which contains only 10 to
20% water, while muscle tissue, which contains 70 to 75%
water, allows the signal to pass more easily. Height and weight,
body type, gender, age, fitness level, and BIA are measures
used to calculate percentage of body fat, muscle mass, and
hydration level (American College of Sports Medicine, 2009).
BIA is useful in healthy, young, normally hydrated teens and
adults, and for monitoring these groups for changes in body fat
composition over time. Body fat scales (similar to bathroom
scales) and handheld body fat analyzers, both available at
reasonable cost, also provide a measure of BIA. While
technology is improving, it is difficult to get an accurate body
fat composition from commercially available body fat analyzers.
Anthropometric (measures of body fat) methods are simple,
convenient, and inexpensive. Skin fold estimates, conducted
while maintaining standards and using high-quality skin fold
calipers, provide an accurate measure of body fat and compare
favorably with bioelectrical impedance. The combination of
weight, anthropometric methods, and BIA is an excellent
predic- tor of total body fat composition.
A physical fitness assessment is an essential component of
health assessment. Careful atten- tion to assessment will
optimize the fit of the exercise prescription to the physical
capabilities of
86 Part2 • PlanningforHealthPromotionandPrevention
the client. The Presidential Youth Fitness Program adopted
FITNESSGRAM, a research-based assessment developed by the
nonprofit Cooper’s Institute, and recommends implementation
in all public schools. The FITNESSGRAM program assesses
cardiovascular fitness, body composi- tion, muscle strength,
muscular endurance, and flexibility in children 4 to 17 years of
age. The American College of Sports Medicine (ACSM)
Resource Manual for Guidelines for Exercise Testing and
Prescription (American College of Sports Medicine, 2013) is an
excellent guide for physical fitness assessment tools for adults.
Nutrition
Good nutrition is one of the primary determinants of good
health. Effective planning for health promotion requires an
assessment of the nutritional status of the client to establish a
baseline. Anthropometrical measurements and/or BIA analysis,
laboratory values, and dietary history are useful assessment
tools.
Anthropometrics assessment measures include height and
weight, circumference of various areas of the body, and skin-
fold thickness. BMI is the best method to assess healthy weight
(American College of Sports Medicine, 2013). BMI does not
assess body fat composi- tion or fat distribution, but it is a
useful screening tool for overweight or obesity. It has been
determined that childhood BMI is associated with adult
adiposity. The classification of over- weight and obesity by
BMI, waist circumference, and associated disease risks
standards for adults is available in Table 4–2.
Healthy and unhealthy weight guidelines are in Table 4–3. The
waist-to-hip ratio assesses the amount of fat distributed in the
abdomen versus fat distributed below the waist. The ratio is the
waist circumference over the hip circumference. The higher the
value of the waist-to-hip ratio, the greater the potential that
health problems are present or will occur (American College of
Sports Medicine, 2013; WHO Expert Consultation, 2008).
Biochemical analyses of blood and urine help to identify
nutritional deficiencies. In addi- tion to laboratory tests for
cholesterol, triglycerides, glucose, and high-density
lipoproteins, tests for protein (creatinine index, serum protein,
serum albumin, total lymphocyte count, blood urea nitrogen,
uric acid), serum or plasma vitamin levels (water-soluble, fat-
soluble), and minerals (calcium, sodium, potassium, iron,
phosphorus, magnesium) are used to assess
TABLE 4–2
Normal† Overweight Obesity
Classification of Overweight and Obesity by BMI, Waist
Circumference, and Associated Disease Risk*
Disease Risk* Relative to Normal Weight and Waist
Circumference
BMI (kg/m2)
18.5–24.9
25.0–29.9 30.0–or above
Men $ 40 in. Women $ 35 in.
—
Increased High
Men . 40 in. Women . 35 in.
—
High Very High
*Disease risk for type 2 diabetes, hypertension, and CVD.
†Increased waist circumference can also be a marker for
increased risk even in persons of normal weight.
Source: Adapted from Preventing and Managing the Global
Epidemic of Obesity. Report of the World Health Organization
Consultation of Obesity. WHO, Geneva, June 1997.
http://www.nhlbi.nih.gov/guidelines/obesity/e_txtbk/txgd/411.ht
m
Chapter4 • AssessingHealthandHealthBehaviors 87 TABLE 4–3
Healthy and Unhealthy Weight Guidelines
Are you at a healthy weight? Height*
BMI
18.5
25
30
6' 6"
6' 5" 6' 4" 6' 3" 6' 2" 6' 1" 6' 0"
5' 11" 5' 10" 5' 9" 5' 8" 5' 7" 5' 6" 5' 5" 5' 4" 5' 3" 5' 2" 5' 1" 5'
0" 4' 11" 4' 10"
50 75
100 125 150
Overweight Obesity
175
200 225 250
Pounds† Healthy Weight
* Without shoes.
275 † Without clothes.
The BMI (weight-for-height) ranges shown are for adults. They
are not exact ranges of healthy and unhealthy weights.
However, they show that health risk increases at higher levels
of overweight and obesity. Even within the healthy BMI range,
weight gains can carry health risks for adults.
Directions: Find your weight on the bottom of the graph. Go
straight up from that point until you come to the line that
matches your height. Then look to find your weight group.
BMI of 24.9 defines the upper boundary of healthy weight. BMI
of 25 to 29.9 defines overweight.
BMI of 30 or higher defines obesity.
Source: Report of the Dietary Guidelines Advisory Committee
on the Dietary Guidelines for Americans. (2000). http://
www.cnpp.usda.gov/Publications/DietaryGuidelines/2000/2000
DGCommitteeReport.pdf, p. 11.
nutritional status. Three particularly important values in
assessing nutritional status are serum albumin less than 3.5
g/dL, total lymphocyte count less than 1800/mm3, and an
involuntary loss of body weight greater than 15%. These three
indicators correlate significantly with nutri- tional status (Gupta
& Lis, 2010; Nishida & Sakakibara, 2010).
The dietary diary, available as either a paper or Web-based
option, is one common measure used to assess nutritional status.
SuperTracker, a diet planning and tracker tool is a Web-based
dietary assessment that is easy to access and use. It incorporates
both the 2010 Dietary Guidelines for Americans and the 2008
Physical Activity Guidelines. After the client, or nurse, enters
the
88 Part2 • PlanningforHealthPromotionandPrevention
requested dietary information, the results are a part of a tailored
nutrition plan that empowers the client to make healthier food
choices. ChooseMyPlate also has a Spanish-language food icon
MiPlato to guide Spanish-speaking consumers in making
healthy food choices.
With the paper option dietary diary, clients keep a record of
everything eaten for three days during the week prior to their
office or home visit. Daily food choices, compared with
published daily food guides or a computerized dietary analysis
package, identify unusual or poor dietary patterns (see Nutrition
and Health Promotion, Chapter 7). The nurse and nutritionist
work together to prepare materials and/or recommend websites
to ensure that the client has the latest and most accurate
research findings about nutritional supplements, including
vitamins and min- erals (calcium, iron) as well as proteins and
complex carbohydrates. Tools for assessing nutrition in primary
care settings are available.
Culture and socioeconomic level influences eating patterns,
obesity, and malnutrition. Assessment of nutritional status and
dietary habits is a critical part of comprehensive health
assessment for individuals, families, and specific target groups,
such as high-school students, pregnant women, and the elderly.
An analysis of assessment data determines which interventions
are most appropriate to improve the nutritional status of the
client/family. Understanding cul- tural influences on nutrition
and dietary patterns is essential in both assessment and
intervention to affect change.
Life stress
Stress is a potential threat to mental health and physical well-
being and is associated with ill- nesses such as cardiovascular
disease, cancer, and gastrointestinal disorders, as well as
depres- sion, poor sleep patterns, and inability to carry out daily
activities at an effective level. Life stress is a part of a
comprehensive health assessment. Assessment begins with
helping the cli- ent identify sources of stress. One strategy is to
have the client write down the issues, con- cerns, and
challenges that trigger stress responses in his or her life. Some
of the stressors will be internal, and others will be external
events. External stressors are events and situations that happen
to individuals.
Examples of external stressors include the following:
1. Some events may be happy ones such as marriage, birth of a
child, and a new home, while some may be negative, such as
death of a loved one, loss of a job, and an unplanned preg-
nancy. Stress results from both positive and negative events.
2. The interaction between the individual and the environment
involves subjective perception and assessment of stressors.
Common events—such as a barking dog, a crying baby, and
extreme weather conditions—may cause stress.
3. Much of life is unpredictable, and one’s personality
influences responses to change and unplanned-for events.
Unpredictable events include dealing with unexpected house
guests, increased rent, or a sick child.
4. Family stressors include conflicts and arguments between
children and spouses, issues resulting from the health problems
of family members, and multigenerational households.
5. Common stressors in the workplace include long working
hours, difficult coworkers, and
urgent deadlines.
6. Social stressors include commitments to family, friends, and
organizations balanced with
the need for downtime for oneself, and pressure from peers.
Internal stressors are self-induced thoughts and feelings that
lead to unrest and anxiety.
Chapter4 • AssessingHealthandHealthBehaviors 89 Examples of
internal stressors include the following:
1. Common fears such as flying, heights, and public speaking.
2. The inability to predict behaviors such as use of alcohol and
not knowing the outcome of
medical tests.
3. Attitudes and expectations exhibited toward job loss or
unexpected guests.
Despite the high prevalence of stress-related health problems,
including substance abuse,
primary care providers screen too few clients for these
problems. Regular screenings enable ear- lier identification of
problems and earlier treatment. Screening tools include the
following:
sTREss scALEs. Assessing a person’s vulnerability to stress and
strength to cope provides an essential measure of mental and
physical well-being. The Derogatis Stress Profile (Derogatis &
Lazarus, 1997) assesses personal and professional stress in
adolescents and adults. The Perceived Stress Scale (Cohen,
Kessler, & Gordon, 1997) measures moods and feelings about
life stressors and is considered a measure of global stress.
HAssLEs ANd UPLIFTs. Hassles are the irritating, frustrating,
distressing demands such as traffic jams, losing items, and
arguments that characterize everyday life. Uplifts, the
counterpart of hassles, are the positive experiences or joys of
life, such as getting a good night’s rest, receiving an email from
a friend, or spending time with a pet. The assessment of daily
hassles and uplifts is a better predictor of health or illness than
the usual assessment of life events. An example of a hassles and
uplifts scale is the Adolescent Hassle Scale (AHS; Wright,
Creed, & Zimmer-Gembeck, 2010).
ANxIETy INvENToRy. Anxiety level is a part of the life-stress
review. The State-Trait Anxiety Inventory consists of 20 items
that assess the extent of anxiety one feels at that moment (state
anxiety) and 20 items that assess how one generally feels (trait
anxiety; Spielberger, Gorsuch, Lushene, & Vagg, 1983). A
State-Trait Anxiety Inventory is available for children (“How I
Feel Questionnaire”; Spielberger et al., 1983). Both instruments
and administration manuals are avail- able from Mind Garden,
Palo Alto, California.
sTREss wARNING sIGNALs INvENToRy. Clients should
understand and be aware of the symptoms of an elevated stress
level. When clients are aware of their own stress signals, they
can use stress-management techniques (see Chapter 8) more
effectively. Symptoms of stress may be physical, behavioral,
emotional, or cognitive as shown in Figure 4–5.
coPING mEAsUREs. Coping is an individual’s ongoing efforts
to manage specific internal and external demands that exceed
personal resources. A commonly used tool to measure coping is
the Ways of Coping Questionnaire developed by Folkman and
Lazarus (1988). The scale mea- sures both the emotion- and
problem-focused coping strategies an individual uses when
respond- ing to a stress situation. The Schoolager’s Coping
Strategies Inventory is used to measure the type, frequency, and
effectiveness of children’s stress-coping strategies, and
additional instruments to measure stressors in children are
available [Ryan-Wenger, Wilson (Sharrer), & Broussard, 2012].
The Patient Health Questionnaire (PHQ-2) is a two item-
screening test that consists of the first two questions of the
Patient Health Questionnaire (PHQ-9) tool to assist providers
with diagnosing depression. The client that answers positively
to one or both of the two items (PHQ-2) then answers the
remainder of the seven items on the PHQ-9 (Li, Friedman,
Conwell, & Fiscella, 2007). The PHQ-2 is effective in screening
large groups to detect undiagnosed depression in a variety of
populations.
90 Part2 • PlanningforHealthPromotionandPrevention
Headaches Indigestion Stomachaches Sweaty palms Sleep
difficulties Dizziness
Excess smoking
Bossiness
Compulsive gum chewing Attitude critical of others
BEHAVIORAL SYMPTOMS
EMOTIONAL SYMPTOMS
Back pain
Tight neck, shoulders Racing heart Restlessness Tiredness
Ringing in ears
Grinding of teeth at night Overuse of alcohol Compulsive eating
Inability to get things done
Overwhelming sense of pressure Anger
Loneliness
Unhappiness for no reason Easily upset
Inability to make decisions Thoughts of running away Constant
worry
Loss of sense of humor
Stress Warning Signals PHYSICAL SYMPTOMS
Crying
Nervousness, anxiety
Boredom—no meaning to things Edginess—ready to explode
Feeling powerless to change things
Trouble thinking clearly Forgetfulness
Lack of creativity Memory loss
COGNITIVE SYMPTOMS
Do any seem familiar to you?
Check the ones you experience when under stress. These are
your stress warning signs.
Are there any additional stress warning signals that you
experience that are not listed? If so, add them here.
FIGURE 4–5 Stress Warning Signals Source: From Benson, H.,
& Stuart, E. M. 1992. The Wellness Book. New York, NY:
Citadel Press/Kensington Publishing Corp. All rights reserved.
Reprinted by arrangement with Citadel Press/Kensington
Publishing Corp.
See Instruments for Clinical Healthcare Research (Frank-
Stromborg, 2004) for a review of instruments on stress, coping,
and anxiety and the relevance of each measure to nursing.
spiritual Health
Spiritual health is the ability to develop one’s inner being to its
fullest potential. Spiritual health includes the ability to discover
and articulate one’s basic purpose in life; to learn how to
experience love, joy, peace, and fulfillment; and to help oneself
and others achieve their fullest potential.
Chapter4 • AssessingHealthandHealthBehaviors 91
The assessment of spiritual health is critical in a holistic
approach to health as spiritual beliefs affect a client’s
interpretations of life events and health. Acquiring a better
understanding of clients’ spiritual needs will enable health care
providers to develop tailored and effective spiritual
interventions (Monod, Rochat, Bula, & Spencer, 2010).
Examples of spirituality measures include the following:
· The Spiritual Needs Assessment for Patients (SNAP) is a 23-
item multidimensional survey instrument to describe and
measure spiritual needs (Galek, Flannelly, Vane, & Galek,
2012).
· The Spiritual Involvement and Beliefs Scale (SIBR) measures
actions as well as beliefs across religious traditions (Litwinczuk
& Groh, 2007). This instrument and the previous one provide
supportive data for understanding the client’s spiritual beliefs
and their impact on health needs and care.
· The Spiritual Perspective Scale (SPS) is a 10-item instrument
that measures one’s percep- tions of the extent to which one’s
spiritual beliefs and one’s daily interactions are consistent
(Chung, Wong, & Chan, 2007).
Additional measures are available in Instruments in Clinical
Healthcare Research (Frank-Stromborg, 2004).
social support systems
Two approaches for reviewing the social support networks of
clients are useful in providing the client and nurse increased
insight into existing support resources. When assessing the
adequacy of support systems, it is important to be cognizant of
factors that may cause the assessments to vary. Such things as
the client’s culture, age, social context (school, home, work),
and role context (parent, student, professional) influence
perceived and received support. Using the Internet to expand
one’s social contacts is increasing in popularity and can be
included in assessing the cli- ent’s social support system.
Definitive measures for assessing social support are abundant in
the literature. They can also be found on educational websites,
such as Stanford University.
sUPPoRT sysTEms REvIEw. One straightforward, useful
approach to assess support systems is to ask the client to list
individuals who provide informational, emotional, appraisal, or
instru- mental support. Then ask the client to indicate the
relationship with the persons listed. Next, identify persons who
have been sources of support for five years or more. This list
enables the client to become aware of the stability of personal
support systems. Last, identify the frequency and types of
contacts. These may be face-to-face or telephone and e-mail
communication. Exam- ining the social network enables the
client and the nurse to assess the adequacy of support. If it is
inadequate, generate strategies to enhance existing social
networks. Figure 4–6 shows a sample of a completed support
system review.
After reviewing the client’s social support systems, explore the
following questions:
•
Inwhatareasdoyouneedmoresupport:informational,emotional,inst
rumental,appraisal? •
Whowithinyourpresentsupportsystemmightprovidetheneededsup
port?
• Whoelsedoyouthinkneedstobecomeapartofyoursupportsystem?
•
Whatcanyoudotoaddthepeopleyoubelieveyouneedtoyoursupports
ystem?
Answers to these questions suggest actions the client can take to
expand sources of per- sonal support.
92 Part2 • PlanningforHealthPromotionandPrevention
List individuals who provide support to you. Next indicate the
following relationships: Family member (FM); Fellow worker
(FM); or Social Acquaintance (A). Frequency of Contact: Daily
(D); Weekly (W); Monthly (M); or Rarely (R). Types of
Contact: Face-to- Face (F); Telephone (T); or Email (EM). If
individual has been supportive for 5 years
or more, place the number 5. Individual Relationship
Frequency Type D F D F D F W T
Time 5
5
5
5
-
-
5
-
5
John FM (husband)
Peter FM (son)
Helen FM (daughter)
Ted FM (father)
Andrew FW D F
Frances FW Rose FW Elsa A Jack A
W F W T M E M E
Ask the client to identify the type of support provided by
individuals in the list. They may provide more than one type of
support.
Sources of Emotional Support
FAMILY WORK John Frances Peter Rose Helen Andrew Ted
SOCIAL GROUP Elsa
Jack
Sources of Instrument Support
FAMILY WORK SOCIAL GROUP John Andrew Jack
Ted
Sources of Information Support
FAMILY WORK SOCIAL GROUP
John Andrew Ted Rose
Jack
Sources of Appraisal Support
FAMILY WORK SOCIAL GROUP John Rose Elsa
FIGURE 4–6 Support System Review: Social Network and Type
of Support
EmoTIoNAL sUPPoRT dIAGRAm. Diagrams are effective ways
to assess the strength and sources of support. Figure 4–7
presents a sample emotional support diagram that indicates
strong, moderate, and weak sources of support, as well as
current conflicts with supportive indi- viduals. The length of
each line indicates geographical proximity to the client. This
approach is particularly appropriate for clients who need a
visual presentation of their emotional support system to take
action to sustain or enhance emotionally satisfying
relationships.
An integral part of the assessment is a review of sources of
social support. A review enables the client to recognize current
sources of support and identify barriers in social rela- tionships
that may block desirable health actions. The nurse must always
be alert to client
Chapter4 • AssessingHealthandHealthBehaviors 93
FIGURE 4–7 Emotional Support Diagram for Client
situations in which social support is minimal or nonexistent.
Extensive review of support systems may cause anxiety and
depression, and in this case, a more informal, nonthreatening
approach is useful.
Social support instruments represent the broad spectrum of
measures used in clinical settings as well as research. The
Social Support Questionnaire is a six-item measure of per-
ceived social support and satisfaction with social support. Each
item presents a specific sce- nario for which respondents list the
people who would be available for support in that situation.
Respondents are also asked to rate their satisfaction with the
support available (Sarason, Shearin, Pierce, & Sarason, 1987).
Lifestyle Assessment
In the context of health, lifestyle defines discretionary activities
that are a regular part of one’s daily pattern of living and
significantly influences health status. Health-promoting
behavior is an expression of the human actualizing tendency
that optimizes well-being, personal fulfill- ment, and productive
living. The 52-item Health-Promoting Lifestyle Profile II
(HPLP-II), a revision of the original instrument, consists of six
subscales to measure major components of a health promoting
lifestyle: health responsibility, physical activity, nutrition,
interpersonal rela- tions, spiritual growth, and stress
management. Scores are obtained for each subscale, or a total
scale score is calculated to measure overall health-promoting
lifestyle (Sechrist, Walker,
94 Part2 • PlanningforHealthPromotionandPrevention
TABLE 4–4 Health-Promoting Lifestyle Profile II: Subscales
and Sample Subscale Items
Subscale
Health responsibility Physical activity
Nutrition Interpersonal relations Spiritual growth Stress
management
Sample Item
Read or watch TV programs about improving my health.
Question health professionals in order to understand their
instructions.
Exercise vigorously for 20 or more minutes at least three times
a week (brisk walking, bicycling, aerobic dancing, using a stair
climber).
Get exercise during usual day activities (such as walking during
lunch, using stairs instead of elevators, parking car farther away
from destination and walking).
Choose a diet low in fat, saturated fat, and cholesterol.
Eat 2 to 4 servings of fruit each day.
Spend time with close friends.
Settle conflicts with others through discussion and compromise.
Feel connected with some force greater than myself.
Am aware of what is important to me in life. Take some time for
relaxation each day.
Pace myself to prevent fatigue.
Pender, & Frank-Stromborg, 1987). The HPLP-II provides
important information about a client’s lifestyle. Sample items
for each of the subscales appear in Table 4–4. A HPLP-II
profile provides information to develop an individualized health
promotion plan that identifies life- style strengths and resources
as well as areas for further growth. A Spanish-language version
of the HPLPII is available. The Adolescent Lifestyle Profile
(ALP) measures seven domains of health-promoting lifestyle
(Hendricks, Murdaugh, & Pender, 2006) and is useful for
measuring health-promoting behaviors in adolescents.
Additional lifestyle instruments are available at educational
websites, including Stanford University.
sTAGE oF cHANGE AssEssmENT. Clients may be at one of
several stages in relation to any given behavior change. Table
4–5 shows the stages of change for positive health behaviors.
Recognizing the different stages of change in relation to various
health behaviors allows for more tailored interventions.
TABLE 4–5 True–False Statements for Assessing Stages of
Behavior Change
1. I currently do not (specify exact behavior, e.g., exercise 30
minutes three times a week, eat 2 to 4 servings of fruit daily)
and do not intend to start in the next 6 months.
(Precontemplation)
2. I currently do not (specify behavior), but I am thinking about
starting to do so in the next
6 months. (Contemplation)
3. I have tried several times to (specify behavior) but am
seriously thinking of trying again in the
next month. (Planning)
4. I have (specify behavior) regularly for less than 6 months.
(Action)
5. I have (specify behavior) regularly for more than 6 months.
(Maintenance)
AssEssmENT oF THE FAmILy
The contemporary family and the reciprocal influence of family
health on individual family members reconfirm the family as the
primary social structure for health promotion. Health-
promoting as well as health-damaging behaviors and lifestyles
learned and reinforced within the context of the family are
powerful mediating factors in determining how individual
members cope with health concerns and challenges. The
family—the logical unit of assessment—has the primary
responsibility for the following:
1. Developing self-care and dependent-care competencies of its
members
2. Fostering resilience of family members to include shared
values and shared goals
3. Providing social and physical resources to the family group
4. Promoting healthy individuals while maintaining family
cohesion (Peace & Lutz, 2009)
Although women generally carry the major responsibility for
health decision making and health education for the family, the
task of fostering health and healthy behaviors should be
“mainstreamed” as an integral part of family functioning. The
milieu for health promotion is likely to differ significantly
across families, depending on their composition, structure,
socioeconomic status, living environment, culture and cultural
context, and family history. A family history is a window on the
individual family members’ health and an invaluable insight
into the risk of inheriting specific diseases, shared
environmental factors, and individual health concerns. My
Family Health Portrait is an example of an Internet-based
family health tool that takes about 20 minutes to complete
online, or the form is available to download. The nurse may
need to print a copy for the family if the family does not have
access to a computer or the skills to access the form. The
program assembles the information and builds a family tree.
Families can share the information with other family members
and enter it into the PHR. As noted by Peace and Lutz (2009),
the limitation of this traditional family history representa- tion
is evident when applied to diverse families. Genopro is a free
(with some restrictions) commercial application for drawing
genograms and is more useful in assessing nontraditional family
units.
Healthy family traits and family strengths have many different
modes of expression. One- parent families, blended families,
unmarried parents with children, and gay and lesbian fami- lies
are examples of the wide variation among families. Variations
produced by transitions in family life influence the family
assessment as well. Approaches to family assessment are pre-
sented below.
A systems approach to family assessment includes five
assessment categories: (1) individual members, (2) subsystems
(developmental, biological, psychological, social
characteristics), (3) interactional patterns (relationships,
communication patterns, roles, and attachment patterns), (4)
family processing, and (5) change or adaptive abilities
(Kaakinen, Gedaly-Duff, Hanson, & Coehlo, 2009).
Three categories of processes underlie a systems model of
family assessment: (1) those that regulate exchanges with the
environment, (2) processes designed to prevent an overload of
the system, and (3) internal processes that regulate the family’s
ability to adapt and change (Clark, 2007). Assessment based on
systems theory provides insight about the internal pro- cesses of
the family as well as the relationship of the family to the
environment and larger social system.
Family decision-making patterns in relation to health identify
power structure and health care function. In a structural-
functional approach to family assessment, the family is a system
Chapter4 • AssessingHealthandHealthBehaviors 95
96 Part2 • PlanningforHealthPromotionandPrevention
with communication patterns, power structure, role structure,
family values, affective function, socialization patterns, health
care function, family stress, coping, and adaptation
mechanisms. Family functional assessment dichotomizes
instrumental functioning and expressive function- ing.
Instrumental functioning refers to the routine activities of
everyday living, while expressive functioning connotes
emotional communication, verbal communication, nonverbal
communica- tion, circular communication, problem solving,
roles, control, beliefs, alliances, and coalitions (Melesis, 2012;
Kaakinen, Gedaly-Duff, Hanson, & Coehlo, 2009).
The Calgary Family Assessment Model is adapted for nurses to
assess families (Wright & Leahey, 2009). This model consists
of family structural assessment, family developmental
assessment, and family functional assessment. In structural
assessment, the family’s internal structure includes family
composition, rank order, subsystem, and boundary; components
of the external structure are culture, religion, socioeconomic
level, mobility, environment, and extended family.
To assess family development, the Calgary model reviews the
current stage of the family in relation to family developmental
history. Family development focuses primarily on the tradi-
tional family developmental cycle, but it also includes
assessment of alterations in the family developmental life cycle
brought about by separation, divorce, death, single parenthood,
and remarriage.
A significant gap in conducting family assessments is the lack
of valid and reliable instru- ments that measure family
dimensions of a health-related lifestyle. Family assessment and
indi- vidual assessment are interrelated processes and
complement each other. Table 4–6 lists suggested assessment
areas. To provide further guidance, Chapter 5 presents a format
for developing a fam- ily health promotion-prevention plan.
TABLE 4–6 Components of Family Assessment Nutrition
1. Meals prepared in the home are generally consistent with
MyPlate.
2. Healthy snacks are consumed in the home.
3. Knowledge about healthy eating habits is shared among
family members.
4. Mutual assistance occurs among family members for
maintenance of recommended weights
and avoidance of overweight and underweight.
5. Family members praise each other for healthy eating.
6. Family members encourage each other to drink 6 to 8 glasses
of water per day.
7. Family members base purchase decisions on nutritional labels
on food.
Physical Activity
1. Many family outings consist of vigorous or moderate physical
activity. 2. Exercise equipment is available within the home.
3. Use of home exercise equipment is part of “family time.”
4. Family members expect each other to be physically active.
5. A family membership is held in recreational facilities or
programs.
6. Time together is seldom spent watching television or playing
video games. 7. Family prefers to spend as much time out of
doors as possible.
Stress Control and Management
1. Family manages time well to minimize stressful demands on
members. 2. Family often relaxes, shares stories, and laughs
together.
3. Emotional expression is encouraged within the family.
4. Family members share stressful experiences with each other.
5. Family members offer each other assistance with difficult
tasks.
6. Family members seldom criticize each other.
7. Periods of relaxation and sleep are considered important by
the family.
Health Responsibility
1. A schedule for preventive care visits is maintained by the
family.
2. Family often discusses news and articles about health topics.
3. Family members are encouraged to seek health care early if a
problem develops.
4. Personal responsibility for health is encouraged by the
family.
5. Family feels a sense of responsibility for the health of the
family and each member.
6. Health professionals are consulted about health promotion as
well as care in illness.
7. Appropriate protective behaviors are openly discussed and
encouraged (abstinence, use
of condoms, hearing protection, eye protection, sunscreen,
helmets).
Family Resilience and Resources
1. Worship or spiritual experiences are a regular part of family
activities.
2. Family members share a sense of “togetherness” despite
difficult life events. 3. Family has a common sense of purpose
in life.
4. Family members encourage each other to “keep going” when
life is difficult. 5. Growth in positive directions is mutually
encouraged within the family.
6. Health is nurtured as a positive family resource.
7. Personal strengths and capabilities are nurtured.
Family Support
1. Family has a number of friends or relatives that they see
frequently.
2. Family is involved in community activities and groups.
3. Family members frequently praise each other.
4. In times of distress, the family can call on a number of other
families or individuals for help. 5. Disagreements are settled
through discussion rather than verbal abuse or physical
violence. 6. Family members model healthy habits for each
other.
7. Professional support services are sought when needed.
AssEssmENT oF THE commUNITy
A third essential component of assessing the health of
individuals is an assessment of the com- munity in which they
live, work, and play. Community assessment is a complicated
and time- consuming undertaking. However, such assessments
are critical to identify community strengths and resources as
well as to diagnose community problems and/or deficits.
Collabora- tion is required among many individuals in the
community as well as health professionals.
Chapter4 • AssessingHealthandHealthBehaviors 97
98 Part2 • PlanningforHealthPromotionandPrevention
A community analysis performed with the community, and not
on or for the community, increases the likelihood of success. A
team or coalition of local citizens and organizations involved in
the assessment process encourages community “ownership” of
the program and commitment to implement the plan.
There are four objectives for conducting a community
assessment:
1. Identify community strengths and areas for improvement.
2. Identify and understand the status of community health
needs.
3. Define improvement areas to guide the community toward
implementing and sustaining
policy, systems, and environmental changes around healthy
living strategies (e.g., increased physical activity, improved
nutrition, reduced tobacco use and exposure, and chronic dis-
ease management).
4. Assist with prioritizing community needs and consider
appropriate allocation of available resources (Centers for
Disease Control and Prevention, 2010).
Assessment involves gathering data and input on what the
community needs. Assessing
community needs gives voice to citizens’ concerns and issues
and allows that “voice” to influ- ence significantly the program
design. Components of a community assessment include human
biology, the environment, community lifestyles, and the health
system. Table 4–7 lists these components.
An assessment methodology that combines at least three to four
data collection methods is more likely to provide a holistic
picture of the community than is an assessment that relies on
only one or two approaches. Review the advantages and
disadvantages of data collection methods at the CDC Healthy
Communities website.
Successful implementation of community health promotion-
prevention programs depends in large part on a well-developed
community plan. Community-level changes such as policy are
more sustainable, impact infrastructure, and support social
change. For example, an effort to improve family food choices
is sustainable only if healthy, affordable, and assessable food
loca- tions are available in the community.
TABLE 4–7 Components of Community Assessment
Human Biology
1. Composition of population by age, gender, and race
2. Population patterns of longevity
3. Genetic inheritance patterns by gender and race
4. Disease incidence and prevalence compared to prior years,
and to state and national statistics 5. Health status indicators
(immunization levels, nutritional status, mobility)
Environment
1. Physical environment (urban/rural/suburban, housing, water
supply, parks and recreation, climate, topography, size,
population density, aesthetics, natural or manmade resources,
goods and services, health risks)
2. Psychologic environment (productivity level, cohesion,
mental health status, communication networks, intergroup
harmony, future orientation, prevalence of stressors)
3. Social environment (income and education levels,
employment, family composition, religious affiliations, cultural
affiliations, language[s] spoken, social services, organization
profile, leadership and decision-making structures)
Community Lifestyles
1. Consumption patterns (nutrition, alcohol)
2. Occupational groups
3. Leisure pursuits
4. Community health attitudes and beliefs
5. Patterns of health-related behaviors in aggregates 6. History
of participation in community health action
Health System
1. Health care services available (health promotion, prevention,
primary care, secondary care, tertiary care, mental health)
2. Accessibility of promotive and preventive care (low income,
homeless, varying racial and ethnic groups)
3. Financing plans for health care
Source: Clark, Mary Jo, Community Health Nursing: Caring for
Populations, 4th Edition, © 2003. Reproduced by permission of
Pearson Education, Inc., Upper Saddle River, New Jersey.
A community-based action may improve the overall health of
the community, but within the community, certain groups may
be disenfranchised based on income level or occupation,
exacerbating health disparities. Achieving health equality may
be at odds with improving the overall health of the community,
and priorities must be determined (Institute of Medicine, 2012).
The need for transparency is paramount between the decision
makers and the community to ensure that the action plan
reflects the values and preferences of the citizens.
PRAcTIcE coNsIdERATIoNs IN AssEssING HEALTH ANd
HEALTH BEHAvIoR
Use of assessment measures to document areas for improvement
to enhance the health status of individuals, families, and
communities is an important responsibility of the nurse. Assess-
ment data about health status and behaviors provide the basis
for clinical judgments and help plan appropriate individual,
family, and community interventions. Nurses’ knowledge and
influence can ensure that a portfolio of conceptually congruent
assessment instruments is available and used in the work
setting. The nurse must know how to administer assessment
measures and explain the value of conducting systematic
assessments to the client. The busy work environment may
discourage the use of detailed assessments because they require
time to administer and follow up. One strategy to manage the
time issue is to seek innovative ways to communicate with
clients through videotapes and brochures that explain
assessment proce- dures. Information technology has made
computerized assessment possible. Thus, clients may be able to
complete self-assessments at home, as time allows, with
transmission of the informa- tion by computer prior to health
care visits.
Practicing nurses must keep up-to-date about new assessment
measures and strategies that can be quickly implemented and
yield accurate data. Nurses influence the quality of the health
promotion plan of the individual, family, and community
through a commitment to thorough assessment of health and
health behaviors.
Chapter4 • AssessingHealthandHealthBehaviors 99
100 Part2 • PlanningforHealthPromotionandPrevention
oPPoRTUNITIEs FoR REsEARcH IN HEALTH AssEssmENT
ANd HEALTH BEHAvIoR
Research that develops and tests assessment instruments for
health and health behaviors of aggre- gates from diverse racial,
cultural, and socioeconomic backgrounds is a high priority.
Reliable and valid instruments based on theory and research are
needed to perform meaningful assess- ments. Community
interventions should be developed and tested in subgroups.
Accurate knowl- edge of the client, family, and community will
facilitate the development and implementation of successful
health promotion interventions.
Summary
Health assessment at the individual, family, and community
levels is time intensive and costly, so measures must reflect
client characteristics and
Learning Activities
1. Go to the My Family Health Portrait website and record a
traditional family health portrait. Examine the differences
between My Family Health Portrait and the commercial
application at Genopro.
2. Develop a list of safeguards to ensure that non- computer
users are included in the health care technology environment.
3. Develop an assessment plan based on age-specific
instruments for a child, a young adult, and an older adult.
4. UsingTable4–2,determineyourpercentageofbody fat and
outline a personal goal based on the results.
References
American College of Sports Medicine. (2013). ACSM’s resource
manual for guidelines for exercise testing and prescription (9th
ed.). Baltimore, MD: Williams and Wilkins.
ANA SmartBrief. (2012). Mobile apps seen as one of top
medical trends for 2013. New York, NY: Wall Street Journal
(12/31).
Bleyer, A., & Welsh, H. (2012). Effect of three decades of
screening mamography on breast-cancer incidence. New
England Journal of Medicine, 367(21),1998–2005.
Block, L. (2013). USPSTF mommo recommendations: Tempest
in a teapot? Retrieved May 20, 2013, from HealthImaging:
http://www.healthimaging.com
presenting health issues. The nurse and client must mutually
establish a relevant plan to ensure its success.
5. Investigate one approach to assessing a family and discuss its
strengths and weaknesses for use in the clinical setting.
6. Identify the relationship between a family and a community
assessment and discuss how they affect the health outcomes of
the family and community.
7. Discuss factors to consider in a community assess- ment
including those influencing the extent of assessment conducted.
/topics/womens-health/breast-imaging/uspstf-
mammo-recommendations-tempest-teapot. Bulechek, G.,
Butcher, H., Dochterman, J., & Wagner, C. (2013). Nursing
Interventions Classification (NIC)
(6th ed.). St. Louis, MO: Mosby.
Centers for Disease Control and Prevention. (2010).
Community Health Assessment and Group Evaluation
(CHANGE) action guide: Building a foundation of knowledge to
prioritize community needs. Atlanta, GA: U.S. Department of
Health and Human Services.
Chen, Y. Y., Lu, J. C., & Jan, J. K. (2012). A secure EHR
system based on hybrid clouds. Journal Medical Sys- tems, 3(5),
3375–3384.
Chung, L., Wong, F., & Chan, M. (2007). Relationship of
nurses’ spirituality to their understanding and practice of
spiritual care. Journal of Advanced Nursing, 58(2), 158–170.
Clark, M. (2007). Community health nursing: Advocacy for
population health (5th ed.). Upper Saddle River, NJ: Prentice
Hall.
CMS.gov. (2009). Retrieved February 7, 2013, from Centers for
Medicare & Medicaid Services: www .cms.gov/Regulations-
and-Guidance/legislation /EHRIncentiveProgram.
Cohen, S., Kessler, R., & Gordon, L. (1997). Measuring stress.
New York, NY: Oxford Press.
Derogatis, L., & Lazarus, R. (1997). Evaluating stress. The
Derogatis stress profile (DSP): A theory driven aproach to
stress measurement. Lanham, MD: Scarecrow Press.
Folkman, S., &, Lazarus, R. (1988). Coping as a mediator of
emotion. Journal of Personality and Social Psychology, 54(3),
466–475.
Frank-Stromborg, M. (2004). Instruments for clinical health-
care research (3rd ed.) Sudbury, MA: Jones & Bartlett.
Galek, K., Flannelly, K., Vane, A., & Galek, M. (2012). The
Spiritual Needs Assessment for Patients (SNAP): Development
and validation of a comprehensive instrument to assess unmet
spiritual needs. Journal of Pain and Symptom Management,
44(1), 44–51.
Gordon, M. (2009). Manual of nursing diagnosis (12th ed.).
Sudbury, MA: Jones and Bartlett, Inc.
Gupta, D., & Lis, C. (2010). Pretreatment serum albu- min as a
predictor of cancer survival: A systematic review of the
epidemiological literature. Nutrition Journal, 9, 69.
Hagan, J. F., Jr., Shaw, J. S., & Duncan, P. M. (Eds.). (2008).
Bright futures: Guidelines for health supervision of infants,
children, and adolescents (3rd ed.). Elk Grove Village, IL:
American Academy of Pediatrics.
Hendricks, C., Murdaugh, C., & Pender, N. (2006). The
adolescent lifestyle profile: Development and psycho- metric
characteristics. Journal of National Black Nurses Association,
17(2), 1–5.
Institute of Medicine. (2012). An integrated framework for
assessing the value of community-based prevention.
Washington, DC: The National Academy of Sciences.
Kaakinen, J., Gedaly-Duff, V., Hanson, S., & Coehlo, D.
(2009). Family health care nursing: Theory, practice, and
research. Philadelphia, PA: F. A. Davis Co.
Kressin, N., Manze, M., Russell, S., Katz, R., Claudio, C.,
Green, B., & Wang, M. (2010). Self-reported willing- ness to
have cancer screening and the effects of sociodemographic
factors. Journal of the National Med- ical Association, 102(3),
219–227.
Li, M., Friedman, B., Conwell, Y., & Fiscella, K. (2007).
Validity of the Patient Health Questionnaire 2 (PGQ-2)
in identifying major depression in older people. Journal
of the American Geriatric Society, 55, 596–602.
Li, Y., Lee, P., Jian, W., & Kuo, C. (2009). Electronic Health
Record goes personal world-wide. Yearbook of Medical
Informatics, 10(1), 40–43.
Litwinczuk, K., & Groh, C. (2007). The relationship
between spirituality, purpose in life, and well-being in HIV-
positive persons. Journal of the Association of Nurses in AIDS
Care, 18(3), 13–22.
Lunney, M. (2008). The need for international nursing diagnosis
research and a theoretical framework. Inter- national Journal of
Nursing Terminologies and Classifi- cations, 19(1), 28–29.
Melesis, A. (2012). Theoretical nursing: Development and
progress. Philadelphia, PA: Lippincott, Williams & Wilkins.
Monod, S., Rochat, E., Bula, C., & Spencer, B. (2010). The
spiritual needs model: Spirituality assessment in the geriatric
hospital setting. Journal of Religion, Spiritual- ity & Aging,
22(4), 271–282.
Moorhead, S., Johnson, M., Maas, M., & Swanson, E. (Eds.).
(2013). Nursing outcomes classification (NOC) (5th ed.). St.
Louis, MO: Elsevier.
National Association of Nursing Diagnosis-International.
(2013). Retrieved from: www.nanda.org
Nishida, T., & Sakakibara, H. (2010). Association between
underweight and low lymphocyte count as an indicator of
malnutrition in Japanese women. Journal of Womens Health,
19(7), 1377–1383.
Peace, J., & Lutz, K. (2009). Nursing conceptionization of
research and practice. Nursing Outlook, 57(5), 42–49.
Popkess-Vawter, S. (2008). Wellness nursing diagnosis: To be
or not to be? Journal of Terminologies and Classifica- tions,
2(1), 19–25.
Robert Wood Johnson Foundation. (2009). Personal health
records. Retrieved from http://www.rwjf.org/en/search- results.
Ryan-Wenger, N., Wilson (Sharrer), V., & Broussard, A.
(2012). Stress, coping, and health in children. In V. H. Rice,
Stress, coping, and health implications for nursing research,
theory, and practice (pp. 226–253). Los Angeles, CA: Sage.
Sarason, B., Shearin, E., Pierce, X., & Sarason, J. (1987). A
brief measure of social support: Practical and theoreti- cal
implications. Journal of Social and Personal Rela- tions, 4, 497–
510.
Sechrist, K., Walker, S., Pender, N., & Frank-Stromborg, M.
(1987). Development and psychometric evaluation of the
Exercise benefits/Barriers Scale. Journal of Nursing Research,
10, 357–365.
Spielberger, C., Gorsuch, R., Lushene, R., & Vagg, P. (1983).
Manual for state-trait anxiety inventory. Palo Alto, CA:
Consulting Psychologists Press Inc.
The Office of Minority Health. (2013). Cultural compe- tency.
Retrieved January 30, 2013, from Minority
Chapter4 • AssessingHealthandHealthBehaviors 101
102 Part2 • PlanningforHealthPromotionandPrevention
Health, Health & Human Services: http://aspe.hhs
.gov/sp/reports/2010
U.S. Department of Commerce Census. (2012). Selected
individual characteristics 2010. Washington, DC: U.S.
Government Printing Office.
U.S. Preventive Services Task Force. (2012). The Guide to
Clinical Preventive Services. Washington, DC: Agency
for Healthcare Research and Quality.
WHO Expert Consultation. (2008). Waist circumference
and waist-hip ratio. Geneva, Switzerland: World Health
Organization.
Wright, M., Creed, P., & Zimmer-Gembeck, M. (2010). The
development and initial validation of a brief daily hassles scale
suitable for use with adolescents. European Journal of
Psychological Assessment, 26(3), 220–226.
Wright, L., & Leahey, M. (2009). Nurses and families: A guide
to family assessment and intervention. Philadelphia, PA: FA
Davis Co.
LIVING IN CHAOS BUT ON
A BUDGET
Are you frustrated or
worried about your
finances?
STOP!!!
Here is the Answer:
Learn how to handle
money, organize bills,
build a grocery list, save
money, and pay off debt.
May 20th through the 25th
5:30 – 7:30 pm
Ages: 16 & Up
For Information Contact: Ronald Opp
Ashford Multigenerational Center
8620 Spectrum Center Blvd
San Diego, CA 92123
FUN FAMILY FITNESS NIGHT
DATE: SATURDAY MAY 23, 2020
TIME: 5:00-6:00PM
Join us for an evening of active family fun!
Are you worrying that you do not know how to dance? No
worries! Zumba is a fun cardio workout that combines
dance, exercise, and high-energy music that anyone can
do. We have experienced, friendly, and energetic Zumba
instructor who can guide you through each step of the
move. You are not alone -you have your family and us.
Special Note: Please bring in a hand towel and wear
comfortable clothes and sneakers. We will provide
bottled water.
Fitness Activity
Zumba
────
Preschoolers and
their Families
────
AU
Multigenerational
Gym
────
5 Free Raffle
Tickets per
Family
────
RSVP By:
Thursday,
May 22, 2020
In the main office
AU Multigenerational
Center
8620 Spectrum Center Blvd
San Diego, CA 92123
For More Information
Contact: Dina Mistry
Phone: 866-711-1700
256
CHAPTER 12
Health Promotion in Vulnerable Populations
Objectives
this chapter will enable the reader to:
1. Discuss the social and economic determinants of health and
their role in health disparities.
2. Describe the concept of equity in health.
3. Discuss approaches to address health inequities in diverse
populations.
4. Examine strategies to promote health literacy.
5. Describe the continuum of interpersonal skills necessary for
cultural competence.
6. Review strategies that facilitate culturally competent
communication in vulnerable
populations.
7. Describe approaches to ensure culturally competent health
promotion programs.
Vulnerable populations are diverse groups of individuals who
are at greatest risk for poor physical, psychological, and/or
social health outcomes. Vulnerable populations are more likely
to develop health problems, usually experience worse health
outcomes, and have fewer resources to improve their conditions.
Various terms have been used to describe vulnerable
populations, including underserved populations, special
populations, medically disadvantaged, poverty-stricken
populations, and American underclasses. Vulnerable groups
include persons who experience discrimination, stigma,
intolerance, and subordination, and those who are polit- ically
marginalized, disenfranchised, and often denied their human
rights. Vulnerable popula- tions may include people of color,
the poor, non-English-speaking persons, recent immigrants and
refugees, homeless persons, mentally ill and disabled persons,
gay men and lesbians, and substance abusers.
The values, attitudes, culture, and life circumstances of
individuals who are poor, socially marginal, or culturally
different from traditional mainstream society, and the
communities in which they reside, must all be considered when
planning health promotion and prevention
Chapter12 • HealthPromotioninVulnerablePopulations 257
activities. Taking into account the factors that reflect the health
determinants of vulnerable popu- lations is key to promoting
positive health behaviors.
In spite of improvements in health and spending more money on
medical care than any other nation, the United States ranks near
the bottom on key indicators of health, and health disparities
continue to persist, based on an individual’s racial/ethnic
background and socioeconomic (income and education)
characteristics (Braverman, Egerter, & Mockenhaupt, 2011).
Blacks, Hispanics and other racial/ethnic minorities are more
likely to be socioeco- nomically disadvantaged, a more likely
explanation for health differences by race and ethnicity. Health
disparities are the differences in the incidence, prevalence,
mortality, and burden of diseases and other adverse health
conditions that exist among groups who are defined by certain
characteristics. Health disparities disproportionately affect
individuals who are members of the racial, ethnic minority,
underserved, and other vulnerable groups mentioned previously,
as well as persons who live in geographic (rural) areas where
they are socially and physically isolated. Elimination of
disparities to improve the health of all groups is an overarching
goal of Healthy People 2020, and determinants of health and
health dispari- ties are included as outcome measures of the
national health objectives. (See the Healthy People 2020
website for details.) Although the major causes of health
disparities need the input of society and government,
development of empowering health promotion programs tailored
for diverse individuals and communities is a major
responsibility of nurses and other health care professionals.
Determinants of HealtH Disparities anD HealtH inequities
Social determinants of health are the structural and economic
conditions in which people are born, live, work, and age (World
Health Organization, 2013). These conditions are also
responsible for health inequities and are shaped locally,
nationally, and globally by economic distribution, social
policies, and politics. In other words, money, power, and
resources are responsible for the major inequities in health.
Health inequities are avoidable inequalities in health between
groups of persons that arise from social and economic
conditions which increase their risks for illness and access to
health promoting and preventive services. Health equity—the
absence of disparities in health across populations, genders, and
geo- graphic areas—can be achieved by empowering individuals
and communities to challenge and change the distribution of
social resources and advocate for social policies for equal
access for all.
Inequities in health are well documented and are considered to
be the result of complex interactions among multiple factors:
• Biologicalvariations
• Healthcareaccess
• Personalhealthbehaviors
• Socialandeconomicresources • Culture
One way to view health disparities is by examining the range of
risk factors that increase the potential for inequalities (Table
12–1). The risk factors include personal health behaviors, popu-
lation characteristics, health care characteristics, the social and
physical environments, and the types of diseases that are
disproportionately diagnosed in vulnerable groups (Koh,
Oppenheimer, Massin-Short, Emmons, Geller, & Viswanath,
2010).
258 Part5 • HealthPromotioninDiversePopulations
taBle 12–1 Range of Potential Risk Factors for Health
Disparities
Potential Risk Factor
Personal Health Behaviors Population Characteristics Health
Care Characteristics Residential Physical Environment
Social Residential Environment Diseases
Examples
Tobacco use, illicit drug use, personal hygiene, dietary habits,
physical inactivity, unsafe sexual practices.
Race, ethnicity, immigration status, education, social position,
occupation, employment, income, age, sexual orientation, health
literacy.
Insurance, access to health care services, access to prevention
and screening services, regular physician, medication
affordability.
Housing density, housing quality, traffic density, air pollutants,
hazardous wastes, drinking
water quality, urban or rural, zoning policies, proximity to
health care services, and proximity to quality food.
Civic engagement, crime rate, isolation, neighborhood cohesion,
neighborhood social capital.
Obesity, hypertension, cardiovascular diseases, diabetes, mental
illness, HIV/AIDS, cancer, respiratory illnesses, foodborne and
waterborne illnesses.
The most important social determinants of health inequities are
considered to be structural influences, or factors that generate
and reinforce social stratification and social class divisions in a
society and define one’s socioeconomic position (Solar & Irwin,
2010). Socioeconomic position provides access to power,
prestige, and resources and is based on a person’s income,
education, and occupation. Other important structural
determinants include gender, social class, and race/ ethnicity.
These determinants are shown in the model in Figure 12–1 that
describes the social determinants of health. This model was first
drafted at the World Health Organization (WHO) Commission
on Social Determinants of Health Meeting in 2005 (Solar &
Irwin, 2010). The model depicts how governance structures or
the sociopolitical context influences one’s socioeconomic
position through the distribution of resources. Socioeconomic
position shapes intermediate health determinants. Intermediary
determinants that are determined by socioeconomic position
include the following:
· Material characteristics: neighborhood, housing, physical
working conditions, buying potential
·
Behavioralfactors:nutrition,physicalactivity,tobaccouse,alcoholu
se
· Psychosocial factors: stressful living conditions and
relationships, social supports, coping
resources
Intermediary determinants are reflective of an individual’s place
in the social hierarchy, which results in differential exposure
and vulnerability to health-compromising conditions (Solar &
Irwin, 2010). All of these factors determine one’s health status
and well-being.
Chapter12 • HealthPromotioninVulnerablePopulations 259
SOCIOECONOMIC AND POLITICAL CONTEXT
Governance
Socioeconomic Position
Material Circumstances
(Living and Working, Conditions, Food Availability, etc.)
Behaviors and Biological Factors
Psychosocial Factors
Social Policies
Labour Market, Housing, Land
Social Class Gender Ethnicity (racism)
IMPACT ON EQUITY IN HEALTH AND WELL-BEING
Macroeconomic Policies
Education Occupation Income
Public Policies
Education, Health, Social Protection
Culture and Societal Values
Social Cohesion & Social Capital
Health System
STUCTURAL DETERMINANTS SOCIAL DETERMINANTS
OF HEALTH INEQUITIES
INTERMEDIARY DETERMINANTS SOCIAL
DETERMINANTS
OF HEALTH
fiGure 12–1 WHO Framework Describing Structural
Determinants of Health Source: Solar, O., & Irwin, A. (2010). A
conceptual framework for action on the social determinants of
health. Social Determinants of Health Discussion Paper 2
(Policy and Practice). Accessed at http://www.who.int/
sdhconference/resources/ConceptualframeworkforactiononSDH_
eng.pdf
socioeconomic Determinants
The key components of socioeconomic position depicted have
been substantiated to be the root of health inequities, measured
at the population level (Solar & Irwin, 2010). Low economic
status is the most consistent predictor of life expectancy,
morbidity and mortality, and health status (Braverman, Cubbin,
Egerter, Williams, & Pamuk, 2010). Although there is great
diversity among minority populations, overall, minorities have
substantially lower incomes and educational levels than do
whites. Income is a powerful variable that explains health
status. Low income and educa- tion result in economic hardship,
such as the inability to meet one’s living expenses, while higher
incomes and educational levels facilitate access to care, better
housing in safer neighborhoods, increased opportunities for
healthy food purchases, and access to club memberships and
health- promotion programs. In addition, low-status occupations
expose individuals to physical health hazards. Educational
attainment also is lower in minority groups. High-risk behaviors
have been correlated with lower educational levels. More-highly
educated persons are also more likely to obtain health-related
information at understandable levels.
A socioeconomic gradient exists for almost every health
indicator for every racial and ethnic group (Braverman, Egerter,
& Mockenhaupt, 2011). The effects of low socioeconomic status
are long lasting. Low socioeconomic status in childhood has
been associated with poorer health in adulthood. The cumulative
wear and tear of the adverse experiences of living in poverty,
with its multiple challenges, results in chronic illnesses.
Families who have been poor over several generations and
suffer ongoing discrimination and frustration without
260 Part5 • HealthPromotioninDiversePopulations
substantial upward movement develop feelings of powerlessness
and perceive their condi- tions differently than do recently
arrived immigrants who are poor, but are hopeful about their
future.
Access to care can be measured by the proportion of a
population that has health insurance. Because of their
socioeconomic situation, racial and ethnic minorities are much
more likely to be underinsured or to lack health insurance.
When they do have insurance, it is likely to be public insurance,
primarily Medicaid. Health insurance contributes to the amount
and type of health services obtained. Lack of health insurance
has important implications for health promo- tion and
prevention efforts, such as screening and access to wellness
programs. Insurance status has also been correlated with self-
reported health status. Those who rate their health as fair or
poor are more likely to be uninsured than are those who rate
their health as good or excellent. Poor individuals also
experience greater barriers in accessing care, have more
difficulty getting an appointment, and wait longer during health
care visits. These factors are compounded by the fact that many
communities of poverty mistrust the government and
government-controlled programs. Socioeconomic barriers to
accessing care exist for vulnerable populations. These barriers
have been repeatedly documented and need to be addressed to
improve access to quality health care.
promotinG equity in HealtH
Achieving equity in health means that everyone has the
opportunity to attain their full health potential, and no one is
disadvantaged because of social, demographic, or geographic
differ- ences. Health disparities can be eliminated through the
promotion of health equity, which minimizes avoidable
differences between groups of people who have diverse levels
of underlying social advantage (Braverman, Kumanyika,
Fielding, LaVeist, Borrell, Manderscheld, & Troutman, 2011).
The early literature on health disparities focused on
racial/ethnic differences in health and “closing the gap”;
however, “achieving health equity” is now more commonly
discussed. Equity in health places emphasis on the multiple
influences on individual and popu- lation health and draws
attention to the many challenges that must be addressed.
Promotion of health equity moves health promotion to a
political activity, as it moves from the individual level to a
broader focus on strategies to also change the distribution of
social and economic resources (Raphael, 2011a).
Health equity can be achieved only through interventions that
address the multiple health determinants:
• Social:networks,connections,institutionallinks
• Economic:money,time,prestige
•
Sociocultural:skills,education,knowledge,language,religion,fami
lybackground • Political:power,distributionofresources
A study of the economic value of improving the health of less-
educated American adults if they were to experience mortality
rates and health status similar to those of adults with a col- lege
education was commissioned by the Robert Wood Johnson
Foundation in 2007 (Schoeni, Dow, Miller, & Pamuk, 2011). In
spite of limitations, results showed an annual economic value of
$1.2 trillion. The economic burden of health disparities over a
three-year period was estimated to be $1.24 trillion. Although
these analyses do not uncover the causal pathway of education
on health or account for costs in eliminating disparities, the
results from these and other studies document the important role
of socioeconomic characteristics in health.
Chapter12 • HealthPromotioninVulnerablePopulations 261
multilevel interventions
Successful outcomes result from multilevel interventions and
programs that are directed to individuals, communities, and
social policies. Multilevel interventions address several factors
to effect change in individuals and their socioeconomic context.
Multilevel interventions go beyond individual-focused
strategies to structural and socioeconomic influences to promote
change (Trickett & Beehler, 2013). Multilevel interventions
have been called fourth-generation health disparities research
(Thomas, Quinn, Butler, Fryer, & Garcia, 2011). These types of
interventions incorporate both qualitative and quantitative
methods to implement programs and evaluate outcomes. They
are complex, pose many challenges, and require input from mul-
tiple sources, such as interdisciplinary health care teams,
community organizations, and local and state governments.
Community empowerment
At the community level, empowerment is a key strategy for
reducing health inequities. (See Chapter 11 for a discussion of
individual empowerment and Chapter 14 for more discussion on
community empowerment.) Community empowerment is a
social action process that enables individuals, communities, and
organizations to gain control over their lives within their social
and political context to promote equity (Wiggins, 2011). It
involves a shift in power between individuals and other social
groups. Local community organizations empower individuals by
working together to build trust and improve neighborhood
programs. They also work with community members to advocate
for new programs and resources for their neighborhoods. For
example, they may work together to advocate for after-school
programs for youth, parks for leisure activities for families, or
increased law enforcement presence; or they may work to bring
affordable health screening services to the neighborhood for
those without transportation. Community agencies can advocate
for local school board participation. In addition, they can
empower community members to take an active role in
promoting healthy and safe schools and neighborhoods.
Empowered communities believe in their capacity to change
inequities and use that capacity to bring about change.
Empowered community members feel a sense of community,
which increases a sense of caring and support for each other and
facilitates participation in change, such as working to obtain
affordable housing, public transportation, safe walking places,
and access to healthy foods. Empowered communities work with
external powers to address community needs. For example, they
may lobby and engage in policy decisions that impact the health
of their communities. The ultimate goal of community
empowerment is to create relationships and policies to promote
health equity (Wiggins, 2011).
Focusing on working conditions, household and neighborhood
hazards, and availability of community resources such as
healthy foods and physical activity areas brings attention to
environmental factors that can be changed within communities
and work sites. Empowered com- munity members can organize
walking groups, community lectures, and health fairs.
Community members need to be able to participate in decisions
that influence their health and the health of the community.
Empowerment means having a political voice to garner
resources to change the community.
Community-based organizations (CBOs) are logical places to
begin to bring about com- munity change, as these organizations
are enmeshed in the life of the community (Griffith et al.,
2010). They are organizational sites where community members
meet to socialize or address their concerns. CBOs are places
where individuals can learn skills that empower them to address
262 Part5 • HealthPromotioninDiversePopulations
community issues. Leaders of CBOs can represent and advocate
for the community. Empower- ing CBOs enables members to
establish new projects and programs, as well as use their
collective power to advocate for policy changes. Empowered
CBOs are able to build community capacity, as they know the
strengths, weaknesses, and availability or lack of resources
within their community.
Community-based participatory research
Community-based participatory research (CBPR) is a method
that integrates research with social action (Masuda, Poland, &
Baxter, 2010). It is an effective way to build community
capacity, as the method functions to transform power structures
to create knowledge and promote actions for social change
through community engagement. CBPR has been successfully
implemented to expose power inequities in disadvantaged
communities. This strategy enables community voices to be
heard. Wallerstein and Duran (2010) have identified barriers to
implementing CBPR and strategies to address these barriers.
policy advocacy
The socioeconomic and structural gradients in this country and
their relationship to differences in health mandate that policies
be created to address the social determinants of health
inequities (Braverman, Cubbin, Egerter, Williams, & Pamuk,
2010). Canada, England, and Australia are considered leaders in
implementing health-promoting public policies through
legislation, fiscal measures, taxation, and organizational change
(Raphael, 2011b).
Public policies influence the prerequisites of health in three key
areas: early childhood development, employment, and income
(Raphael, 2011a). Public policies to address these key areas
have all been associated with lower rates of poverty and income
inequities, Notably, the United States has the second lowest
percentage of gross domestic product expenditures allocated in
the form of public expenditures and the highest poverty rates in
families and children among 21 selected countries (Raphael,
2011a). These rankings point to the need for policy to shift from
a focus on individual health risk behaviors to the redistribution
of economic resources to promote a healthy society for all.
Nurses and all other health professionals need to become
knowledgeable about the political economy of health and public
policy analysis to be able to advocate for health policies that
promote healthy communities and equitable socioeconomic
conditions. In com- munity settings, nurses may become
spokespersons for the poor in order for their voices to be heard.
At the individual level, strategies to alleviate poverty include
helping families obtain available benefits, providing
information about available services and how to access them,
targeting those in greatest need, teaching skills, and partnering
individuals with community agencies to provide additional
supports (Cohen & Reutter, 2007). At the community level,
empowerment strategies promote community dialogue between
community members, CBOs, and persons in positions to
influence policies. Nurses can also work with their professional
associations to place the elimination of health inequities on
their agendas for action. Membership in organizations that
promote agendas to reduce health inequities is another avenue
for action. Political competence can be developed through
courses and dia- logues with knowledgeable others. Working in
76 CHAPTER 4 Assessing Health and Health Behaviors Objecti.docx

Contenu connexe

Similaire à 76 CHAPTER 4 Assessing Health and Health Behaviors Objecti.docx

4320FinalPaperBenefitsofPHRsPersonalHealthRecords (1)
4320FinalPaperBenefitsofPHRsPersonalHealthRecords (1)4320FinalPaperBenefitsofPHRsPersonalHealthRecords (1)
4320FinalPaperBenefitsofPHRsPersonalHealthRecords (1)Dan Villamayor
 
Healthcare by Any Other Name - Centricity Business Whitepaper
Healthcare by Any Other Name - Centricity Business WhitepaperHealthcare by Any Other Name - Centricity Business Whitepaper
Healthcare by Any Other Name - Centricity Business WhitepaperGE Healthcare - IT
 
Chandy Ravikumar
Chandy RavikumarChandy Ravikumar
Chandy RavikumarChandy1221
 
Pg2 Beginning in 1991, the IOM (which stands for the Institute o.docx
Pg2   Beginning in 1991, the IOM (which stands for the Institute o.docxPg2   Beginning in 1991, the IOM (which stands for the Institute o.docx
Pg2 Beginning in 1991, the IOM (which stands for the Institute o.docxrandymartin91030
 
Patient relationship management on the cloud
Patient relationship management on the cloudPatient relationship management on the cloud
Patient relationship management on the cloudComidor
 
Nursing informatic'spresentation
Nursing informatic'spresentationNursing informatic'spresentation
Nursing informatic'spresentationqueeniejoy
 
The care business traditionally has generated massive amounts of inf.pdf
The care business traditionally has generated massive amounts of inf.pdfThe care business traditionally has generated massive amounts of inf.pdf
The care business traditionally has generated massive amounts of inf.pdfanudamobileshopee
 
Dedrick, Mariah Paper
Dedrick, Mariah PaperDedrick, Mariah Paper
Dedrick, Mariah Papermfdedrick
 
NURS 6050 GCU Nursing in Florida Presentation.docx
NURS 6050 GCU Nursing in Florida Presentation.docxNURS 6050 GCU Nursing in Florida Presentation.docx
NURS 6050 GCU Nursing in Florida Presentation.docxstirlingvwriters
 
Strategy and digital health
Strategy and digital healthStrategy and digital health
Strategy and digital healthShiv ognito
 
7 Reasons Your Company Should Use A Digital Healthcare Solution.pptx
7 Reasons Your Company Should Use A Digital Healthcare Solution.pptx7 Reasons Your Company Should Use A Digital Healthcare Solution.pptx
7 Reasons Your Company Should Use A Digital Healthcare Solution.pptxMocDoc
 
Catalyzing coordinationtechnologyswholepersoncare
Catalyzing coordinationtechnologyswholepersoncareCatalyzing coordinationtechnologyswholepersoncare
Catalyzing coordinationtechnologyswholepersoncare~Eric Principe
 
Brightree-whitepaper_4-pressures-shaping-post-acute care
Brightree-whitepaper_4-pressures-shaping-post-acute careBrightree-whitepaper_4-pressures-shaping-post-acute care
Brightree-whitepaper_4-pressures-shaping-post-acute caretohanlon
 
Patient_Engagement_Whitepaper
Patient_Engagement_WhitepaperPatient_Engagement_Whitepaper
Patient_Engagement_WhitepaperTony Fanelli
 
2015 05 01 Pop Health - Laying the Foundation (00000002)
2015 05 01 Pop Health - Laying the Foundation (00000002)2015 05 01 Pop Health - Laying the Foundation (00000002)
2015 05 01 Pop Health - Laying the Foundation (00000002)Dana Alexander
 
httpimgur.comakA1IGplaese zoom in to read the question. thank.pdf
httpimgur.comakA1IGplaese zoom in to read the question. thank.pdfhttpimgur.comakA1IGplaese zoom in to read the question. thank.pdf
httpimgur.comakA1IGplaese zoom in to read the question. thank.pdfdaniamantileonismc36
 
Unit 4 - 2.docx
Unit 4 - 2.docxUnit 4 - 2.docx
Unit 4 - 2.docxKavithaK23
 

Similaire à 76 CHAPTER 4 Assessing Health and Health Behaviors Objecti.docx (20)

4320FinalPaperBenefitsofPHRsPersonalHealthRecords (1)
4320FinalPaperBenefitsofPHRsPersonalHealthRecords (1)4320FinalPaperBenefitsofPHRsPersonalHealthRecords (1)
4320FinalPaperBenefitsofPHRsPersonalHealthRecords (1)
 
Healthcare by Any Other Name - Centricity Business Whitepaper
Healthcare by Any Other Name - Centricity Business WhitepaperHealthcare by Any Other Name - Centricity Business Whitepaper
Healthcare by Any Other Name - Centricity Business Whitepaper
 
Chandy Ravikumar
Chandy RavikumarChandy Ravikumar
Chandy Ravikumar
 
Pg2 Beginning in 1991, the IOM (which stands for the Institute o.docx
Pg2   Beginning in 1991, the IOM (which stands for the Institute o.docxPg2   Beginning in 1991, the IOM (which stands for the Institute o.docx
Pg2 Beginning in 1991, the IOM (which stands for the Institute o.docx
 
Patient relationship management on the cloud
Patient relationship management on the cloudPatient relationship management on the cloud
Patient relationship management on the cloud
 
Nursing informatic'spresentation
Nursing informatic'spresentationNursing informatic'spresentation
Nursing informatic'spresentation
 
The care business traditionally has generated massive amounts of inf.pdf
The care business traditionally has generated massive amounts of inf.pdfThe care business traditionally has generated massive amounts of inf.pdf
The care business traditionally has generated massive amounts of inf.pdf
 
Dedrick, Mariah Paper
Dedrick, Mariah PaperDedrick, Mariah Paper
Dedrick, Mariah Paper
 
NURS 6050 GCU Nursing in Florida Presentation.docx
NURS 6050 GCU Nursing in Florida Presentation.docxNURS 6050 GCU Nursing in Florida Presentation.docx
NURS 6050 GCU Nursing in Florida Presentation.docx
 
Strategy and digital health
Strategy and digital healthStrategy and digital health
Strategy and digital health
 
7 Reasons Your Company Should Use A Digital Healthcare Solution.pptx
7 Reasons Your Company Should Use A Digital Healthcare Solution.pptx7 Reasons Your Company Should Use A Digital Healthcare Solution.pptx
7 Reasons Your Company Should Use A Digital Healthcare Solution.pptx
 
Catalyzing coordinationtechnologyswholepersoncare
Catalyzing coordinationtechnologyswholepersoncareCatalyzing coordinationtechnologyswholepersoncare
Catalyzing coordinationtechnologyswholepersoncare
 
Brightree-whitepaper_4-pressures-shaping-post-acute care
Brightree-whitepaper_4-pressures-shaping-post-acute careBrightree-whitepaper_4-pressures-shaping-post-acute care
Brightree-whitepaper_4-pressures-shaping-post-acute care
 
Digital Pharma
Digital PharmaDigital Pharma
Digital Pharma
 
Patient_Engagement_Whitepaper
Patient_Engagement_WhitepaperPatient_Engagement_Whitepaper
Patient_Engagement_Whitepaper
 
2015 05 01 Pop Health - Laying the Foundation (00000002)
2015 05 01 Pop Health - Laying the Foundation (00000002)2015 05 01 Pop Health - Laying the Foundation (00000002)
2015 05 01 Pop Health - Laying the Foundation (00000002)
 
httpimgur.comakA1IGplaese zoom in to read the question. thank.pdf
httpimgur.comakA1IGplaese zoom in to read the question. thank.pdfhttpimgur.comakA1IGplaese zoom in to read the question. thank.pdf
httpimgur.comakA1IGplaese zoom in to read the question. thank.pdf
 
Unit 4 - 2.docx
Unit 4 - 2.docxUnit 4 - 2.docx
Unit 4 - 2.docx
 
Fin-LR.pdf
Fin-LR.pdfFin-LR.pdf
Fin-LR.pdf
 
Fin-LR.docx
Fin-LR.docxFin-LR.docx
Fin-LR.docx
 

Plus de priestmanmable

9©iStockphotoThinkstockPlanning for Material and Reso.docx
9©iStockphotoThinkstockPlanning for Material and Reso.docx9©iStockphotoThinkstockPlanning for Material and Reso.docx
9©iStockphotoThinkstockPlanning for Material and Reso.docxpriestmanmable
 
a 12 page paper on how individuals of color would be a more dominant.docx
a 12 page paper on how individuals of color would be a more dominant.docxa 12 page paper on how individuals of color would be a more dominant.docx
a 12 page paper on how individuals of color would be a more dominant.docxpriestmanmable
 
978-1-5386-6589-318$31.00 ©2018 IEEE COSO Framework for .docx
978-1-5386-6589-318$31.00 ©2018 IEEE COSO Framework for .docx978-1-5386-6589-318$31.00 ©2018 IEEE COSO Framework for .docx
978-1-5386-6589-318$31.00 ©2018 IEEE COSO Framework for .docxpriestmanmable
 
92 Academic Journal Article Critique  Help with Journal Ar.docx
92 Academic Journal Article Critique  Help with Journal Ar.docx92 Academic Journal Article Critique  Help with Journal Ar.docx
92 Academic Journal Article Critique  Help with Journal Ar.docxpriestmanmable
 
A ) Society perspective90 year old female, Mrs. Ruth, from h.docx
A ) Society perspective90 year old female, Mrs. Ruth, from h.docxA ) Society perspective90 year old female, Mrs. Ruth, from h.docx
A ) Society perspective90 year old female, Mrs. Ruth, from h.docxpriestmanmable
 
9 dissuasion question Bartol, C. R., & Bartol, A. M. (2017)..docx
9 dissuasion question Bartol, C. R., & Bartol, A. M. (2017)..docx9 dissuasion question Bartol, C. R., & Bartol, A. M. (2017)..docx
9 dissuasion question Bartol, C. R., & Bartol, A. M. (2017)..docxpriestmanmable
 
9 AssignmentAssignment Typologies of Sexual AssaultsT.docx
9 AssignmentAssignment Typologies of Sexual AssaultsT.docx9 AssignmentAssignment Typologies of Sexual AssaultsT.docx
9 AssignmentAssignment Typologies of Sexual AssaultsT.docxpriestmanmable
 
9 0 0 0 09 7 8 0 1 3 4 4 7 7 4 0 4ISBN-13 978-0-13-44.docx
9 0 0 0 09 7 8 0 1 3 4 4 7 7 4 0 4ISBN-13 978-0-13-44.docx9 0 0 0 09 7 8 0 1 3 4 4 7 7 4 0 4ISBN-13 978-0-13-44.docx
9 0 0 0 09 7 8 0 1 3 4 4 7 7 4 0 4ISBN-13 978-0-13-44.docxpriestmanmable
 
900 BritishJournalofNursing,2013,Vol22,No15©2.docx
900 BritishJournalofNursing,2013,Vol22,No15©2.docx900 BritishJournalofNursing,2013,Vol22,No15©2.docx
900 BritishJournalofNursing,2013,Vol22,No15©2.docxpriestmanmable
 
9 Augustine Confessions (selections) Augustine of Hi.docx
9 Augustine Confessions (selections) Augustine of Hi.docx9 Augustine Confessions (selections) Augustine of Hi.docx
9 Augustine Confessions (selections) Augustine of Hi.docxpriestmanmable
 
8.3 Intercultural CommunicationLearning Objectives1. Define in.docx
8.3 Intercultural CommunicationLearning Objectives1. Define in.docx8.3 Intercultural CommunicationLearning Objectives1. Define in.docx
8.3 Intercultural CommunicationLearning Objectives1. Define in.docxpriestmanmable
 
8413 906 AMLife in a Toxic Country - NYTimes.comPage 1 .docx
8413 906 AMLife in a Toxic Country - NYTimes.comPage 1 .docx8413 906 AMLife in a Toxic Country - NYTimes.comPage 1 .docx
8413 906 AMLife in a Toxic Country - NYTimes.comPage 1 .docxpriestmanmable
 
8. A 2 x 2 Experimental Design - Quality and Economy (x1 and x2.docx
8. A 2 x 2 Experimental Design - Quality and Economy (x1 and x2.docx8. A 2 x 2 Experimental Design - Quality and Economy (x1 and x2.docx
8. A 2 x 2 Experimental Design - Quality and Economy (x1 and x2.docxpriestmanmable
 
800 Words 42-year-old man presents to ED with 2-day history .docx
800 Words 42-year-old man presents to ED with 2-day history .docx800 Words 42-year-old man presents to ED with 2-day history .docx
800 Words 42-year-old man presents to ED with 2-day history .docxpriestmanmable
 
8.1 What Is Corporate StrategyLO 8-1Define corporate strategy.docx
8.1 What Is Corporate StrategyLO 8-1Define corporate strategy.docx8.1 What Is Corporate StrategyLO 8-1Define corporate strategy.docx
8.1 What Is Corporate StrategyLO 8-1Define corporate strategy.docxpriestmanmable
 
8.0 RESEARCH METHODS These guidelines address postgr.docx
8.0  RESEARCH METHODS  These guidelines address postgr.docx8.0  RESEARCH METHODS  These guidelines address postgr.docx
8.0 RESEARCH METHODS These guidelines address postgr.docxpriestmanmable
 
95People of AppalachianHeritageChapter 5KATHLEEN.docx
95People of AppalachianHeritageChapter 5KATHLEEN.docx95People of AppalachianHeritageChapter 5KATHLEEN.docx
95People of AppalachianHeritageChapter 5KATHLEEN.docxpriestmanmable
 
9 781292 041452ISBN 978-1-29204-145-2Forensic Science.docx
9 781292 041452ISBN 978-1-29204-145-2Forensic Science.docx9 781292 041452ISBN 978-1-29204-145-2Forensic Science.docx
9 781292 041452ISBN 978-1-29204-145-2Forensic Science.docxpriestmanmable
 
8-10 slide Powerpoint The example company is Tesla.Instructions.docx
8-10 slide Powerpoint The example company is Tesla.Instructions.docx8-10 slide Powerpoint The example company is Tesla.Instructions.docx
8-10 slide Powerpoint The example company is Tesla.Instructions.docxpriestmanmable
 
8Network Security April 2020FEATUREAre your IT staf.docx
8Network Security  April 2020FEATUREAre your IT staf.docx8Network Security  April 2020FEATUREAre your IT staf.docx
8Network Security April 2020FEATUREAre your IT staf.docxpriestmanmable
 

Plus de priestmanmable (20)

9©iStockphotoThinkstockPlanning for Material and Reso.docx
9©iStockphotoThinkstockPlanning for Material and Reso.docx9©iStockphotoThinkstockPlanning for Material and Reso.docx
9©iStockphotoThinkstockPlanning for Material and Reso.docx
 
a 12 page paper on how individuals of color would be a more dominant.docx
a 12 page paper on how individuals of color would be a more dominant.docxa 12 page paper on how individuals of color would be a more dominant.docx
a 12 page paper on how individuals of color would be a more dominant.docx
 
978-1-5386-6589-318$31.00 ©2018 IEEE COSO Framework for .docx
978-1-5386-6589-318$31.00 ©2018 IEEE COSO Framework for .docx978-1-5386-6589-318$31.00 ©2018 IEEE COSO Framework for .docx
978-1-5386-6589-318$31.00 ©2018 IEEE COSO Framework for .docx
 
92 Academic Journal Article Critique  Help with Journal Ar.docx
92 Academic Journal Article Critique  Help with Journal Ar.docx92 Academic Journal Article Critique  Help with Journal Ar.docx
92 Academic Journal Article Critique  Help with Journal Ar.docx
 
A ) Society perspective90 year old female, Mrs. Ruth, from h.docx
A ) Society perspective90 year old female, Mrs. Ruth, from h.docxA ) Society perspective90 year old female, Mrs. Ruth, from h.docx
A ) Society perspective90 year old female, Mrs. Ruth, from h.docx
 
9 dissuasion question Bartol, C. R., & Bartol, A. M. (2017)..docx
9 dissuasion question Bartol, C. R., & Bartol, A. M. (2017)..docx9 dissuasion question Bartol, C. R., & Bartol, A. M. (2017)..docx
9 dissuasion question Bartol, C. R., & Bartol, A. M. (2017)..docx
 
9 AssignmentAssignment Typologies of Sexual AssaultsT.docx
9 AssignmentAssignment Typologies of Sexual AssaultsT.docx9 AssignmentAssignment Typologies of Sexual AssaultsT.docx
9 AssignmentAssignment Typologies of Sexual AssaultsT.docx
 
9 0 0 0 09 7 8 0 1 3 4 4 7 7 4 0 4ISBN-13 978-0-13-44.docx
9 0 0 0 09 7 8 0 1 3 4 4 7 7 4 0 4ISBN-13 978-0-13-44.docx9 0 0 0 09 7 8 0 1 3 4 4 7 7 4 0 4ISBN-13 978-0-13-44.docx
9 0 0 0 09 7 8 0 1 3 4 4 7 7 4 0 4ISBN-13 978-0-13-44.docx
 
900 BritishJournalofNursing,2013,Vol22,No15©2.docx
900 BritishJournalofNursing,2013,Vol22,No15©2.docx900 BritishJournalofNursing,2013,Vol22,No15©2.docx
900 BritishJournalofNursing,2013,Vol22,No15©2.docx
 
9 Augustine Confessions (selections) Augustine of Hi.docx
9 Augustine Confessions (selections) Augustine of Hi.docx9 Augustine Confessions (selections) Augustine of Hi.docx
9 Augustine Confessions (selections) Augustine of Hi.docx
 
8.3 Intercultural CommunicationLearning Objectives1. Define in.docx
8.3 Intercultural CommunicationLearning Objectives1. Define in.docx8.3 Intercultural CommunicationLearning Objectives1. Define in.docx
8.3 Intercultural CommunicationLearning Objectives1. Define in.docx
 
8413 906 AMLife in a Toxic Country - NYTimes.comPage 1 .docx
8413 906 AMLife in a Toxic Country - NYTimes.comPage 1 .docx8413 906 AMLife in a Toxic Country - NYTimes.comPage 1 .docx
8413 906 AMLife in a Toxic Country - NYTimes.comPage 1 .docx
 
8. A 2 x 2 Experimental Design - Quality and Economy (x1 and x2.docx
8. A 2 x 2 Experimental Design - Quality and Economy (x1 and x2.docx8. A 2 x 2 Experimental Design - Quality and Economy (x1 and x2.docx
8. A 2 x 2 Experimental Design - Quality and Economy (x1 and x2.docx
 
800 Words 42-year-old man presents to ED with 2-day history .docx
800 Words 42-year-old man presents to ED with 2-day history .docx800 Words 42-year-old man presents to ED with 2-day history .docx
800 Words 42-year-old man presents to ED with 2-day history .docx
 
8.1 What Is Corporate StrategyLO 8-1Define corporate strategy.docx
8.1 What Is Corporate StrategyLO 8-1Define corporate strategy.docx8.1 What Is Corporate StrategyLO 8-1Define corporate strategy.docx
8.1 What Is Corporate StrategyLO 8-1Define corporate strategy.docx
 
8.0 RESEARCH METHODS These guidelines address postgr.docx
8.0  RESEARCH METHODS  These guidelines address postgr.docx8.0  RESEARCH METHODS  These guidelines address postgr.docx
8.0 RESEARCH METHODS These guidelines address postgr.docx
 
95People of AppalachianHeritageChapter 5KATHLEEN.docx
95People of AppalachianHeritageChapter 5KATHLEEN.docx95People of AppalachianHeritageChapter 5KATHLEEN.docx
95People of AppalachianHeritageChapter 5KATHLEEN.docx
 
9 781292 041452ISBN 978-1-29204-145-2Forensic Science.docx
9 781292 041452ISBN 978-1-29204-145-2Forensic Science.docx9 781292 041452ISBN 978-1-29204-145-2Forensic Science.docx
9 781292 041452ISBN 978-1-29204-145-2Forensic Science.docx
 
8-10 slide Powerpoint The example company is Tesla.Instructions.docx
8-10 slide Powerpoint The example company is Tesla.Instructions.docx8-10 slide Powerpoint The example company is Tesla.Instructions.docx
8-10 slide Powerpoint The example company is Tesla.Instructions.docx
 
8Network Security April 2020FEATUREAre your IT staf.docx
8Network Security  April 2020FEATUREAre your IT staf.docx8Network Security  April 2020FEATUREAre your IT staf.docx
8Network Security April 2020FEATUREAre your IT staf.docx
 

Dernier

Sanyam Choudhary Chemistry practical.pdf
Sanyam Choudhary Chemistry practical.pdfSanyam Choudhary Chemistry practical.pdf
Sanyam Choudhary Chemistry practical.pdfsanyamsingh5019
 
Q4-W6-Restating Informational Text Grade 3
Q4-W6-Restating Informational Text Grade 3Q4-W6-Restating Informational Text Grade 3
Q4-W6-Restating Informational Text Grade 3JemimahLaneBuaron
 
The byproduct of sericulture in different industries.pptx
The byproduct of sericulture in different industries.pptxThe byproduct of sericulture in different industries.pptx
The byproduct of sericulture in different industries.pptxShobhayan Kirtania
 
Z Score,T Score, Percential Rank and Box Plot Graph
Z Score,T Score, Percential Rank and Box Plot GraphZ Score,T Score, Percential Rank and Box Plot Graph
Z Score,T Score, Percential Rank and Box Plot GraphThiyagu K
 
Advanced Views - Calendar View in Odoo 17
Advanced Views - Calendar View in Odoo 17Advanced Views - Calendar View in Odoo 17
Advanced Views - Calendar View in Odoo 17Celine George
 
Measures of Dispersion and Variability: Range, QD, AD and SD
Measures of Dispersion and Variability: Range, QD, AD and SDMeasures of Dispersion and Variability: Range, QD, AD and SD
Measures of Dispersion and Variability: Range, QD, AD and SDThiyagu K
 
Software Engineering Methodologies (overview)
Software Engineering Methodologies (overview)Software Engineering Methodologies (overview)
Software Engineering Methodologies (overview)eniolaolutunde
 
The Most Excellent Way | 1 Corinthians 13
The Most Excellent Way | 1 Corinthians 13The Most Excellent Way | 1 Corinthians 13
The Most Excellent Way | 1 Corinthians 13Steve Thomason
 
Separation of Lanthanides/ Lanthanides and Actinides
Separation of Lanthanides/ Lanthanides and ActinidesSeparation of Lanthanides/ Lanthanides and Actinides
Separation of Lanthanides/ Lanthanides and ActinidesFatimaKhan178732
 
Russian Call Girls in Andheri Airport Mumbai WhatsApp 9167673311 💞 Full Nigh...
Russian Call Girls in Andheri Airport Mumbai WhatsApp  9167673311 💞 Full Nigh...Russian Call Girls in Andheri Airport Mumbai WhatsApp  9167673311 💞 Full Nigh...
Russian Call Girls in Andheri Airport Mumbai WhatsApp 9167673311 💞 Full Nigh...Pooja Nehwal
 
Grant Readiness 101 TechSoup and Remy Consulting
Grant Readiness 101 TechSoup and Remy ConsultingGrant Readiness 101 TechSoup and Remy Consulting
Grant Readiness 101 TechSoup and Remy ConsultingTechSoup
 
Presentation by Andreas Schleicher Tackling the School Absenteeism Crisis 30 ...
Presentation by Andreas Schleicher Tackling the School Absenteeism Crisis 30 ...Presentation by Andreas Schleicher Tackling the School Absenteeism Crisis 30 ...
Presentation by Andreas Schleicher Tackling the School Absenteeism Crisis 30 ...EduSkills OECD
 
Accessible design: Minimum effort, maximum impact
Accessible design: Minimum effort, maximum impactAccessible design: Minimum effort, maximum impact
Accessible design: Minimum effort, maximum impactdawncurless
 
Interactive Powerpoint_How to Master effective communication
Interactive Powerpoint_How to Master effective communicationInteractive Powerpoint_How to Master effective communication
Interactive Powerpoint_How to Master effective communicationnomboosow
 
CARE OF CHILD IN INCUBATOR..........pptx
CARE OF CHILD IN INCUBATOR..........pptxCARE OF CHILD IN INCUBATOR..........pptx
CARE OF CHILD IN INCUBATOR..........pptxGaneshChakor2
 
mini mental status format.docx
mini    mental       status     format.docxmini    mental       status     format.docx
mini mental status format.docxPoojaSen20
 
Ecosystem Interactions Class Discussion Presentation in Blue Green Lined Styl...
Ecosystem Interactions Class Discussion Presentation in Blue Green Lined Styl...Ecosystem Interactions Class Discussion Presentation in Blue Green Lined Styl...
Ecosystem Interactions Class Discussion Presentation in Blue Green Lined Styl...fonyou31
 
POINT- BIOCHEMISTRY SEM 2 ENZYMES UNIT 5.pptx
POINT- BIOCHEMISTRY SEM 2 ENZYMES UNIT 5.pptxPOINT- BIOCHEMISTRY SEM 2 ENZYMES UNIT 5.pptx
POINT- BIOCHEMISTRY SEM 2 ENZYMES UNIT 5.pptxSayali Powar
 
The basics of sentences session 2pptx copy.pptx
The basics of sentences session 2pptx copy.pptxThe basics of sentences session 2pptx copy.pptx
The basics of sentences session 2pptx copy.pptxheathfieldcps1
 

Dernier (20)

Sanyam Choudhary Chemistry practical.pdf
Sanyam Choudhary Chemistry practical.pdfSanyam Choudhary Chemistry practical.pdf
Sanyam Choudhary Chemistry practical.pdf
 
Q4-W6-Restating Informational Text Grade 3
Q4-W6-Restating Informational Text Grade 3Q4-W6-Restating Informational Text Grade 3
Q4-W6-Restating Informational Text Grade 3
 
The byproduct of sericulture in different industries.pptx
The byproduct of sericulture in different industries.pptxThe byproduct of sericulture in different industries.pptx
The byproduct of sericulture in different industries.pptx
 
Z Score,T Score, Percential Rank and Box Plot Graph
Z Score,T Score, Percential Rank and Box Plot GraphZ Score,T Score, Percential Rank and Box Plot Graph
Z Score,T Score, Percential Rank and Box Plot Graph
 
Advanced Views - Calendar View in Odoo 17
Advanced Views - Calendar View in Odoo 17Advanced Views - Calendar View in Odoo 17
Advanced Views - Calendar View in Odoo 17
 
Measures of Dispersion and Variability: Range, QD, AD and SD
Measures of Dispersion and Variability: Range, QD, AD and SDMeasures of Dispersion and Variability: Range, QD, AD and SD
Measures of Dispersion and Variability: Range, QD, AD and SD
 
Software Engineering Methodologies (overview)
Software Engineering Methodologies (overview)Software Engineering Methodologies (overview)
Software Engineering Methodologies (overview)
 
Mattingly "AI & Prompt Design: Structured Data, Assistants, & RAG"
Mattingly "AI & Prompt Design: Structured Data, Assistants, & RAG"Mattingly "AI & Prompt Design: Structured Data, Assistants, & RAG"
Mattingly "AI & Prompt Design: Structured Data, Assistants, & RAG"
 
The Most Excellent Way | 1 Corinthians 13
The Most Excellent Way | 1 Corinthians 13The Most Excellent Way | 1 Corinthians 13
The Most Excellent Way | 1 Corinthians 13
 
Separation of Lanthanides/ Lanthanides and Actinides
Separation of Lanthanides/ Lanthanides and ActinidesSeparation of Lanthanides/ Lanthanides and Actinides
Separation of Lanthanides/ Lanthanides and Actinides
 
Russian Call Girls in Andheri Airport Mumbai WhatsApp 9167673311 💞 Full Nigh...
Russian Call Girls in Andheri Airport Mumbai WhatsApp  9167673311 💞 Full Nigh...Russian Call Girls in Andheri Airport Mumbai WhatsApp  9167673311 💞 Full Nigh...
Russian Call Girls in Andheri Airport Mumbai WhatsApp 9167673311 💞 Full Nigh...
 
Grant Readiness 101 TechSoup and Remy Consulting
Grant Readiness 101 TechSoup and Remy ConsultingGrant Readiness 101 TechSoup and Remy Consulting
Grant Readiness 101 TechSoup and Remy Consulting
 
Presentation by Andreas Schleicher Tackling the School Absenteeism Crisis 30 ...
Presentation by Andreas Schleicher Tackling the School Absenteeism Crisis 30 ...Presentation by Andreas Schleicher Tackling the School Absenteeism Crisis 30 ...
Presentation by Andreas Schleicher Tackling the School Absenteeism Crisis 30 ...
 
Accessible design: Minimum effort, maximum impact
Accessible design: Minimum effort, maximum impactAccessible design: Minimum effort, maximum impact
Accessible design: Minimum effort, maximum impact
 
Interactive Powerpoint_How to Master effective communication
Interactive Powerpoint_How to Master effective communicationInteractive Powerpoint_How to Master effective communication
Interactive Powerpoint_How to Master effective communication
 
CARE OF CHILD IN INCUBATOR..........pptx
CARE OF CHILD IN INCUBATOR..........pptxCARE OF CHILD IN INCUBATOR..........pptx
CARE OF CHILD IN INCUBATOR..........pptx
 
mini mental status format.docx
mini    mental       status     format.docxmini    mental       status     format.docx
mini mental status format.docx
 
Ecosystem Interactions Class Discussion Presentation in Blue Green Lined Styl...
Ecosystem Interactions Class Discussion Presentation in Blue Green Lined Styl...Ecosystem Interactions Class Discussion Presentation in Blue Green Lined Styl...
Ecosystem Interactions Class Discussion Presentation in Blue Green Lined Styl...
 
POINT- BIOCHEMISTRY SEM 2 ENZYMES UNIT 5.pptx
POINT- BIOCHEMISTRY SEM 2 ENZYMES UNIT 5.pptxPOINT- BIOCHEMISTRY SEM 2 ENZYMES UNIT 5.pptx
POINT- BIOCHEMISTRY SEM 2 ENZYMES UNIT 5.pptx
 
The basics of sentences session 2pptx copy.pptx
The basics of sentences session 2pptx copy.pptxThe basics of sentences session 2pptx copy.pptx
The basics of sentences session 2pptx copy.pptx
 

76 CHAPTER 4 Assessing Health and Health Behaviors Objecti.docx

  • 1. 76 CHAPTER 4 Assessing Health and Health Behaviors Objectives this chapter will enable the reader to: 1. Describe the expected outcomes of a nursing health assessment. 2. Identify the components of a nursing health assessment conducted for an individual client. 3. Examine life span, language, and culturally appropriate nursing health assessment tools for children, adults, and older adults. 4. Compare the similarities and differences among the various approaches to assessing the family, mindful of cultural influences. 5. Evaluate the criteria for conducting a screening in the community. 6. Compare the similarities and differences among the various approaches to assessing the community. Athorough assessment of health and health behaviors is the foundation for tailoring a health promotion-prevention plan. Assessment provides the database for making clinical judgments about the client’s health strengths, health problems, nursing diagnoses, desired health or behavioral outcomes, as well as the interventions likely to be effective. This information also forms the nature of the client–nurse partnership such as the frequency of con- tact and the need for coordination with other health professionals. The portfolio of assessment measures depends on the characteristics of the client, including developmental stage and cul- tural orientation. The nurse assesses age, language, and cultural appropriateness of the various measures selected. Cultural competence is the ability to communicate effectively
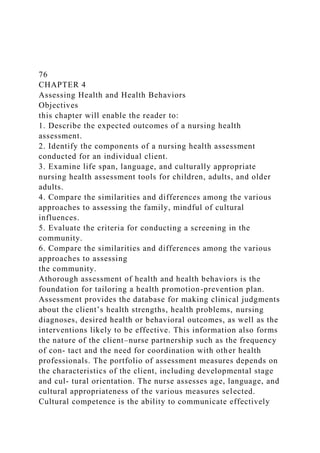
  • 2. with people of different cultures. Providing culturally competent care is the cornerstone of the nursing assessment. The nurse’s aware- ness of her own attitude toward cultural differences and her cultural worldview and characteristics Chapter4 • AssessingHealthandHealthBehaviors 77 are critical to her understanding and knowledge of various cultures. Recognizing that diversity exists in all cultures based on educational level, socioeconomic status, religion, rural/urban residence, and individual and family characteristics will ensure a more successful encounter (The Office of Minority Health, 2013). An online cultural educational program, designed specifically for nurses and featur- ing videotaped case studies and interactive tools, is available. The Enhanced National Standards for Culturally and Linguistically Appropriate Services, based on a definition of culture expanded to include geography, spirituality, language, race and ethnicity, and biology, provides a practical guide to culturally and linguistically sensitive care (The Office of Minority Health, 2013). Technology is having a significant impact on health care. The Electronic Health Record (EHR) promotes involvement of the client in developing a dynamic, tailored database. The EHR offers great promise to improve health and increase the client’s satisfaction with his care. Data aggregation, cross-continuum coordination, and clinical care plan management are critical com- ponents of the EHR. It allows storage and almost instantaneous access to data while improving quality and efficiency in health care and improving communication among providers, insurers, and consumers (Figure 4–1). Promising developments in EHRs are facilitating widespread usage. Among these are cooperation between health care providers and technology companies to create standards for seamless communication, regardless of vendor; cost subsidization of implementing EHRs to encourage physician usage; and incentives offered by Centers for Medicare and
  • 3. Medicaid Services (CMS). The Health Information Technology for Economic and Clinical Health (HITECH) Act of 2009 provides incentives to physicians and hospitals to make “meaningful use” of EHRs by meeting objectives that positively affect the care of their patients. For example, one objective states that more than 50% of patients who request an electronic copy of their health information should have it within three business days. Clients should be encouraged to request their elec- tronic health information so that they know what is in their record and can participate more fully in their care (CMS.gov, 2009). Data Aggregation · Data acquisition and exchange platforms for ADT feeds, claim,s and clinical data · Ability to import provider directory files · Algorithms and analytics for inclusion/exclusion criteria by population · Processes, algorithms for patient-provider attribution Cross-Continuum Coordination • Shared care plans • Activity tracking and real-time notification of encounters (ED, admission, discharge) • Disease registries • Health information exchanges • Enhanced communication aides for care team connectivity • Patient outreach and messaging Clinical Care Plan Management • EMR, case and utilization management systems • Workflow automation and rules engines • Assessment tools, clinical care protocols, and work lists • Analytics for high-risk patient identification • Telehealth and home monitoring capabilities FIGURE 4–1 IT Support for Care Management Progresses
  • 4. Beyond EHR Functionality Source: Comstock, J. Asthmapolis, now Propeller, moves beyond asthma. Mobilhealthnews. September 10, 2013; Propeller Health, available at http://propellerhealth.com/, accessed September 25, 2013. The Advisory Board Company interviews and analysis. 78 Part2 • PlanningforHealthPromotionandPrevention While there are many benefits of the EMR, there are also questions to answer about best practices for the successful implementation of patient-accessible EMRs. These questions include cost, security, privacy, consumer and provider education, and user-friendly systems. To over- come some of the current issues, researchers are investigating tamper-resistant and portable health folders and evidence-based designs to evaluate consumer health informatics (Chen, Lu, & Jan, 2012; Li, Lee, Jian, & Kuo, 2009). In addition, access to web-based portal links (electronic patient portals) for patients to view and modify their record encourages adoption by patients. Doctors who are more willing to open their doctors’ notes via secure Internet portals, and patients who take advantage of the opportunity to access them, create transparency between pro- viders and patients. This ensures more open communications and shared responsibility for the patient’s health. Most patients are willing to accept some compromises to privacy in order to have more access to their health records and to make records more transparent (Robert Wood Johnson Foundation, 2009). With the implementation of EMRs, computers are showing up in more and more health care settings. The introduction of computers into the examination room potentially is a barrier to meaningful provider/patient relationships. Health care providers should face the client while they are entering data, being careful to maintain eye contact and engagement with the client. To do otherwise is to focus on the technology, and not the client. The Personal Health Record (PHR) is a another application to help consumers take charge of their health and has the potential to improve care, lower costs, and help clients obtain and manage the care they need. The PHR belongs to the user and is
  • 5. distinct from physician records (Figure 4–2). Insurance Company · Claims data · Disease management profile · Medications · Risk score Data Sources for PHR Patient · Chronic condition management data, from patient or connected devices · Appointment requests · Allergies · Medications · Family history · Proxy access, consent data Personal Health Record FIGURE 4–2 PHRs: Allowing Patients to Actively Manage Their Data Company Interviews and Analysis, 2013. Provider · Physician visits · Hospitalizations · Lab, test results · Medications · Pre-visit intake forms · Reminders, messages · Billing information · Referral information Source: The Advisory Board Chapter4 • AssessingHealthandHealthBehaviors 79 GPS Device on Inhaler Provides Accurate Information on Asthma Complications Inhaler usage automatically tracked, shared with physician
  • 6. Physician reviews patterns and trends with patient during next scheduled visit Physician able to proactively reach out to patient between visits if usage increases Passive Tracking Improves Outcomes 80% Increase in medication adherence among users >66% Proportion of app users who were well-controlled Case in Brief: Propeller Health • Health care technology firm based in Madison, Wisconsin • Attachable GPS device for asthma and COPD inhalers sends real-time breathing and medication adherence data to provider FIGURE 4–3 New Technologies Fostering Self-Care Source: The Advisory Board Company Interviews and Analysis, 2013. CMS initiated a pilot PHR program in 2009 for clients to add supplemental information to their health record, authorize access to third parties such as family members, and track and view claims. The evaluation of this pilot showed the preferences of consumers to include download- able data, direct on-line communication between client and provider, simplified log-ins, and strong technical support. Nursing clinics, community health centers, and primary care centers are using EHRs, PHRs, and/or cell phone technology to offer comprehensive resources, including easily cus- tomized and self-managed online portfolios (see Figure 4–3). The smartphone, named one of the top medical trends for 2013, increases greatly the option of clients’ involvement in their health care. Governmental approval of mobile software applications such as ones that help clients monitor potential skin cancers, or that provide doctors with a mobile electrocar- diogram, are being promoted as ways to fight disease and get health care costs under control (ANA, SmartBrief, 2012). Social media such as Facebook and Twitter optimize communications with clients. Tai- lored health information, delivered through these new informatics interventions, has the poten- tial for enhancing self-efficacy, improving decision
  • 7. making, increasing healthy behaviors, and fostering self-care. The potential for consumers to be involved in the ownership and mainte- nance of their health record with “cradle-to-grave” information is especially relevant for com- puter users and technology-savvy consumers who interface with providers and health systems. Age, race, and culture are significant discriminators of computer/Internet home usage, with 65 and older people’s usage at 29.8% and all other age groups’ usage ranging from 55.2% to 62.6%. Whites (56.1%) are more likely to use a home computer to connect to the Internet than Blacks (41.7%) and Hispanics (35.4%) are. Age is the greatest influence on the focus of Internet searches; for example, persons 45 years and older conduct Internet searches about health care more 80 Part2 • PlanningforHealthPromotionandPrevention TABLE 4–1 Reported Activity of People Using the Internet, by Selected Individual Characteristics: 2010 Population age 15 and over Number in thousands Percent of those connected to the Internet who engage in each type of Internet activity Selected characteristics the Internet Take a course online healthcare services job Total connected to Search for Search about government Search for a Total 145,286 11.4 35.5 33.2 24.8 13.4 17.6 19.8 31.5 13.5 35.3 34.1 34.3 12.2 38.1 36.4 27.0 10.2 42.8 39.1 19.1 4.3 46.2 34.6 4.0
  • 8. 11.2 36.0 33.2 23.6 11.4 37.0 33.8 23.1 12.0 30.1 30.9 32.3 9.7 27.5 27.8 27.9 10.9 29.6 32.0 25.1 11.8 41.0 34.3 24.5 11.6 36.1 33.4 24.5 8.8 27.1 27.6 26.3 11.5 37.9 37.7 28.6 Age 15–24 years 25–34 years 35–44 years 45–64 years 65 years and over Race and Hispanic Origin 30,687 27,963 26,471 47,917 12,248 White 119,892 Non-Hispanic 106,947 Black 14,953 Hispanic 14,309 (of any race) Gender Male 70,229 Female 75,057 Language spoken at home Speaks English only at home Speaks Spanish at home Speaks other language at home 126,776 11,141 7,368 Source: U.S. Department of Commerce. 2010 Census Report frequently than do those under 45 (Table 4–1; U.S. Department of Commerce Census, 2012). Non-computer users and vulnerable populations are at greater risk, which may exacerbate health disparities unless a safeguard system protects these groups. Safeguards include developing the concept of health care partners, opportunities for clients to access a computer, and staff available to enter information at the client’s request. Another technology making a significant impact on health care is telehealth, the use of electronics and telecommunications to support long-distance care. Health assessment occurs in a variety of settings including hospitals, clinics, offices, community centers, schools, and Chapter4 • AssessingHealthandHealthBehaviors 81
  • 9. FIGURE 4–4 Telehealth Improves Access to Care Source: http://www.telehealth.va.gov homes; and the home is becoming a primary setting for assessing and delivering health services due in large measure to telehealth. The Veterans Administration is a major player in funding, developing, and using telehealth. As technology improves and cost decreases, telehealth is likely to have an even greater impact on health care (Figure 4–4). Three points are spurring adoption of telehealth: • Governmentalsupportandintegrationintoaccountablecareorganiza tions • Consumerdemand • Technologicalinnovation NURsING FRAmEwoRks FoR HEALTH AssEssmENT Health assessment performed by the nurse is a collaborative partnership with the client that pro- motes mutual input into decision making and planning to improve the client’s health and well- being. The initial assessment provides a valuable baseline to compare subsequent assessments. The desired outcomes describe the following: 1. Health assets 2. Health problems 3. Health-related lifestyle strengths 4. Key health-related beliefs 5. Health behaviors that put the client at risk 6. Changes that improve the quality of life Nursing frameworks are available for nurses to assess and diagnose health and health behaviors. Nursing assessment is the systematic collection of data about a client’s health status, beliefs, and behaviors relevant to developing a health promotion-prevention plan, whereas nurs- ing diagnosis is the identification and enhancement of assessment to maximize health status. 82 Part2 • PlanningforHealthPromotionandPrevention Nursing diagnostic classification systems (taxonomies) primarily focus on the individual and aspects of illness. Hence,
  • 10. positive health states (or strengths) of the individual, family, or community are not always adequately addressed in these taxonomies. As health promotion and prevention knowledge expands, taxonomies continue to include new definitions supportive of a health promotion/wellness perspective. The North American Nursing Diagnosis International (NANDA- I) nursing diagnosis tax- onomy responds to the nine human response patterns: exchanging, communicating, relating, valuing, choosing, moving, perceiving, knowing, and feeling (National Association of Nursing Diagnosis-International, 2013). The defining characteristics of each diagnosis, as well as related factors and risk factors, provide guidance about the critical assessment areas for the diagnosis. The NANDA-I classification provides a way to diagnose and intervene in selected health promo- tion and wellness processes and problems across the span of nursing practice (Popkess-Vawter, 2008). For example, stress overload occurs when the client presents feelings of tension and pres- sure that interfere with effective decision making, resulting in physical or psychological distress. Potential interventions, including active listening and decision-making support, address the stress overload diagnosis (Lunney, 2008). Other examples of wellness nursing diagnoses/processes (client strengths) include the following: 1. Nutrition adequate to meet or maintain body requirements 2. Exercise level appropriate to maintain wellness state 3. Strength derived from one’s spirituality Case studies and sample care plans are available to illustrate how diagnostic statements provide direction for health promotion-prevention care planning. Gordon (2009) grouped the NANDA-I diagnoses into 11 functional health patterns to assist in classifying nursing diagnoses: 1. Health perception–health management 2. Nutritional– metabolic 3. Elimination
  • 11. 4. Activity–exercise 5. Sleep–rest 6. Cognitive–perceptual 7. Self-perception–self-concept 8. Role–relationship 9. Sexuality–reproductive 10. Coping–stress tolerance 11. Value–belief Gordon provides guidelines to conduct a nursing history and examination to assess clients’ functional health patterns. As assessment proceeds, diagnostic hypotheses generate targeted or more detailed data collection. Refer to Gordon’s Manual of Nursing Diagnosis for recommended formats to assess functional health patterns in infants and young children, adults, families, and communities (Gordon, 2009). The Omaha Visiting Nurse Association System is a useful guide for community health nurs- ing practice, a method of documentation, and a framework for community management. The Omaha System incorporates the needs of individuals and families in the categories of environ- ment, psychosocial, physiological, and health behavior needs. These categories use key words such Chapter4 • AssessingHealthandHealthBehaviors 83 as individual, family, or health promotion in the individual and family categories. Nurse research- ers have shown the usefulness of the Omaha System in quantifying nursing practice in community health, rural nursing practice, primary care, and wellness centers. A difficulty in developing nurs- ing classification systems for communities is that nursing diagnoses/problem classifications focus on nursing practice, whereas community problems focus more on interdisciplinary practice. Nursing Interventions Classification (NIC), a system that generates standardized nursing actions and interventions for providing care, is relevant for community health because nursing services are categorized and linked to direct reimbursement (Bulechek, Butcher, Dochterman, & Wagner, 2013). However, NIC does not have categories for the health
  • 12. behaviors of communities. The Nursing Outcomes Classification (NOC) system measures the responses of an individual, family, and community behavior/perception to a nursing intervention and is useful in all settings with individuals, families, and communities (Moorhead, Johnson, Maas, & Swanson, 2013). The next phase of knowledge generation in nursing is the integration of terminologies into EHR information systems to support standards of care across settings worldwide. Integration will make it easier to describe and share interventions that work or do not work to help people be healthy and reduce costs. Research using data from information systems embedded with nursing standards and terminology builds nursing knowledge and documents the contribution of nursing to health care. GUIdELINEs FoR PREvENTIvE sERvIcEs ANd scREENINGs An increasing emphasis on the prevention of disease has resulted in the development of varying sets of guidelines for the delivery of preventive services to individuals, families, and communities across the life span. These guidelines focus on clinical care directed toward prevention of specific diseases such as HIV disease and behavioral morbidity such as substance abuse. The Guide to Clinical Preventive Services (U.S. Preventive Services Task Force, 2012) is an authoritative source for making decisions about preventive services. In 2009, the U.S. Preventive Services Task Force (USPSTF) recommended limiting the use of screening mammography. The recommendation garnered the media’s attention and, according to one study, the percentage of women screened the year following the recommendation declined by 4.3%, suggesting that the recommendation had a chilling effect on the willingness of women to get mammograms. How- ever, Block and colleagues examined data from the Behavioral Risk Factor Surveillance Study and observed no change in rates among women who had mammograms the previous year, but did observe lower rates of mammogram use among women who reported no mammogram in the previous year (Block, 2013).
  • 13. Other experts report 1.3 million overdiagnosed breast cancers over 30 years, meaning that their screening detected tumors that would never lead to clinical symptoms (Bleyer & Welsh, 2012). However, the American Cancer Society and the American Radiology Association continue to recommend that women undergo a yearly mammogram beginning at age 40. Screening is not right for everyone or every health problem. Screenings to detect particular, unrecognized health problems in individuals who are members of at-risk groups reduce false alarms. However, data are not sufficient to address all the uncertainties of general screenings. Screenings uncover health problems in an efficient and economically feasible manner when the following factors are present: 1. The specific population has a high prevalence of the disease or health problem. 2. Treatment is available if the condition is identified. 3. Screening instruments are valid and reliable. 84 Part2 • PlanningforHealthPromotionandPrevention The cost of conducting screenings bears on the decision to offer large-scale screenings. For example, conducting a screening to detect osteoporosis requires special equipment, and the cost may be high due to the number of machines needed to screen in a timely, efficient manner. In addition to cost, targeted screenings should consider race/ethnicity, age, and low income and how these factors relate to increased or decreased willingness to participate in screenings, along with the risks and benefits (Kressin, Manze, Russell, Katz, Claudio, Green, & Wang, 2010). Elective Preventive Services Selector (ePSS) is a quick, hands- on tool available to pri- mary care providers to identify screening services that are appropriate for particular clients based on the recommendations of the U.S. Preventive Services Task Force, and can be searched by client characteristics, such as age, sex, and behavioral risk factors. ePSS is available as Web and Mobile applications for the iPhone, iPad, and other
  • 14. mobile devices. Through these appli- cation nurses and other clinicians have preventive information—recommendations, clinical considerations, and selected practice tools—available at the point of care (U.S. Preventive Ser- vices Task Force, 2012). Guide to Clinical Preventive Services (U.S. Department of Commerce Census, 2012) and Bright Futures: Guidelines for Health Supervision of Infants, Children, and Adolescents (Hagan, Shaw, & Duncan, 2008) also are important guidelines for nurses to be familiar with and use to ensure that clients across the life span benefit from state-of-the-art preventive services. AssEssmENT oF THE INdIvIdUAL cLIENT Assessment of the individual client in the context of health promotion extends beyond physical assessment to include a comprehensive examination of other health parameters and health behaviors. The purpose of the assessment, setting, culture, and age determine the components of health assessment. The components are as follows: • Functionalhealthpatterns • Physicalfitness • Nutrition • Lifestress • Spiritualhealth • Socialsupportsystems • Healthbeliefsandlifestyle Functional assessment of health patterns comprises a health history, including hereditary and family characteristics, and physical assessment. Assessment components focus on individu- als and have particular relevance for health promotion and prevention. Physical Fitness Physical activity is an important part of personal health status (see Chapter 6). Determining one’s level of physical fitness is a critical part of the nursing assessment. A sedentary lifestyle, for many individuals, begins early in childhood and continues into adulthood. The assess- ment is applicable to clients of all ages, with restrictions on some components for physically
  • 15. compromised individuals. Skill-related physical fitness and health-related physical fitness focus on different qualities. Skill-related fitness focuses on qualities that contribute to successful athletic performance: agility, speed, power, and reaction time. Health-related fitness focuses on qualities that contribute Chapter4 • AssessingHealthandHealthBehaviors 85 to general health and include cardio-respiratory endurance (aerobic capacity); muscular endur- ance, strength, and flexibility; and body composition. cARdIo-REsPIRAToRy (cR) ENdURANcE (AERoBIc cAPAcITy). Aerobic capacity is the most important component of fitness. Fitness reflects the ability of the CR system to efficiently adjust to and recover from exercise. Research shows that individuals with an acceptable aerobic capacity have a reduced risk of obesity, diabetes, high blood pressure, and other health problems. mUscULAR ENdURANcE, sTRENGTH, ANd FLExIBILITy. The goal of muscular endurance, strength, and flexibility tests is to determine the functional health status of the musculoskeletal system. It is important to have strong muscles that maintain body structure and endurance. The strength and endurance of the upper body muscles are good indicators of overall fitness. Flexibil- ity, the ability to move muscles and joints through their maximum range of motion, also is an important component of physical fitness. Flexibility decreases with age and chronic illness. The lack of ability to flex or extend muscles or joints often reflects poor health habits, such as seden- tary lifestyle, poor posture, or faulty body mechanics. Loss of flexibility greatly decreases one’s ability to move about with ease and comfort. Body comPosITIoN. The increased prevalence of overweight and obesity in children and adults in the United States is a concern for both the public and private sectors. The availability of high-fat and low-cost fast foods and the decline in levels of physical activity contribute to these trends. Increased levels of
  • 16. body fat are associated with cardiovascular disease, diabetes, and stroke in adults; and diabetes, hypertension, and increased cholesterol levels occur more frequently in overweight and obese children. Estimates of body fat include underwater weighing, bioelectrical impedance, skin fold measures, and other anthropometry measures such as the Body Mass Index (BMI). Each method has limitations leading to measurement errors of 2% to 3% for estimates of body fat, with the BMI error rate as great as 6% because body weight includes bone and muscle mass and not just fat composition. Bioelectrical impedance analysis (BIA) provides a measure of body fat when a small, safe electrical current passes through the body, carried by water and electrolytes of the fluid spaces. Impedance is greatest in fat tissue, which contains only 10 to 20% water, while muscle tissue, which contains 70 to 75% water, allows the signal to pass more easily. Height and weight, body type, gender, age, fitness level, and BIA are measures used to calculate percentage of body fat, muscle mass, and hydration level (American College of Sports Medicine, 2009). BIA is useful in healthy, young, normally hydrated teens and adults, and for monitoring these groups for changes in body fat composition over time. Body fat scales (similar to bathroom scales) and handheld body fat analyzers, both available at reasonable cost, also provide a measure of BIA. While technology is improving, it is difficult to get an accurate body fat composition from commercially available body fat analyzers. Anthropometric (measures of body fat) methods are simple, convenient, and inexpensive. Skin fold estimates, conducted while maintaining standards and using high-quality skin fold calipers, provide an accurate measure of body fat and compare favorably with bioelectrical impedance. The combination of weight, anthropometric methods, and BIA is an excellent predic- tor of total body fat composition. A physical fitness assessment is an essential component of health assessment. Careful atten- tion to assessment will
  • 17. optimize the fit of the exercise prescription to the physical capabilities of 86 Part2 • PlanningforHealthPromotionandPrevention the client. The Presidential Youth Fitness Program adopted FITNESSGRAM, a research-based assessment developed by the nonprofit Cooper’s Institute, and recommends implementation in all public schools. The FITNESSGRAM program assesses cardiovascular fitness, body composi- tion, muscle strength, muscular endurance, and flexibility in children 4 to 17 years of age. The American College of Sports Medicine (ACSM) Resource Manual for Guidelines for Exercise Testing and Prescription (American College of Sports Medicine, 2013) is an excellent guide for physical fitness assessment tools for adults. Nutrition Good nutrition is one of the primary determinants of good health. Effective planning for health promotion requires an assessment of the nutritional status of the client to establish a baseline. Anthropometrical measurements and/or BIA analysis, laboratory values, and dietary history are useful assessment tools. Anthropometrics assessment measures include height and weight, circumference of various areas of the body, and skin- fold thickness. BMI is the best method to assess healthy weight (American College of Sports Medicine, 2013). BMI does not assess body fat composi- tion or fat distribution, but it is a useful screening tool for overweight or obesity. It has been determined that childhood BMI is associated with adult adiposity. The classification of over- weight and obesity by BMI, waist circumference, and associated disease risks standards for adults is available in Table 4–2. Healthy and unhealthy weight guidelines are in Table 4–3. The waist-to-hip ratio assesses the amount of fat distributed in the abdomen versus fat distributed below the waist. The ratio is the waist circumference over the hip circumference. The higher the value of the waist-to-hip ratio, the greater the potential that health problems are present or will occur (American College of
  • 18. Sports Medicine, 2013; WHO Expert Consultation, 2008). Biochemical analyses of blood and urine help to identify nutritional deficiencies. In addi- tion to laboratory tests for cholesterol, triglycerides, glucose, and high-density lipoproteins, tests for protein (creatinine index, serum protein, serum albumin, total lymphocyte count, blood urea nitrogen, uric acid), serum or plasma vitamin levels (water-soluble, fat- soluble), and minerals (calcium, sodium, potassium, iron, phosphorus, magnesium) are used to assess TABLE 4–2 Normal† Overweight Obesity Classification of Overweight and Obesity by BMI, Waist Circumference, and Associated Disease Risk* Disease Risk* Relative to Normal Weight and Waist Circumference BMI (kg/m2) 18.5–24.9 25.0–29.9 30.0–or above Men $ 40 in. Women $ 35 in. — Increased High Men . 40 in. Women . 35 in. — High Very High *Disease risk for type 2 diabetes, hypertension, and CVD. †Increased waist circumference can also be a marker for increased risk even in persons of normal weight. Source: Adapted from Preventing and Managing the Global Epidemic of Obesity. Report of the World Health Organization Consultation of Obesity. WHO, Geneva, June 1997. http://www.nhlbi.nih.gov/guidelines/obesity/e_txtbk/txgd/411.ht m Chapter4 • AssessingHealthandHealthBehaviors 87 TABLE 4–3
  • 19. Healthy and Unhealthy Weight Guidelines Are you at a healthy weight? Height* BMI 18.5 25 30 6' 6" 6' 5" 6' 4" 6' 3" 6' 2" 6' 1" 6' 0" 5' 11" 5' 10" 5' 9" 5' 8" 5' 7" 5' 6" 5' 5" 5' 4" 5' 3" 5' 2" 5' 1" 5' 0" 4' 11" 4' 10" 50 75 100 125 150 Overweight Obesity 175 200 225 250 Pounds† Healthy Weight * Without shoes. 275 † Without clothes. The BMI (weight-for-height) ranges shown are for adults. They are not exact ranges of healthy and unhealthy weights. However, they show that health risk increases at higher levels of overweight and obesity. Even within the healthy BMI range, weight gains can carry health risks for adults. Directions: Find your weight on the bottom of the graph. Go straight up from that point until you come to the line that matches your height. Then look to find your weight group. BMI of 24.9 defines the upper boundary of healthy weight. BMI of 25 to 29.9 defines overweight. BMI of 30 or higher defines obesity. Source: Report of the Dietary Guidelines Advisory Committee on the Dietary Guidelines for Americans. (2000). http:// www.cnpp.usda.gov/Publications/DietaryGuidelines/2000/2000
  • 20. DGCommitteeReport.pdf, p. 11. nutritional status. Three particularly important values in assessing nutritional status are serum albumin less than 3.5 g/dL, total lymphocyte count less than 1800/mm3, and an involuntary loss of body weight greater than 15%. These three indicators correlate significantly with nutri- tional status (Gupta & Lis, 2010; Nishida & Sakakibara, 2010). The dietary diary, available as either a paper or Web-based option, is one common measure used to assess nutritional status. SuperTracker, a diet planning and tracker tool is a Web-based dietary assessment that is easy to access and use. It incorporates both the 2010 Dietary Guidelines for Americans and the 2008 Physical Activity Guidelines. After the client, or nurse, enters the 88 Part2 • PlanningforHealthPromotionandPrevention requested dietary information, the results are a part of a tailored nutrition plan that empowers the client to make healthier food choices. ChooseMyPlate also has a Spanish-language food icon MiPlato to guide Spanish-speaking consumers in making healthy food choices. With the paper option dietary diary, clients keep a record of everything eaten for three days during the week prior to their office or home visit. Daily food choices, compared with published daily food guides or a computerized dietary analysis package, identify unusual or poor dietary patterns (see Nutrition and Health Promotion, Chapter 7). The nurse and nutritionist work together to prepare materials and/or recommend websites to ensure that the client has the latest and most accurate research findings about nutritional supplements, including vitamins and min- erals (calcium, iron) as well as proteins and complex carbohydrates. Tools for assessing nutrition in primary care settings are available. Culture and socioeconomic level influences eating patterns, obesity, and malnutrition. Assessment of nutritional status and dietary habits is a critical part of comprehensive health
  • 21. assessment for individuals, families, and specific target groups, such as high-school students, pregnant women, and the elderly. An analysis of assessment data determines which interventions are most appropriate to improve the nutritional status of the client/family. Understanding cul- tural influences on nutrition and dietary patterns is essential in both assessment and intervention to affect change. Life stress Stress is a potential threat to mental health and physical well- being and is associated with ill- nesses such as cardiovascular disease, cancer, and gastrointestinal disorders, as well as depres- sion, poor sleep patterns, and inability to carry out daily activities at an effective level. Life stress is a part of a comprehensive health assessment. Assessment begins with helping the cli- ent identify sources of stress. One strategy is to have the client write down the issues, con- cerns, and challenges that trigger stress responses in his or her life. Some of the stressors will be internal, and others will be external events. External stressors are events and situations that happen to individuals. Examples of external stressors include the following: 1. Some events may be happy ones such as marriage, birth of a child, and a new home, while some may be negative, such as death of a loved one, loss of a job, and an unplanned preg- nancy. Stress results from both positive and negative events. 2. The interaction between the individual and the environment involves subjective perception and assessment of stressors. Common events—such as a barking dog, a crying baby, and extreme weather conditions—may cause stress. 3. Much of life is unpredictable, and one’s personality influences responses to change and unplanned-for events. Unpredictable events include dealing with unexpected house guests, increased rent, or a sick child. 4. Family stressors include conflicts and arguments between children and spouses, issues resulting from the health problems of family members, and multigenerational households.
  • 22. 5. Common stressors in the workplace include long working hours, difficult coworkers, and urgent deadlines. 6. Social stressors include commitments to family, friends, and organizations balanced with the need for downtime for oneself, and pressure from peers. Internal stressors are self-induced thoughts and feelings that lead to unrest and anxiety. Chapter4 • AssessingHealthandHealthBehaviors 89 Examples of internal stressors include the following: 1. Common fears such as flying, heights, and public speaking. 2. The inability to predict behaviors such as use of alcohol and not knowing the outcome of medical tests. 3. Attitudes and expectations exhibited toward job loss or unexpected guests. Despite the high prevalence of stress-related health problems, including substance abuse, primary care providers screen too few clients for these problems. Regular screenings enable ear- lier identification of problems and earlier treatment. Screening tools include the following: sTREss scALEs. Assessing a person’s vulnerability to stress and strength to cope provides an essential measure of mental and physical well-being. The Derogatis Stress Profile (Derogatis & Lazarus, 1997) assesses personal and professional stress in adolescents and adults. The Perceived Stress Scale (Cohen, Kessler, & Gordon, 1997) measures moods and feelings about life stressors and is considered a measure of global stress. HAssLEs ANd UPLIFTs. Hassles are the irritating, frustrating, distressing demands such as traffic jams, losing items, and arguments that characterize everyday life. Uplifts, the counterpart of hassles, are the positive experiences or joys of life, such as getting a good night’s rest, receiving an email from a friend, or spending time with a pet. The assessment of daily hassles and uplifts is a better predictor of health or illness than
  • 23. the usual assessment of life events. An example of a hassles and uplifts scale is the Adolescent Hassle Scale (AHS; Wright, Creed, & Zimmer-Gembeck, 2010). ANxIETy INvENToRy. Anxiety level is a part of the life-stress review. The State-Trait Anxiety Inventory consists of 20 items that assess the extent of anxiety one feels at that moment (state anxiety) and 20 items that assess how one generally feels (trait anxiety; Spielberger, Gorsuch, Lushene, & Vagg, 1983). A State-Trait Anxiety Inventory is available for children (“How I Feel Questionnaire”; Spielberger et al., 1983). Both instruments and administration manuals are avail- able from Mind Garden, Palo Alto, California. sTREss wARNING sIGNALs INvENToRy. Clients should understand and be aware of the symptoms of an elevated stress level. When clients are aware of their own stress signals, they can use stress-management techniques (see Chapter 8) more effectively. Symptoms of stress may be physical, behavioral, emotional, or cognitive as shown in Figure 4–5. coPING mEAsUREs. Coping is an individual’s ongoing efforts to manage specific internal and external demands that exceed personal resources. A commonly used tool to measure coping is the Ways of Coping Questionnaire developed by Folkman and Lazarus (1988). The scale mea- sures both the emotion- and problem-focused coping strategies an individual uses when respond- ing to a stress situation. The Schoolager’s Coping Strategies Inventory is used to measure the type, frequency, and effectiveness of children’s stress-coping strategies, and additional instruments to measure stressors in children are available [Ryan-Wenger, Wilson (Sharrer), & Broussard, 2012]. The Patient Health Questionnaire (PHQ-2) is a two item- screening test that consists of the first two questions of the Patient Health Questionnaire (PHQ-9) tool to assist providers with diagnosing depression. The client that answers positively to one or both of the two items (PHQ-2) then answers the remainder of the seven items on the PHQ-9 (Li, Friedman, Conwell, & Fiscella, 2007). The PHQ-2 is effective in screening
  • 24. large groups to detect undiagnosed depression in a variety of populations. 90 Part2 • PlanningforHealthPromotionandPrevention Headaches Indigestion Stomachaches Sweaty palms Sleep difficulties Dizziness Excess smoking Bossiness Compulsive gum chewing Attitude critical of others BEHAVIORAL SYMPTOMS EMOTIONAL SYMPTOMS Back pain Tight neck, shoulders Racing heart Restlessness Tiredness Ringing in ears Grinding of teeth at night Overuse of alcohol Compulsive eating Inability to get things done Overwhelming sense of pressure Anger Loneliness Unhappiness for no reason Easily upset Inability to make decisions Thoughts of running away Constant worry Loss of sense of humor Stress Warning Signals PHYSICAL SYMPTOMS Crying Nervousness, anxiety Boredom—no meaning to things Edginess—ready to explode Feeling powerless to change things Trouble thinking clearly Forgetfulness Lack of creativity Memory loss COGNITIVE SYMPTOMS Do any seem familiar to you? Check the ones you experience when under stress. These are your stress warning signs. Are there any additional stress warning signals that you
  • 25. experience that are not listed? If so, add them here. FIGURE 4–5 Stress Warning Signals Source: From Benson, H., & Stuart, E. M. 1992. The Wellness Book. New York, NY: Citadel Press/Kensington Publishing Corp. All rights reserved. Reprinted by arrangement with Citadel Press/Kensington Publishing Corp. See Instruments for Clinical Healthcare Research (Frank- Stromborg, 2004) for a review of instruments on stress, coping, and anxiety and the relevance of each measure to nursing. spiritual Health Spiritual health is the ability to develop one’s inner being to its fullest potential. Spiritual health includes the ability to discover and articulate one’s basic purpose in life; to learn how to experience love, joy, peace, and fulfillment; and to help oneself and others achieve their fullest potential. Chapter4 • AssessingHealthandHealthBehaviors 91 The assessment of spiritual health is critical in a holistic approach to health as spiritual beliefs affect a client’s interpretations of life events and health. Acquiring a better understanding of clients’ spiritual needs will enable health care providers to develop tailored and effective spiritual interventions (Monod, Rochat, Bula, & Spencer, 2010). Examples of spirituality measures include the following: · The Spiritual Needs Assessment for Patients (SNAP) is a 23- item multidimensional survey instrument to describe and measure spiritual needs (Galek, Flannelly, Vane, & Galek, 2012). · The Spiritual Involvement and Beliefs Scale (SIBR) measures actions as well as beliefs across religious traditions (Litwinczuk & Groh, 2007). This instrument and the previous one provide supportive data for understanding the client’s spiritual beliefs and their impact on health needs and care. · The Spiritual Perspective Scale (SPS) is a 10-item instrument that measures one’s percep- tions of the extent to which one’s spiritual beliefs and one’s daily interactions are consistent
  • 26. (Chung, Wong, & Chan, 2007). Additional measures are available in Instruments in Clinical Healthcare Research (Frank-Stromborg, 2004). social support systems Two approaches for reviewing the social support networks of clients are useful in providing the client and nurse increased insight into existing support resources. When assessing the adequacy of support systems, it is important to be cognizant of factors that may cause the assessments to vary. Such things as the client’s culture, age, social context (school, home, work), and role context (parent, student, professional) influence perceived and received support. Using the Internet to expand one’s social contacts is increasing in popularity and can be included in assessing the cli- ent’s social support system. Definitive measures for assessing social support are abundant in the literature. They can also be found on educational websites, such as Stanford University. sUPPoRT sysTEms REvIEw. One straightforward, useful approach to assess support systems is to ask the client to list individuals who provide informational, emotional, appraisal, or instru- mental support. Then ask the client to indicate the relationship with the persons listed. Next, identify persons who have been sources of support for five years or more. This list enables the client to become aware of the stability of personal support systems. Last, identify the frequency and types of contacts. These may be face-to-face or telephone and e-mail communication. Exam- ining the social network enables the client and the nurse to assess the adequacy of support. If it is inadequate, generate strategies to enhance existing social networks. Figure 4–6 shows a sample of a completed support system review. After reviewing the client’s social support systems, explore the following questions: • Inwhatareasdoyouneedmoresupport:informational,emotional,inst rumental,appraisal? •
  • 27. Whowithinyourpresentsupportsystemmightprovidetheneededsup port? • Whoelsedoyouthinkneedstobecomeapartofyoursupportsystem? • Whatcanyoudotoaddthepeopleyoubelieveyouneedtoyoursupports ystem? Answers to these questions suggest actions the client can take to expand sources of per- sonal support. 92 Part2 • PlanningforHealthPromotionandPrevention List individuals who provide support to you. Next indicate the following relationships: Family member (FM); Fellow worker (FM); or Social Acquaintance (A). Frequency of Contact: Daily (D); Weekly (W); Monthly (M); or Rarely (R). Types of Contact: Face-to- Face (F); Telephone (T); or Email (EM). If individual has been supportive for 5 years or more, place the number 5. Individual Relationship Frequency Type D F D F D F W T Time 5 5 5 5 - - 5 - 5 John FM (husband) Peter FM (son) Helen FM (daughter) Ted FM (father) Andrew FW D F Frances FW Rose FW Elsa A Jack A W F W T M E M E Ask the client to identify the type of support provided by individuals in the list. They may provide more than one type of support.
  • 28. Sources of Emotional Support FAMILY WORK John Frances Peter Rose Helen Andrew Ted SOCIAL GROUP Elsa Jack Sources of Instrument Support FAMILY WORK SOCIAL GROUP John Andrew Jack Ted Sources of Information Support FAMILY WORK SOCIAL GROUP John Andrew Ted Rose Jack Sources of Appraisal Support FAMILY WORK SOCIAL GROUP John Rose Elsa FIGURE 4–6 Support System Review: Social Network and Type of Support EmoTIoNAL sUPPoRT dIAGRAm. Diagrams are effective ways to assess the strength and sources of support. Figure 4–7 presents a sample emotional support diagram that indicates strong, moderate, and weak sources of support, as well as current conflicts with supportive indi- viduals. The length of each line indicates geographical proximity to the client. This approach is particularly appropriate for clients who need a visual presentation of their emotional support system to take action to sustain or enhance emotionally satisfying relationships. An integral part of the assessment is a review of sources of social support. A review enables the client to recognize current sources of support and identify barriers in social rela- tionships that may block desirable health actions. The nurse must always be alert to client Chapter4 • AssessingHealthandHealthBehaviors 93 FIGURE 4–7 Emotional Support Diagram for Client situations in which social support is minimal or nonexistent. Extensive review of support systems may cause anxiety and depression, and in this case, a more informal, nonthreatening
  • 29. approach is useful. Social support instruments represent the broad spectrum of measures used in clinical settings as well as research. The Social Support Questionnaire is a six-item measure of per- ceived social support and satisfaction with social support. Each item presents a specific sce- nario for which respondents list the people who would be available for support in that situation. Respondents are also asked to rate their satisfaction with the support available (Sarason, Shearin, Pierce, & Sarason, 1987). Lifestyle Assessment In the context of health, lifestyle defines discretionary activities that are a regular part of one’s daily pattern of living and significantly influences health status. Health-promoting behavior is an expression of the human actualizing tendency that optimizes well-being, personal fulfill- ment, and productive living. The 52-item Health-Promoting Lifestyle Profile II (HPLP-II), a revision of the original instrument, consists of six subscales to measure major components of a health promoting lifestyle: health responsibility, physical activity, nutrition, interpersonal rela- tions, spiritual growth, and stress management. Scores are obtained for each subscale, or a total scale score is calculated to measure overall health-promoting lifestyle (Sechrist, Walker, 94 Part2 • PlanningforHealthPromotionandPrevention TABLE 4–4 Health-Promoting Lifestyle Profile II: Subscales and Sample Subscale Items Subscale Health responsibility Physical activity Nutrition Interpersonal relations Spiritual growth Stress management Sample Item Read or watch TV programs about improving my health. Question health professionals in order to understand their instructions. Exercise vigorously for 20 or more minutes at least three times
  • 30. a week (brisk walking, bicycling, aerobic dancing, using a stair climber). Get exercise during usual day activities (such as walking during lunch, using stairs instead of elevators, parking car farther away from destination and walking). Choose a diet low in fat, saturated fat, and cholesterol. Eat 2 to 4 servings of fruit each day. Spend time with close friends. Settle conflicts with others through discussion and compromise. Feel connected with some force greater than myself. Am aware of what is important to me in life. Take some time for relaxation each day. Pace myself to prevent fatigue. Pender, & Frank-Stromborg, 1987). The HPLP-II provides important information about a client’s lifestyle. Sample items for each of the subscales appear in Table 4–4. A HPLP-II profile provides information to develop an individualized health promotion plan that identifies life- style strengths and resources as well as areas for further growth. A Spanish-language version of the HPLPII is available. The Adolescent Lifestyle Profile (ALP) measures seven domains of health-promoting lifestyle (Hendricks, Murdaugh, & Pender, 2006) and is useful for measuring health-promoting behaviors in adolescents. Additional lifestyle instruments are available at educational websites, including Stanford University. sTAGE oF cHANGE AssEssmENT. Clients may be at one of several stages in relation to any given behavior change. Table 4–5 shows the stages of change for positive health behaviors. Recognizing the different stages of change in relation to various health behaviors allows for more tailored interventions. TABLE 4–5 True–False Statements for Assessing Stages of Behavior Change 1. I currently do not (specify exact behavior, e.g., exercise 30 minutes three times a week, eat 2 to 4 servings of fruit daily) and do not intend to start in the next 6 months.
  • 31. (Precontemplation) 2. I currently do not (specify behavior), but I am thinking about starting to do so in the next 6 months. (Contemplation) 3. I have tried several times to (specify behavior) but am seriously thinking of trying again in the next month. (Planning) 4. I have (specify behavior) regularly for less than 6 months. (Action) 5. I have (specify behavior) regularly for more than 6 months. (Maintenance) AssEssmENT oF THE FAmILy The contemporary family and the reciprocal influence of family health on individual family members reconfirm the family as the primary social structure for health promotion. Health- promoting as well as health-damaging behaviors and lifestyles learned and reinforced within the context of the family are powerful mediating factors in determining how individual members cope with health concerns and challenges. The family—the logical unit of assessment—has the primary responsibility for the following: 1. Developing self-care and dependent-care competencies of its members 2. Fostering resilience of family members to include shared values and shared goals 3. Providing social and physical resources to the family group 4. Promoting healthy individuals while maintaining family cohesion (Peace & Lutz, 2009) Although women generally carry the major responsibility for health decision making and health education for the family, the task of fostering health and healthy behaviors should be “mainstreamed” as an integral part of family functioning. The milieu for health promotion is likely to differ significantly across families, depending on their composition, structure, socioeconomic status, living environment, culture and cultural
  • 32. context, and family history. A family history is a window on the individual family members’ health and an invaluable insight into the risk of inheriting specific diseases, shared environmental factors, and individual health concerns. My Family Health Portrait is an example of an Internet-based family health tool that takes about 20 minutes to complete online, or the form is available to download. The nurse may need to print a copy for the family if the family does not have access to a computer or the skills to access the form. The program assembles the information and builds a family tree. Families can share the information with other family members and enter it into the PHR. As noted by Peace and Lutz (2009), the limitation of this traditional family history representa- tion is evident when applied to diverse families. Genopro is a free (with some restrictions) commercial application for drawing genograms and is more useful in assessing nontraditional family units. Healthy family traits and family strengths have many different modes of expression. One- parent families, blended families, unmarried parents with children, and gay and lesbian fami- lies are examples of the wide variation among families. Variations produced by transitions in family life influence the family assessment as well. Approaches to family assessment are pre- sented below. A systems approach to family assessment includes five assessment categories: (1) individual members, (2) subsystems (developmental, biological, psychological, social characteristics), (3) interactional patterns (relationships, communication patterns, roles, and attachment patterns), (4) family processing, and (5) change or adaptive abilities (Kaakinen, Gedaly-Duff, Hanson, & Coehlo, 2009). Three categories of processes underlie a systems model of family assessment: (1) those that regulate exchanges with the environment, (2) processes designed to prevent an overload of the system, and (3) internal processes that regulate the family’s ability to adapt and change (Clark, 2007). Assessment based on
  • 33. systems theory provides insight about the internal pro- cesses of the family as well as the relationship of the family to the environment and larger social system. Family decision-making patterns in relation to health identify power structure and health care function. In a structural- functional approach to family assessment, the family is a system Chapter4 • AssessingHealthandHealthBehaviors 95 96 Part2 • PlanningforHealthPromotionandPrevention with communication patterns, power structure, role structure, family values, affective function, socialization patterns, health care function, family stress, coping, and adaptation mechanisms. Family functional assessment dichotomizes instrumental functioning and expressive function- ing. Instrumental functioning refers to the routine activities of everyday living, while expressive functioning connotes emotional communication, verbal communication, nonverbal communica- tion, circular communication, problem solving, roles, control, beliefs, alliances, and coalitions (Melesis, 2012; Kaakinen, Gedaly-Duff, Hanson, & Coehlo, 2009). The Calgary Family Assessment Model is adapted for nurses to assess families (Wright & Leahey, 2009). This model consists of family structural assessment, family developmental assessment, and family functional assessment. In structural assessment, the family’s internal structure includes family composition, rank order, subsystem, and boundary; components of the external structure are culture, religion, socioeconomic level, mobility, environment, and extended family. To assess family development, the Calgary model reviews the current stage of the family in relation to family developmental history. Family development focuses primarily on the tradi- tional family developmental cycle, but it also includes assessment of alterations in the family developmental life cycle brought about by separation, divorce, death, single parenthood, and remarriage. A significant gap in conducting family assessments is the lack of valid and reliable instru- ments that measure family
  • 34. dimensions of a health-related lifestyle. Family assessment and indi- vidual assessment are interrelated processes and complement each other. Table 4–6 lists suggested assessment areas. To provide further guidance, Chapter 5 presents a format for developing a fam- ily health promotion-prevention plan. TABLE 4–6 Components of Family Assessment Nutrition 1. Meals prepared in the home are generally consistent with MyPlate. 2. Healthy snacks are consumed in the home. 3. Knowledge about healthy eating habits is shared among family members. 4. Mutual assistance occurs among family members for maintenance of recommended weights and avoidance of overweight and underweight. 5. Family members praise each other for healthy eating. 6. Family members encourage each other to drink 6 to 8 glasses of water per day. 7. Family members base purchase decisions on nutritional labels on food. Physical Activity 1. Many family outings consist of vigorous or moderate physical activity. 2. Exercise equipment is available within the home. 3. Use of home exercise equipment is part of “family time.” 4. Family members expect each other to be physically active. 5. A family membership is held in recreational facilities or programs. 6. Time together is seldom spent watching television or playing video games. 7. Family prefers to spend as much time out of doors as possible. Stress Control and Management 1. Family manages time well to minimize stressful demands on members. 2. Family often relaxes, shares stories, and laughs together. 3. Emotional expression is encouraged within the family. 4. Family members share stressful experiences with each other.
  • 35. 5. Family members offer each other assistance with difficult tasks. 6. Family members seldom criticize each other. 7. Periods of relaxation and sleep are considered important by the family. Health Responsibility 1. A schedule for preventive care visits is maintained by the family. 2. Family often discusses news and articles about health topics. 3. Family members are encouraged to seek health care early if a problem develops. 4. Personal responsibility for health is encouraged by the family. 5. Family feels a sense of responsibility for the health of the family and each member. 6. Health professionals are consulted about health promotion as well as care in illness. 7. Appropriate protective behaviors are openly discussed and encouraged (abstinence, use of condoms, hearing protection, eye protection, sunscreen, helmets). Family Resilience and Resources 1. Worship or spiritual experiences are a regular part of family activities. 2. Family members share a sense of “togetherness” despite difficult life events. 3. Family has a common sense of purpose in life. 4. Family members encourage each other to “keep going” when life is difficult. 5. Growth in positive directions is mutually encouraged within the family. 6. Health is nurtured as a positive family resource. 7. Personal strengths and capabilities are nurtured. Family Support 1. Family has a number of friends or relatives that they see frequently. 2. Family is involved in community activities and groups.
  • 36. 3. Family members frequently praise each other. 4. In times of distress, the family can call on a number of other families or individuals for help. 5. Disagreements are settled through discussion rather than verbal abuse or physical violence. 6. Family members model healthy habits for each other. 7. Professional support services are sought when needed. AssEssmENT oF THE commUNITy A third essential component of assessing the health of individuals is an assessment of the com- munity in which they live, work, and play. Community assessment is a complicated and time- consuming undertaking. However, such assessments are critical to identify community strengths and resources as well as to diagnose community problems and/or deficits. Collabora- tion is required among many individuals in the community as well as health professionals. Chapter4 • AssessingHealthandHealthBehaviors 97 98 Part2 • PlanningforHealthPromotionandPrevention A community analysis performed with the community, and not on or for the community, increases the likelihood of success. A team or coalition of local citizens and organizations involved in the assessment process encourages community “ownership” of the program and commitment to implement the plan. There are four objectives for conducting a community assessment: 1. Identify community strengths and areas for improvement. 2. Identify and understand the status of community health needs. 3. Define improvement areas to guide the community toward implementing and sustaining policy, systems, and environmental changes around healthy living strategies (e.g., increased physical activity, improved nutrition, reduced tobacco use and exposure, and chronic dis- ease management). 4. Assist with prioritizing community needs and consider
  • 37. appropriate allocation of available resources (Centers for Disease Control and Prevention, 2010). Assessment involves gathering data and input on what the community needs. Assessing community needs gives voice to citizens’ concerns and issues and allows that “voice” to influ- ence significantly the program design. Components of a community assessment include human biology, the environment, community lifestyles, and the health system. Table 4–7 lists these components. An assessment methodology that combines at least three to four data collection methods is more likely to provide a holistic picture of the community than is an assessment that relies on only one or two approaches. Review the advantages and disadvantages of data collection methods at the CDC Healthy Communities website. Successful implementation of community health promotion- prevention programs depends in large part on a well-developed community plan. Community-level changes such as policy are more sustainable, impact infrastructure, and support social change. For example, an effort to improve family food choices is sustainable only if healthy, affordable, and assessable food loca- tions are available in the community. TABLE 4–7 Components of Community Assessment Human Biology 1. Composition of population by age, gender, and race 2. Population patterns of longevity 3. Genetic inheritance patterns by gender and race 4. Disease incidence and prevalence compared to prior years, and to state and national statistics 5. Health status indicators (immunization levels, nutritional status, mobility) Environment 1. Physical environment (urban/rural/suburban, housing, water supply, parks and recreation, climate, topography, size, population density, aesthetics, natural or manmade resources, goods and services, health risks) 2. Psychologic environment (productivity level, cohesion,
  • 38. mental health status, communication networks, intergroup harmony, future orientation, prevalence of stressors) 3. Social environment (income and education levels, employment, family composition, religious affiliations, cultural affiliations, language[s] spoken, social services, organization profile, leadership and decision-making structures) Community Lifestyles 1. Consumption patterns (nutrition, alcohol) 2. Occupational groups 3. Leisure pursuits 4. Community health attitudes and beliefs 5. Patterns of health-related behaviors in aggregates 6. History of participation in community health action Health System 1. Health care services available (health promotion, prevention, primary care, secondary care, tertiary care, mental health) 2. Accessibility of promotive and preventive care (low income, homeless, varying racial and ethnic groups) 3. Financing plans for health care Source: Clark, Mary Jo, Community Health Nursing: Caring for Populations, 4th Edition, © 2003. Reproduced by permission of Pearson Education, Inc., Upper Saddle River, New Jersey. A community-based action may improve the overall health of the community, but within the community, certain groups may be disenfranchised based on income level or occupation, exacerbating health disparities. Achieving health equality may be at odds with improving the overall health of the community, and priorities must be determined (Institute of Medicine, 2012). The need for transparency is paramount between the decision makers and the community to ensure that the action plan reflects the values and preferences of the citizens. PRAcTIcE coNsIdERATIoNs IN AssEssING HEALTH ANd HEALTH BEHAvIoR Use of assessment measures to document areas for improvement to enhance the health status of individuals, families, and
  • 39. communities is an important responsibility of the nurse. Assess- ment data about health status and behaviors provide the basis for clinical judgments and help plan appropriate individual, family, and community interventions. Nurses’ knowledge and influence can ensure that a portfolio of conceptually congruent assessment instruments is available and used in the work setting. The nurse must know how to administer assessment measures and explain the value of conducting systematic assessments to the client. The busy work environment may discourage the use of detailed assessments because they require time to administer and follow up. One strategy to manage the time issue is to seek innovative ways to communicate with clients through videotapes and brochures that explain assessment proce- dures. Information technology has made computerized assessment possible. Thus, clients may be able to complete self-assessments at home, as time allows, with transmission of the informa- tion by computer prior to health care visits. Practicing nurses must keep up-to-date about new assessment measures and strategies that can be quickly implemented and yield accurate data. Nurses influence the quality of the health promotion plan of the individual, family, and community through a commitment to thorough assessment of health and health behaviors. Chapter4 • AssessingHealthandHealthBehaviors 99 100 Part2 • PlanningforHealthPromotionandPrevention oPPoRTUNITIEs FoR REsEARcH IN HEALTH AssEssmENT ANd HEALTH BEHAvIoR Research that develops and tests assessment instruments for health and health behaviors of aggre- gates from diverse racial, cultural, and socioeconomic backgrounds is a high priority. Reliable and valid instruments based on theory and research are needed to perform meaningful assess- ments. Community interventions should be developed and tested in subgroups. Accurate knowl- edge of the client, family, and community will
  • 40. facilitate the development and implementation of successful health promotion interventions. Summary Health assessment at the individual, family, and community levels is time intensive and costly, so measures must reflect client characteristics and Learning Activities 1. Go to the My Family Health Portrait website and record a traditional family health portrait. Examine the differences between My Family Health Portrait and the commercial application at Genopro. 2. Develop a list of safeguards to ensure that non- computer users are included in the health care technology environment. 3. Develop an assessment plan based on age-specific instruments for a child, a young adult, and an older adult. 4. UsingTable4–2,determineyourpercentageofbody fat and outline a personal goal based on the results. References American College of Sports Medicine. (2013). ACSM’s resource manual for guidelines for exercise testing and prescription (9th ed.). Baltimore, MD: Williams and Wilkins. ANA SmartBrief. (2012). Mobile apps seen as one of top medical trends for 2013. New York, NY: Wall Street Journal (12/31). Bleyer, A., & Welsh, H. (2012). Effect of three decades of screening mamography on breast-cancer incidence. New England Journal of Medicine, 367(21),1998–2005. Block, L. (2013). USPSTF mommo recommendations: Tempest in a teapot? Retrieved May 20, 2013, from HealthImaging: http://www.healthimaging.com presenting health issues. The nurse and client must mutually establish a relevant plan to ensure its success. 5. Investigate one approach to assessing a family and discuss its strengths and weaknesses for use in the clinical setting. 6. Identify the relationship between a family and a community
  • 41. assessment and discuss how they affect the health outcomes of the family and community. 7. Discuss factors to consider in a community assess- ment including those influencing the extent of assessment conducted. /topics/womens-health/breast-imaging/uspstf- mammo-recommendations-tempest-teapot. Bulechek, G., Butcher, H., Dochterman, J., & Wagner, C. (2013). Nursing Interventions Classification (NIC) (6th ed.). St. Louis, MO: Mosby. Centers for Disease Control and Prevention. (2010). Community Health Assessment and Group Evaluation (CHANGE) action guide: Building a foundation of knowledge to prioritize community needs. Atlanta, GA: U.S. Department of Health and Human Services. Chen, Y. Y., Lu, J. C., & Jan, J. K. (2012). A secure EHR system based on hybrid clouds. Journal Medical Sys- tems, 3(5), 3375–3384. Chung, L., Wong, F., & Chan, M. (2007). Relationship of nurses’ spirituality to their understanding and practice of spiritual care. Journal of Advanced Nursing, 58(2), 158–170. Clark, M. (2007). Community health nursing: Advocacy for population health (5th ed.). Upper Saddle River, NJ: Prentice Hall. CMS.gov. (2009). Retrieved February 7, 2013, from Centers for Medicare & Medicaid Services: www .cms.gov/Regulations- and-Guidance/legislation /EHRIncentiveProgram. Cohen, S., Kessler, R., & Gordon, L. (1997). Measuring stress. New York, NY: Oxford Press. Derogatis, L., & Lazarus, R. (1997). Evaluating stress. The Derogatis stress profile (DSP): A theory driven aproach to stress measurement. Lanham, MD: Scarecrow Press. Folkman, S., &, Lazarus, R. (1988). Coping as a mediator of emotion. Journal of Personality and Social Psychology, 54(3), 466–475. Frank-Stromborg, M. (2004). Instruments for clinical health-
  • 42. care research (3rd ed.) Sudbury, MA: Jones & Bartlett. Galek, K., Flannelly, K., Vane, A., & Galek, M. (2012). The Spiritual Needs Assessment for Patients (SNAP): Development and validation of a comprehensive instrument to assess unmet spiritual needs. Journal of Pain and Symptom Management, 44(1), 44–51. Gordon, M. (2009). Manual of nursing diagnosis (12th ed.). Sudbury, MA: Jones and Bartlett, Inc. Gupta, D., & Lis, C. (2010). Pretreatment serum albu- min as a predictor of cancer survival: A systematic review of the epidemiological literature. Nutrition Journal, 9, 69. Hagan, J. F., Jr., Shaw, J. S., & Duncan, P. M. (Eds.). (2008). Bright futures: Guidelines for health supervision of infants, children, and adolescents (3rd ed.). Elk Grove Village, IL: American Academy of Pediatrics. Hendricks, C., Murdaugh, C., & Pender, N. (2006). The adolescent lifestyle profile: Development and psycho- metric characteristics. Journal of National Black Nurses Association, 17(2), 1–5. Institute of Medicine. (2012). An integrated framework for assessing the value of community-based prevention. Washington, DC: The National Academy of Sciences. Kaakinen, J., Gedaly-Duff, V., Hanson, S., & Coehlo, D. (2009). Family health care nursing: Theory, practice, and research. Philadelphia, PA: F. A. Davis Co. Kressin, N., Manze, M., Russell, S., Katz, R., Claudio, C., Green, B., & Wang, M. (2010). Self-reported willing- ness to have cancer screening and the effects of sociodemographic factors. Journal of the National Med- ical Association, 102(3), 219–227. Li, M., Friedman, B., Conwell, Y., & Fiscella, K. (2007). Validity of the Patient Health Questionnaire 2 (PGQ-2) in identifying major depression in older people. Journal of the American Geriatric Society, 55, 596–602. Li, Y., Lee, P., Jian, W., & Kuo, C. (2009). Electronic Health Record goes personal world-wide. Yearbook of Medical
  • 43. Informatics, 10(1), 40–43. Litwinczuk, K., & Groh, C. (2007). The relationship between spirituality, purpose in life, and well-being in HIV- positive persons. Journal of the Association of Nurses in AIDS Care, 18(3), 13–22. Lunney, M. (2008). The need for international nursing diagnosis research and a theoretical framework. Inter- national Journal of Nursing Terminologies and Classifi- cations, 19(1), 28–29. Melesis, A. (2012). Theoretical nursing: Development and progress. Philadelphia, PA: Lippincott, Williams & Wilkins. Monod, S., Rochat, E., Bula, C., & Spencer, B. (2010). The spiritual needs model: Spirituality assessment in the geriatric hospital setting. Journal of Religion, Spiritual- ity & Aging, 22(4), 271–282. Moorhead, S., Johnson, M., Maas, M., & Swanson, E. (Eds.). (2013). Nursing outcomes classification (NOC) (5th ed.). St. Louis, MO: Elsevier. National Association of Nursing Diagnosis-International. (2013). Retrieved from: www.nanda.org Nishida, T., & Sakakibara, H. (2010). Association between underweight and low lymphocyte count as an indicator of malnutrition in Japanese women. Journal of Womens Health, 19(7), 1377–1383. Peace, J., & Lutz, K. (2009). Nursing conceptionization of research and practice. Nursing Outlook, 57(5), 42–49. Popkess-Vawter, S. (2008). Wellness nursing diagnosis: To be or not to be? Journal of Terminologies and Classifica- tions, 2(1), 19–25. Robert Wood Johnson Foundation. (2009). Personal health records. Retrieved from http://www.rwjf.org/en/search- results. Ryan-Wenger, N., Wilson (Sharrer), V., & Broussard, A. (2012). Stress, coping, and health in children. In V. H. Rice, Stress, coping, and health implications for nursing research, theory, and practice (pp. 226–253). Los Angeles, CA: Sage. Sarason, B., Shearin, E., Pierce, X., & Sarason, J. (1987). A brief measure of social support: Practical and theoreti- cal
  • 44. implications. Journal of Social and Personal Rela- tions, 4, 497– 510. Sechrist, K., Walker, S., Pender, N., & Frank-Stromborg, M. (1987). Development and psychometric evaluation of the Exercise benefits/Barriers Scale. Journal of Nursing Research, 10, 357–365. Spielberger, C., Gorsuch, R., Lushene, R., & Vagg, P. (1983). Manual for state-trait anxiety inventory. Palo Alto, CA: Consulting Psychologists Press Inc. The Office of Minority Health. (2013). Cultural compe- tency. Retrieved January 30, 2013, from Minority Chapter4 • AssessingHealthandHealthBehaviors 101 102 Part2 • PlanningforHealthPromotionandPrevention Health, Health & Human Services: http://aspe.hhs .gov/sp/reports/2010 U.S. Department of Commerce Census. (2012). Selected individual characteristics 2010. Washington, DC: U.S. Government Printing Office. U.S. Preventive Services Task Force. (2012). The Guide to Clinical Preventive Services. Washington, DC: Agency for Healthcare Research and Quality. WHO Expert Consultation. (2008). Waist circumference and waist-hip ratio. Geneva, Switzerland: World Health Organization. Wright, M., Creed, P., & Zimmer-Gembeck, M. (2010). The development and initial validation of a brief daily hassles scale suitable for use with adolescents. European Journal of Psychological Assessment, 26(3), 220–226. Wright, L., & Leahey, M. (2009). Nurses and families: A guide to family assessment and intervention. Philadelphia, PA: FA Davis Co.
  • 45. LIVING IN CHAOS BUT ON A BUDGET Are you frustrated or worried about your finances? STOP!!! Here is the Answer: Learn how to handle money, organize bills, build a grocery list, save money, and pay off debt. May 20th through the 25th 5:30 – 7:30 pm Ages: 16 & Up
  • 46. For Information Contact: Ronald Opp Ashford Multigenerational Center 8620 Spectrum Center Blvd San Diego, CA 92123 FUN FAMILY FITNESS NIGHT DATE: SATURDAY MAY 23, 2020 TIME: 5:00-6:00PM Join us for an evening of active family fun! Are you worrying that you do not know how to dance? No worries! Zumba is a fun cardio workout that combines dance, exercise, and high-energy music that anyone can do. We have experienced, friendly, and energetic Zumba instructor who can guide you through each step of the move. You are not alone -you have your family and us. Special Note: Please bring in a hand towel and wear comfortable clothes and sneakers. We will provide bottled water.
  • 47. Fitness Activity Zumba ──── Preschoolers and their Families ──── AU Multigenerational Gym ──── 5 Free Raffle Tickets per Family ──── RSVP By: Thursday, May 22, 2020
  • 48. In the main office AU Multigenerational Center 8620 Spectrum Center Blvd San Diego, CA 92123 For More Information Contact: Dina Mistry Phone: 866-711-1700 256 CHAPTER 12 Health Promotion in Vulnerable Populations Objectives this chapter will enable the reader to: 1. Discuss the social and economic determinants of health and their role in health disparities. 2. Describe the concept of equity in health. 3. Discuss approaches to address health inequities in diverse populations. 4. Examine strategies to promote health literacy. 5. Describe the continuum of interpersonal skills necessary for cultural competence. 6. Review strategies that facilitate culturally competent communication in vulnerable populations. 7. Describe approaches to ensure culturally competent health
  • 49. promotion programs. Vulnerable populations are diverse groups of individuals who are at greatest risk for poor physical, psychological, and/or social health outcomes. Vulnerable populations are more likely to develop health problems, usually experience worse health outcomes, and have fewer resources to improve their conditions. Various terms have been used to describe vulnerable populations, including underserved populations, special populations, medically disadvantaged, poverty-stricken populations, and American underclasses. Vulnerable groups include persons who experience discrimination, stigma, intolerance, and subordination, and those who are polit- ically marginalized, disenfranchised, and often denied their human rights. Vulnerable popula- tions may include people of color, the poor, non-English-speaking persons, recent immigrants and refugees, homeless persons, mentally ill and disabled persons, gay men and lesbians, and substance abusers. The values, attitudes, culture, and life circumstances of individuals who are poor, socially marginal, or culturally different from traditional mainstream society, and the communities in which they reside, must all be considered when planning health promotion and prevention Chapter12 • HealthPromotioninVulnerablePopulations 257 activities. Taking into account the factors that reflect the health determinants of vulnerable popu- lations is key to promoting positive health behaviors. In spite of improvements in health and spending more money on medical care than any other nation, the United States ranks near the bottom on key indicators of health, and health disparities continue to persist, based on an individual’s racial/ethnic background and socioeconomic (income and education) characteristics (Braverman, Egerter, & Mockenhaupt, 2011). Blacks, Hispanics and other racial/ethnic minorities are more likely to be socioeco- nomically disadvantaged, a more likely explanation for health differences by race and ethnicity. Health
  • 50. disparities are the differences in the incidence, prevalence, mortality, and burden of diseases and other adverse health conditions that exist among groups who are defined by certain characteristics. Health disparities disproportionately affect individuals who are members of the racial, ethnic minority, underserved, and other vulnerable groups mentioned previously, as well as persons who live in geographic (rural) areas where they are socially and physically isolated. Elimination of disparities to improve the health of all groups is an overarching goal of Healthy People 2020, and determinants of health and health dispari- ties are included as outcome measures of the national health objectives. (See the Healthy People 2020 website for details.) Although the major causes of health disparities need the input of society and government, development of empowering health promotion programs tailored for diverse individuals and communities is a major responsibility of nurses and other health care professionals. Determinants of HealtH Disparities anD HealtH inequities Social determinants of health are the structural and economic conditions in which people are born, live, work, and age (World Health Organization, 2013). These conditions are also responsible for health inequities and are shaped locally, nationally, and globally by economic distribution, social policies, and politics. In other words, money, power, and resources are responsible for the major inequities in health. Health inequities are avoidable inequalities in health between groups of persons that arise from social and economic conditions which increase their risks for illness and access to health promoting and preventive services. Health equity—the absence of disparities in health across populations, genders, and geo- graphic areas—can be achieved by empowering individuals and communities to challenge and change the distribution of social resources and advocate for social policies for equal access for all. Inequities in health are well documented and are considered to be the result of complex interactions among multiple factors:
  • 51. • Biologicalvariations • Healthcareaccess • Personalhealthbehaviors • Socialandeconomicresources • Culture One way to view health disparities is by examining the range of risk factors that increase the potential for inequalities (Table 12–1). The risk factors include personal health behaviors, popu- lation characteristics, health care characteristics, the social and physical environments, and the types of diseases that are disproportionately diagnosed in vulnerable groups (Koh, Oppenheimer, Massin-Short, Emmons, Geller, & Viswanath, 2010). 258 Part5 • HealthPromotioninDiversePopulations taBle 12–1 Range of Potential Risk Factors for Health Disparities Potential Risk Factor Personal Health Behaviors Population Characteristics Health Care Characteristics Residential Physical Environment Social Residential Environment Diseases Examples Tobacco use, illicit drug use, personal hygiene, dietary habits, physical inactivity, unsafe sexual practices. Race, ethnicity, immigration status, education, social position, occupation, employment, income, age, sexual orientation, health literacy. Insurance, access to health care services, access to prevention and screening services, regular physician, medication affordability. Housing density, housing quality, traffic density, air pollutants, hazardous wastes, drinking water quality, urban or rural, zoning policies, proximity to health care services, and proximity to quality food. Civic engagement, crime rate, isolation, neighborhood cohesion, neighborhood social capital. Obesity, hypertension, cardiovascular diseases, diabetes, mental
  • 52. illness, HIV/AIDS, cancer, respiratory illnesses, foodborne and waterborne illnesses. The most important social determinants of health inequities are considered to be structural influences, or factors that generate and reinforce social stratification and social class divisions in a society and define one’s socioeconomic position (Solar & Irwin, 2010). Socioeconomic position provides access to power, prestige, and resources and is based on a person’s income, education, and occupation. Other important structural determinants include gender, social class, and race/ ethnicity. These determinants are shown in the model in Figure 12–1 that describes the social determinants of health. This model was first drafted at the World Health Organization (WHO) Commission on Social Determinants of Health Meeting in 2005 (Solar & Irwin, 2010). The model depicts how governance structures or the sociopolitical context influences one’s socioeconomic position through the distribution of resources. Socioeconomic position shapes intermediate health determinants. Intermediary determinants that are determined by socioeconomic position include the following: · Material characteristics: neighborhood, housing, physical working conditions, buying potential · Behavioralfactors:nutrition,physicalactivity,tobaccouse,alcoholu se · Psychosocial factors: stressful living conditions and relationships, social supports, coping resources Intermediary determinants are reflective of an individual’s place in the social hierarchy, which results in differential exposure and vulnerability to health-compromising conditions (Solar & Irwin, 2010). All of these factors determine one’s health status and well-being. Chapter12 • HealthPromotioninVulnerablePopulations 259 SOCIOECONOMIC AND POLITICAL CONTEXT
  • 53. Governance Socioeconomic Position Material Circumstances (Living and Working, Conditions, Food Availability, etc.) Behaviors and Biological Factors Psychosocial Factors Social Policies Labour Market, Housing, Land Social Class Gender Ethnicity (racism) IMPACT ON EQUITY IN HEALTH AND WELL-BEING Macroeconomic Policies Education Occupation Income Public Policies Education, Health, Social Protection Culture and Societal Values Social Cohesion & Social Capital Health System STUCTURAL DETERMINANTS SOCIAL DETERMINANTS OF HEALTH INEQUITIES INTERMEDIARY DETERMINANTS SOCIAL DETERMINANTS OF HEALTH fiGure 12–1 WHO Framework Describing Structural Determinants of Health Source: Solar, O., & Irwin, A. (2010). A conceptual framework for action on the social determinants of health. Social Determinants of Health Discussion Paper 2 (Policy and Practice). Accessed at http://www.who.int/ sdhconference/resources/ConceptualframeworkforactiononSDH_ eng.pdf socioeconomic Determinants The key components of socioeconomic position depicted have
  • 54. been substantiated to be the root of health inequities, measured at the population level (Solar & Irwin, 2010). Low economic status is the most consistent predictor of life expectancy, morbidity and mortality, and health status (Braverman, Cubbin, Egerter, Williams, & Pamuk, 2010). Although there is great diversity among minority populations, overall, minorities have substantially lower incomes and educational levels than do whites. Income is a powerful variable that explains health status. Low income and educa- tion result in economic hardship, such as the inability to meet one’s living expenses, while higher incomes and educational levels facilitate access to care, better housing in safer neighborhoods, increased opportunities for healthy food purchases, and access to club memberships and health- promotion programs. In addition, low-status occupations expose individuals to physical health hazards. Educational attainment also is lower in minority groups. High-risk behaviors have been correlated with lower educational levels. More-highly educated persons are also more likely to obtain health-related information at understandable levels. A socioeconomic gradient exists for almost every health indicator for every racial and ethnic group (Braverman, Egerter, & Mockenhaupt, 2011). The effects of low socioeconomic status are long lasting. Low socioeconomic status in childhood has been associated with poorer health in adulthood. The cumulative wear and tear of the adverse experiences of living in poverty, with its multiple challenges, results in chronic illnesses. Families who have been poor over several generations and suffer ongoing discrimination and frustration without 260 Part5 • HealthPromotioninDiversePopulations substantial upward movement develop feelings of powerlessness and perceive their condi- tions differently than do recently arrived immigrants who are poor, but are hopeful about their future. Access to care can be measured by the proportion of a population that has health insurance. Because of their socioeconomic situation, racial and ethnic minorities are much
  • 55. more likely to be underinsured or to lack health insurance. When they do have insurance, it is likely to be public insurance, primarily Medicaid. Health insurance contributes to the amount and type of health services obtained. Lack of health insurance has important implications for health promo- tion and prevention efforts, such as screening and access to wellness programs. Insurance status has also been correlated with self- reported health status. Those who rate their health as fair or poor are more likely to be uninsured than are those who rate their health as good or excellent. Poor individuals also experience greater barriers in accessing care, have more difficulty getting an appointment, and wait longer during health care visits. These factors are compounded by the fact that many communities of poverty mistrust the government and government-controlled programs. Socioeconomic barriers to accessing care exist for vulnerable populations. These barriers have been repeatedly documented and need to be addressed to improve access to quality health care. promotinG equity in HealtH Achieving equity in health means that everyone has the opportunity to attain their full health potential, and no one is disadvantaged because of social, demographic, or geographic differ- ences. Health disparities can be eliminated through the promotion of health equity, which minimizes avoidable differences between groups of people who have diverse levels of underlying social advantage (Braverman, Kumanyika, Fielding, LaVeist, Borrell, Manderscheld, & Troutman, 2011). The early literature on health disparities focused on racial/ethnic differences in health and “closing the gap”; however, “achieving health equity” is now more commonly discussed. Equity in health places emphasis on the multiple influences on individual and popu- lation health and draws attention to the many challenges that must be addressed. Promotion of health equity moves health promotion to a political activity, as it moves from the individual level to a broader focus on strategies to also change the distribution of
  • 56. social and economic resources (Raphael, 2011a). Health equity can be achieved only through interventions that address the multiple health determinants: • Social:networks,connections,institutionallinks • Economic:money,time,prestige • Sociocultural:skills,education,knowledge,language,religion,fami lybackground • Political:power,distributionofresources A study of the economic value of improving the health of less- educated American adults if they were to experience mortality rates and health status similar to those of adults with a col- lege education was commissioned by the Robert Wood Johnson Foundation in 2007 (Schoeni, Dow, Miller, & Pamuk, 2011). In spite of limitations, results showed an annual economic value of $1.2 trillion. The economic burden of health disparities over a three-year period was estimated to be $1.24 trillion. Although these analyses do not uncover the causal pathway of education on health or account for costs in eliminating disparities, the results from these and other studies document the important role of socioeconomic characteristics in health. Chapter12 • HealthPromotioninVulnerablePopulations 261 multilevel interventions Successful outcomes result from multilevel interventions and programs that are directed to individuals, communities, and social policies. Multilevel interventions address several factors to effect change in individuals and their socioeconomic context. Multilevel interventions go beyond individual-focused strategies to structural and socioeconomic influences to promote change (Trickett & Beehler, 2013). Multilevel interventions have been called fourth-generation health disparities research (Thomas, Quinn, Butler, Fryer, & Garcia, 2011). These types of interventions incorporate both qualitative and quantitative methods to implement programs and evaluate outcomes. They are complex, pose many challenges, and require input from mul- tiple sources, such as interdisciplinary health care teams, community organizations, and local and state governments.
  • 57. Community empowerment At the community level, empowerment is a key strategy for reducing health inequities. (See Chapter 11 for a discussion of individual empowerment and Chapter 14 for more discussion on community empowerment.) Community empowerment is a social action process that enables individuals, communities, and organizations to gain control over their lives within their social and political context to promote equity (Wiggins, 2011). It involves a shift in power between individuals and other social groups. Local community organizations empower individuals by working together to build trust and improve neighborhood programs. They also work with community members to advocate for new programs and resources for their neighborhoods. For example, they may work together to advocate for after-school programs for youth, parks for leisure activities for families, or increased law enforcement presence; or they may work to bring affordable health screening services to the neighborhood for those without transportation. Community agencies can advocate for local school board participation. In addition, they can empower community members to take an active role in promoting healthy and safe schools and neighborhoods. Empowered communities believe in their capacity to change inequities and use that capacity to bring about change. Empowered community members feel a sense of community, which increases a sense of caring and support for each other and facilitates participation in change, such as working to obtain affordable housing, public transportation, safe walking places, and access to healthy foods. Empowered communities work with external powers to address community needs. For example, they may lobby and engage in policy decisions that impact the health of their communities. The ultimate goal of community empowerment is to create relationships and policies to promote health equity (Wiggins, 2011). Focusing on working conditions, household and neighborhood hazards, and availability of community resources such as healthy foods and physical activity areas brings attention to
  • 58. environmental factors that can be changed within communities and work sites. Empowered com- munity members can organize walking groups, community lectures, and health fairs. Community members need to be able to participate in decisions that influence their health and the health of the community. Empowerment means having a political voice to garner resources to change the community. Community-based organizations (CBOs) are logical places to begin to bring about com- munity change, as these organizations are enmeshed in the life of the community (Griffith et al., 2010). They are organizational sites where community members meet to socialize or address their concerns. CBOs are places where individuals can learn skills that empower them to address 262 Part5 • HealthPromotioninDiversePopulations community issues. Leaders of CBOs can represent and advocate for the community. Empower- ing CBOs enables members to establish new projects and programs, as well as use their collective power to advocate for policy changes. Empowered CBOs are able to build community capacity, as they know the strengths, weaknesses, and availability or lack of resources within their community. Community-based participatory research Community-based participatory research (CBPR) is a method that integrates research with social action (Masuda, Poland, & Baxter, 2010). It is an effective way to build community capacity, as the method functions to transform power structures to create knowledge and promote actions for social change through community engagement. CBPR has been successfully implemented to expose power inequities in disadvantaged communities. This strategy enables community voices to be heard. Wallerstein and Duran (2010) have identified barriers to implementing CBPR and strategies to address these barriers. policy advocacy The socioeconomic and structural gradients in this country and their relationship to differences in health mandate that policies be created to address the social determinants of health
  • 59. inequities (Braverman, Cubbin, Egerter, Williams, & Pamuk, 2010). Canada, England, and Australia are considered leaders in implementing health-promoting public policies through legislation, fiscal measures, taxation, and organizational change (Raphael, 2011b). Public policies influence the prerequisites of health in three key areas: early childhood development, employment, and income (Raphael, 2011a). Public policies to address these key areas have all been associated with lower rates of poverty and income inequities, Notably, the United States has the second lowest percentage of gross domestic product expenditures allocated in the form of public expenditures and the highest poverty rates in families and children among 21 selected countries (Raphael, 2011a). These rankings point to the need for policy to shift from a focus on individual health risk behaviors to the redistribution of economic resources to promote a healthy society for all. Nurses and all other health professionals need to become knowledgeable about the political economy of health and public policy analysis to be able to advocate for health policies that promote healthy communities and equitable socioeconomic conditions. In com- munity settings, nurses may become spokespersons for the poor in order for their voices to be heard. At the individual level, strategies to alleviate poverty include helping families obtain available benefits, providing information about available services and how to access them, targeting those in greatest need, teaching skills, and partnering individuals with community agencies to provide additional supports (Cohen & Reutter, 2007). At the community level, empowerment strategies promote community dialogue between community members, CBOs, and persons in positions to influence policies. Nurses can also work with their professional associations to place the elimination of health inequities on their agendas for action. Membership in organizations that promote agendas to reduce health inequities is another avenue for action. Political competence can be developed through courses and dia- logues with knowledgeable others. Working in