SlideShare une entreprise Scribd logo
1  sur  94
Journal of Applied Corporate Finance • Volume 22 Number 2 A
Morgan Stanley Publication • Spring 2010 1
It Ain’t Broke: The Past, Present, and Future of Venture Capital
BT
by Steven N. Kaplan, University of Chicago Booth School of
Business
and NBER, and Josh Lerner, Harvard Business School and
NBER*
he U.S. venture capital (VC) industry is currently
subject to a great deal of uncertainty and contro-
versy. Some observers and practitioners believe
that the VC model is broken and that the U.S.
VC industry needs to shrink.1 In this paper, we put the U.S.
VC industry into its historical context, assess the current state
of the VC market, and discuss the implications of that history
and the current conditions for the future.
We begin by describing the fundamental problem that
entrepreneurs face and VCs need to solve in order to invest
successfully. There is a great deal of evidence to support what
is now a highly developed theory of how the U.S. VC model
provides an efficient solution to this basic problem of entre-
preneurial finance. And there is little doubt that the U.S.
venture capital industry has been very successful. A large
fraction of IPOs, including many that are now among the
most successful public companies in the world, have been
funded by VCs. And, where possible, the U.S. VC model has
been copied around the world.
Next we look at the historical patterns of commitments
to U.S. VC funds and investments in companies by those
funds. U.S. VC investments in companies have represented
a remarkably constant 0.15% of the total value of the stock
market over the past three decades—the period for which we
have reliable data. Commitments to VC funds, while more
variable, have been consistently in the 0.10% to 0.20% range.
These percentages have not changed in recent years.
Third, we consider the historical record on VC fund returns,
paying particular attention to returns of post-2000 “vintages.”
Contrary to the popular impression, we do not find that returns
to VC funds this decade have been unusually low (or high)
relative to the overall stock market. This is true despite the
relatively low number of IPOs. Overall, VC investment and
returns have been subject to boom-and-bust cycles over time.
Based on our historical analyses, we make some observa-
tions about the current situation and consider what is likely to
happen going forward. The level of commitments to and the
investment pace of VC funds since 2002 have been consistent
with the long-term historic averages. At the same time, the
returns relative to the overall stock market appear to have
been roughly average. This does not suggest to us that there
is too much money in U.S. VC, or that the VC model is
broken. Instead it appears to reflect the natural evolution of
a relatively competitive market.
In fact, given the unusual and unexplained paucity of IPOs
between 2004 and 2007, we argue there is more upside than
downside for the VC vintages of 2001 to 2007. The costs for
public companies associated with Sarbanes-Oxley are now
smaller and more manageable than they were in 2005 and
2006. There are more boutique investment banks with incen-
tives to market IPOs. And according to anecdotal reports, there
has recently been growth in the pipeline of IPO candidates.
We also note that commitments to U.S. VC partnerships
were historically low in 2009, a trend that is likely to continue
into 2010 and, possibly beyond. Based on the historical
relationship between commitments and performance, the
low level of commitments suggests that returns to the 2009
and 2010 vintage years are likely to be strong.
Finally, we consider some of the longer-term drivers of
venture capital financing. Corporate funding of innova-
tion has increasingly moved from large, centralized research
facilities to various “open innovation” models, including
acquisitions and strategic alliances with smaller firms. This
increased willingness to reach outside the organization, which
reflects the difficulties of managing early-stage innovation
within a large corporation, appears likely to create more
opportunities for venture investors in the years to come.
The Problem and
Solution
An important problem in a market economy, and the one
that VCs attempt to solve, is to connect entrepreneurs with
good ideas (but no money) with investors who have money
but are looking for good ideas. The solution, as suggested by
theoretical analysis and implemented by venture capitalists,
involves (at least) three distinct activities.2
First, VCs spend a large amount of time and resources
screening and selecting deals. VCs systematically evaluate the
attractiveness and risks of the opportunity, considering factors
that include market size, strategy, technology, customer
adoption, competition, and the quality and experience of the
* Chris Allen and Jacek Rycko provided excellent research
support for this article. We
thank Harvard Business School’s Division of Research and the
Kauffman Foundation for
financial support. All errors and omissions are our own.
1. For example, see Kedrosky (2009) and Austin (2009). Full
citations for all articles
appear at the end of the article.
2. See Kaplan and Strömberg (2001) for a more detailed
discussion.
2 Journal of Applied Corporate Finance • Volume 22 Number 2
A Morgan Stanley Publication • Spring 2010
Figure 1 Share of all Non-financial, Non-reverse LBO, Non-
REIT, Non-SPAC IPOs that are
Venture-backed from 1995–(July) 2009
0.0%
10.0%
20.0%
30.0%
40.0%
50.0%
60.0%
70.0%
80.0%
1995 1996 1997 1998 1999 2000 2001 2002 2003 2004 2005
2006 2007 2008 2009
Year
measures or indicators of that importance and success.
Let’s start by recognizing how uncommon VC funding is.
While roughly 600,000 new businesses (that employ others)
are started each year in the U.S., reports from Venture Source
suggest that, in an average year, roughly 1,000 businesses will
receive their first round of funding from a VC. That means
that only 1/6 of 1% of new businesses manage to obtain VC
funding.6
But while very few companies receive VC funding, a
remarkably large fraction of the start-ups that make it to the
public company stage are funded with venture capital. To
estimate this fraction, we used Thomson Banker to identify all
IPOs in the U.S. since 1995—and then attempted to eliminate
IPOs that were not true industrial start-ups by excluding blank-
check companies, corporate spin-outs or spin-offs, financial
institutions, REITS, and reverse leveraged buyouts.
Using this better measure of the true start-up population
that goes public, we found that from 1999 through 2009 (as
illustrated in Figure 1), over 60% of IPOs have had VC backing.
This is an extraordinary percentage considering that only 1/6 of
1% of all companies are VC-backed. What’s more, in only two
years of these eleven years have fewer than 50% of IPOs been
VC-backed.7 One way of interpreting these results is that
receiv-
ing VC funding and going public are both very uncommon, but
highly related events. While not a necessary condition for going
public, VC funding very significantly increases the likelihood
that a start-up will eventually go public.
Venture capital has fueled many of the most successful
start-ups of the last 30 years. Four of today’s 20 largest (in
management team. The screening process is an intensive and
disciplined one that often takes several months.3
Second, VCs engage in sophisticated contracting and
structuring of their investments.
VC contracts are efficiently designed to ensure the follow-
ing: the entrepreneur does very well if he or she performs
well; the VC takes control if the entrepreneur does not
perform. VCs implement this design by carefully allocating
cash flow rights (the equity upside that provides incentives
to perform), control rights (the rights VCs have to intervene
if the entrepreneur does not perform, liquidation rights (the
senior payoff to VCs if the entrepreneur does not perform),
and employment terms, particularly vesting (which gives the
entrepreneur incentives both to perform and stay with the
firm). The various aspects and provisions of the contracts
typically reflect the VC’s earlier analysis (during the screening
phase) of the attractiveness and risks of the investment.4
Third, VCs improve the outcomes of and add value to
their portfolio companies by monitoring and aiding companies
after they invest. Part of the added value comes from providing
governance and monitoring. This often means replacing the
entrepreneur when it becomes clear the entrepreneur is not
up the task of growing the company. Part of the added value
involves assisting the entrepreneur with strategy, hiring other
executives, introductions to customers and other partners.5
Historical Impact
It is generally believed that VC investing has been impor-
tant to the U.S. economy. In this section, we provide several
3. For a detailed description and analysis of VC screening, see
Kaplan and Strömberg
(2004).
4. For a detailed description and analysis of VC contracts, see
Kaplan and Strömberg
(2003).
5. Hellmann and Puri (2002), Kaplan and Strömberg (2004), and
Lerner (1995) all
document different aspects of this VC value-added. Sorensen
(2007) seeks to assess the
relative importance of deal screening and subsequent value-
added and concludes that
the two are of roughly equal importance for top VCs.
6. Using detailed Census data, Puri and Zarutskie (2009) obtain
similar percentages
for the 1996 to 2000 period.
7. If anything, our numbers underestimate the percentage of
start-ups that are VC-
backed. Kaplan, Sensoy and Strömberg (2009) study 2004 IPOs
in greater detail and
find a somewhat higher percentage are VC-backed than the
Thomson database indi-
cates. In other words, it is highly unlikely that a company that
does not take venture
capital ends up going public.
3Journal of Applied Corporate Finance • Volume 22 Number 2
A Morgan Stanley Publication • Spring 2010
Figure 2 Commitments to U.S. Venture Capital Partnerships,
1980–2009 ($ billions)
Source: Private Equity Analysis
0
10
20
30
40
50
60
70
80
1980 1982 1984 1986 1988 1990 1992 1994 1996 1998 2000
2002 2004 2006 2008
$
B
ill
io
ns
Figure 3 Commitments to U.S. VC Partnerships as Fraction of
Stock Market Capitalization 1980–2009
Source: Private Equity Analyst, Steven N. Kaplan
0
.05
.1
.15
.2
.25
.3
.35
.4
.45
1980 1982 1984 1986 1988 1990 1992 1994 1996 1998 2000
2002 2004 2006 2008
%
S
to
ck
M
ar
ke
t
analyze historical performance.
Figure 2 presents annual limited partner commitments
to venture capital funds from 1980 to 2009 (using data from
Private Equity Analyst) in nominal (or actual) dollars. The
figure documents the huge run-up in venture capital through
the dot-com era and the subsequent decline. From 2005 to
2008, annual commitments to venture capital ran in the
range of $25 to $33 billion.
But these depictions do not take account of the fact that
the size of the economy and the stock market has increased
markedly since 1980. In Figure 3, we address this shortcom-
ing by scaling annual commitments by the total value of
the U.S. stock market at the beginning of each year. This
scaling, then, presents VC commitments as a fraction of the
total market value of equity. Measured this way, VC commit-
ments are much more stable. VC commitments have never
terms of market capitalization) U.S. companies—Micro-
soft, Apple, Google, and Cisco—have been funded in part
by venture capital in the last 30 years. And so were a large
number of other highly valuable companies, including Gilead,
eBay, Amazon, Yahoo, Amgen, Adobe, Celgene, Starbucks,
Genzyme, Juniper, Symantec, Stryker, and Intuit. Thanks
in part to such highly visible successes, U.S. venture capital
practices have been exported to other parts of the world.8
Fundraising and Investment
Those who believe that the U.S. venture model is broken argue
that there is an excessive amount of capital in the venture
industry and point out that the recent financial performance
of the venture industry has been poor. In this section, we
examine the amount of capital in the industry and consider
whether it appears excessive. In the following section, we
8. There has been a proliferation of efforts by the public sector
in many nations in
recent years to encourage the formation of local venture
clusters, albeit with mixed re-
sults. See Kaplan, Martel and Strömberg (2007) and Lerner and
Schoar (2006).
4 Journal of Applied Corporate Finance • Volume 22 Number 2
A Morgan Stanley Publication • Spring 2010
Figure 4 U.S. VC Deals and $ Invested (as % of Market)
Figure 5 U.S. VC Vintage Year IRRs
Source: Private Equity Analyst, Steven N. Kaplan
Source: NVCA
0
1000
2000
3000
4000
5000
6000
7000
0
0.1
0.2
0.3
0.4
0.5
0.6
0.7
1980 1982 1984 1986 1988 1990 1992 1994 1996 1998 2000
2002 2004 2006 2008
D
ea
ls
%
S
to
ck
M
ar
ke
t
Year
VC $ to Market
VC Deals
-20
0
20
40
60
80
100
IR
R
Year
VE
CA
19
81
19
82
19
83
19
84
19
85
19
86
19
87
19
88
19
89
19
90
19
91
19
92
19
93
19
94
19
95
19
96
19
97
19
98
19
99
20
00
20
01
20
02
20
03
20
04
20
05
relative to the overall stock market. And the recent pace of
VC commitments and, particularly, investments is histori-
cally average, not high.
Performance
What about the performance of VC funds? Figure 5 presents
the average vintage year returns reported by Cambridge Asso-
ciates (CA) and by Venture Economics (VE) as of December
2008. The two series track each other very closely, with CA
being higher in the mid-90s vintages and lower in the most
recent vintages. The figure illustrates the large variation in
performance across different vintage years.
Figure 6 presents VE vintage year returns by quartile
of fund performance. The figure illustrates the large differ-
ences in performance between funds in the top and bottom
quartiles of the distribution.
But these figures—and most publicly available data—do
not provide enough information to answer three important
gone below 0.05% of the total stock market; and with the
exception of the three years of the dotcom boom (1999 to
2001), commitments have not gone above 0.23%. Since
2002, commitments have run just slightly above the histori-
cal average (0.146% versus 0.138%).
Figure 4 presents the analogous analysis for venture capital
investments in portfolio companies (through 2008). The left
axis shows VC investments as a fraction of total stock market
value at the beginning of each year. The right axis shows the
number of VC investments. Like Figure 3, Figure 4 shows
that VC investment has been remarkably stable. On average,
U.S. VCs have invested 0.164% of the value of the stock
market each year in portfolio companies. Except in the three
dotcom boom years, investment has not exceeded 0.203% of
the stock market. Since 2002, investments have run slightly
below the historical average (0.155% versus 0.164%).
Both Figures 3 and 4, then, indicate that the U.S. VC
market has been remarkably stable over the last 30 years
5Journal of Applied Corporate Finance • Volume 22 Number 2
A Morgan Stanley Publication • Spring 2010
Figure 6 Venture Returns by Vintage Year Median, Upper, and
Lower Quartile 1984–2005
Source: Venture Economics
-30.0
-20.0
-10.0
0.0
10.0
20.0
30.0
40.0
50.0
60.0
70.0
80.0
90.0
100.0
110.0
120.0
130.0
Median
Upper 1/4
Lower 1/4
19
84
19
85
19
86
19
87
19
88
19
89
19
90
19
91
19
92
19
93
19
94
19
95
19
96
19
97
19
98
19
99
20
00
20
01
20
02
20
03
20
04
20
05
investors would have been $18 not $20 million, and the PME
would have been only 0.87 (18/20.7).
Kaplan and Schoar restrict their analysis largely to funds
raised (or committed) before 1997. Their study finds that the
average VC fund in their sample, net of fees and carry, had
a PME of 0.96. This means that the average fund slightly
underperformed the public stock market after the VCs’ share.
Gross of fees, the average PME was estimated to be 1.25 or
above, and thus well above 1.0.
When Kaplan and Schoar weight their sample by the
amount of capital in the funds, they find an average PME of
1.22 net of fees, indicating that the VC industry as a whole
outperformed the public markets net of fees (as well as gross
of fees).
The reason for the difference between average and capital-
weighted average has to do with timing. As Figure 7 indicates,
PMEs were higher for 1990s vintage years than for 1980s
vintage years. And because more money was committed to VC
in the 1990s than the 1980s, the capital-weighted average gives
more weight to the performance of the fund of the 1990s.
We believe there are several takeaways here. First, VC
returns net of fees have been competitive with the return
from public markets. Second, VC outperforms public markets
gross of fees, but GPs capture a lot of the outperformance (on
average). Third, there is a great deal of variation over time in
whether VC returns outperform or underperform the public
markets.
There are two caveats to these results, one positive and one
negative. On the negative side, the results do not include the
dot-com bust. On the positive side, Cambridge Associates has
a larger sample and has reported higher returns, indicating
that Kaplan and Schoar may understate VC performance.
questions. First, how do VC returns really compare with
public stock market returns? Second, do the same general
partners (GPs) consistently outperform? And, third, how does
fund-raising affect subsequent performance?
In a much-cited study, Kaplan and Schoar (2005)
attempted to answer each of these questions using detailed
fund performance data from Venture Economics on U.S. VC
funds from 1980 through the end of 2001. We now review
the findings of that study.9
VC Performance vs. Public Markets
Kaplan and Schoar (2005) evaluated VC performance rela-
tive to the public stock market by calculating a public market
equivalent (PME). The PME compares an investment in a
VC fund to an investment in the S&P 500 by assuming that
all cash payouts (net of fees) by a fund to LPs are reinvested
at the total return to the S&P 500. The resulting fund value
is then divided by the value of the cash inflows (or inves-
tor contributions) including the fees the investors would
have earned if the funds have been invested in the S&P 500.
Using this measure, any fund with a PME greater than 1.0
outperformed the S&P 500 (net of all fees). The PME is a
particularly relevant measure for LPs who view VC invest-
ments as an alternative to investments in public equities.
To illustrate, if a VC invested $10 million in March of
1997 and sold the investment in March of 2000 for $20
million, the investment would have had an IRR of 26%
gross of fees and earned a multiple of two times. During
that period, however, $10 million invested in the S&P 500
would have grown to $20.7 million. As a result, the PME of
the investment would have been only 0.97 (20/20.7) gross
of fees. Net of a carry of $2 million, the net cash outflow to
9. Later work by others – Gottschalg and Phallipou (2007) and
Hochberg et al.
(2009) – using somewhat later data for U.S. VC funds is largely
consistent with the find-
ings in Kaplan and Schoar (2005).
6 Journal of Applied Corporate Finance • Volume 22 Number 2
A Morgan Stanley Publication • Spring 2010
Figure 8 Excess Vintage Year Return versus Total Market and
NASDAQ
-20.0
-10.0
0.0
10.0
20.0
30.0
40.0
50.0
60.0
70.0
E
xc
es
s
R
et
u
rn
Vintage Year
NASDAQ XRet
Total XRet
19
81
19
80
19
82
19
83
19
84
19
85
19
86
19
87
19
88
19
89
19
90
19
91
19
92
19
93
19
94
19
95
19
96
19
97
19
98
19
99
20
00
20
01
20
02
20
03
20
04
20
05
Figure 7 U.S. VC PME by Vintage Year
0.50
1.00
1.50
2.00
2.50
1980 1981 1982 1983 1984 1985 1986 1987 1988 1989 1990
1991 1992 1993 1994 1995
P
M
E
Vintage Year
0.00
vintage, we use the four-year IRRs because five-years are not
available.) Because of timing differences, this provides an
imperfect measure of the net-of-market performance of these
vintages. We arbitrarily stop at 2005 because more recent
vintages have likely not had enough time to establish even
an inexact estimate of their performance.
Figure 8 shows excess returns by vintage year from 2000
to 2005. For the entire period, performance has been roughly
equal to the total stock market. Two vintages have IRRs below
the total market return; two have IRRs roughly the same; and
two have IRRs above. When compared to NASDAQ, four
of the six vintages exceed NASDAQ. These results suggest
that VC funds have held their own relative to public stock
markets over this decade.
Figure 9 plots the PMEs from Kaplan and Schoar (2005)
against the excess returns we calculated relative to the total
market. This graph indicates that the excess returns calculated
What about more recent vintages? There are two problems
in estimating the performance of the more recent vintages.
The first is a practical one: the cash flows to the individual
funds are not readily available. Thus, we cannot undertake
PME analyses, only a cruder assessment of overall perfor-
mance. Second, because the investments remain largely in the
portfolios of the venture groups, we do not know how much
the more recent funds are really worth. Given the difficulty
of valuing venture firms and the varying practices regard-
ing marking-to-market portfolios, we cannot be sure of the
underlying values. As a result, the analysis that follows is
somewhat speculative.
With these qualifications, we now compare the perfor-
mance of recent vintages to that of the stock market. We
compare the average vintage year IR R (using Venture
Economics returns) to the five-year IRR of the total stock
market and to the five-year IRR of NASDAQ. (For the 2005
7Journal of Applied Corporate Finance • Volume 22 Number 2
A Morgan Stanley Publication • Spring 2010
Figure 9 Vintage Year Return less NASDAQ Return versus
PME
0.00
0.50
1.00
1.50
2.00
2.50
-20.0
-10.0
0.0
10.0
20.0
30.0
40.0
50.0
60.0
P
M
E
E
xc
es
s
R
et
u
rn
Vintage Year
Excess Return
PME
19
81
19
80
19
82
19
83
19
84
19
85
19
86
19
87
19
88
19
89
19
90
19
91
19
92
19
93
19
94
19
95
19
96
19
97
19
98
19
99
20
00
20
01
20
02
20
03
20
04
20
05
preference of LPs to invest in top quartile funds or GPs. Some
LPs have taken this preference a step farther and believe that
it does not make sense to invest in venture capital at all unless
they can invest in top quartile, or even top decile, funds.
Consistent with wide differences in performance, Kaplan
and Schoar find large differences between the bottom and
top quartiles. Funds in the top quartile have PMEs of 1.11
and above while those in the bottom quartile have PMEs of
0.67 and below. They also find strong evidence of persistence.
Subsequent fund performance is significantly related to previ-
ous fund performance for the same GPs. They also find a
strongly significant relationship between the performance of
funds that are two apart (e.g., funds III and V) and even three
apart. This is important because those funds are less likely to
have investments in common.10
What’s more, this persistence of returns among venture
capitalists is notably different from findings for other asset
classes. Similar studies of mutual funds find no evidence of
persistence among top performers. Studies of hedge funds
have mixed results, but generally find limited evidence of
persistence.
There are three other important comments to make about
persistence:
First, persistence is not concentrated in the top decile.
When Kaplan and Schoar divided funds into performance
terciles (thirds), they found that funds in the top tercile
typically had PME’s above 1, indicating outperformance of
the public stock market net of fees. As with the overall persis-
tence result, funds in the top tercile were significantly more
likely to repeat in the top tercile than funds in the middle or
bottom tercile.
this way correlated with PMEs. In particular, when excess
returns are positive, PMEs tend to be greater than 1.
We confirmed this by estimating a regression of the
PMEs against the excess return measure. We obtained the
following result:
PME = 1.1 + 0.05 x Excess Return %
[0.01]
where 0.01 is the standard error of the estimated relationship.
This regression indicates a highly significant relationship.
Given that recent vintages have returns comparable to those
of the overall stock market, this regression suggests that the
recent vintages will perform about as well as public markets
when all is said and done.
As we noted earlier, this analysis assumes that the 2000 to
2005 vintages are correctly marked-to-market. To the extent
that bad investments have not yet been written down, the
funds are overvalued and the ultimate results will be worse
than the public markets. To the extent that good investments
have not yet been written up, the funds are undervalued and
the ultimate results will be better than the public markets.
We suspect that, on average, those vintages are underval-
ued because most bad investments have been written down as
they have failed or needed additional financing (at lower valua-
tions). At the same time, many companies that are performing
well, particularly in IT, have not been written up.
Persistence
The second question that Kaplan and Schoar address is the
consistency, or “persistence,” of performance. It is widely
believed that the best GPs in venture capital consistently
outperform other GPs. This observation explains the strong
10. More recent papers that have revisited this question with
updated data sets have
found similar results.
8 Journal of Applied Corporate Finance • Volume 22 Number 2
A Morgan Stanley Publication • Spring 2010
Figure 10 Looking at Venture Funds and Returns
Source: Lerner, Leamon and Hardymon, 2011.
0%
5%
10%
15%
20%
25%
10 20 50 100 200 500 1,000 2,000 5,000
P
re
d
ic
te
d
R
el
at
iv
e
IR
R
Venture Capital–Fund Size ($ millions)
fund-raising related to performance, but so is overall indus-
try fundraising. When performance is strong, LPs commit
more capital to venture capital.
In turn, fundraising has an effect on future venture capital
performance, but not in a good way. When more capital is
committed to or invested in venture capital, vintage year
returns suffer. As a result, venture capital has a self-correct-
ing mechanism: a period of poor returns leads to decreased
inflows, which in turn leads to a recovery in returns. Thus,
there has historically been a strong element of “mean rever-
sion” in venture returns.
To explore these relationships, we again used regression
analysis. This time, we attempted to predict vintage year
returns using the amount of capital committed to venture
capital. To better capture the amount of capital available,
we used capital committed in the same vintage year and the
previous vintage year. To make different time periods compa-
rable, we measured capital committed as a fraction of the total
beginning of year stock market value.
When running regressions that use average vintage year
returns reported by Venture Economics and Cambridge Associ-
ates, we came up with the following two relationships:
Venture Economics:
IRR = 18% – 28.1 x Capital Committed last two years as % of
market.
[12.1]
Cambridge Associates:
IRR = 24% – 41.1 x Capital Committed last two years as % of
market.
[15.7]
Both of these results are strongly statistically significant.
Figure 11 shows these relationships graphically.
Second, although there is strong statistical evidence of
persistence in venture capital, it is by no means guaranteed.
If subsequent performance were random, roughly 33% of top
tercile funds should repeat in the top tercile. If subsequent
performance were completely persistent, 100% of top tercile
funds would repeat in the top tercile. Kaplan and Schoar find
the true level of persistence is 50%.
Third and last, fund size is the enemy of persistence. GPs
with funds that have produced high returns tend to get larger
(while GPs of funds with poor returns either get smaller or
are unable to raise additional funds). Kaplan and Schoar find
that, for funds raised by the same GP, a 50% increase in fund
size is associated with roughly a 0.07 decline in PME, which
translates into a 1.5% to 2% decline in a fund’s IRR.
Moreover, for all GPs, there appears to be a tradeoff
between size and returns. In their recent study of the relation
of fund size to IRRs, Lerner et al. (2011), as shown in Figure
10, find that better GPs get larger, which is accompanied by
increases returns for a while. But at a fund size of roughly
$200 million, the negative effect of size kicks in and perfor-
mance stops increasing with size. At fund sizes greater than
$500 million, performance clearly begins to decline.
Overall, then, we think the persistence results have two
implications. First, the top-decile funds are not the only
consistent outperformers. Persistence is evident in the returns
of even the top third of VCs. Second, even though persistence
exists, outperformance is not guaranteed. Top quartile and
top decile GPs do have bad funds, particularly after they have
raised a lot of capital.
Fundraising and Future Performance
The last question of interest is the relation of fundraising
and performance. It turns out that not only is individual GP
9Journal of Applied Corporate Finance • Volume 22 Number 2
A Morgan Stanley Publication • Spring 2010
Figure 11 VC Vintage Year Returns vs. Fundraising
-10
0
10
20
30
40
50
60
70
80
0 0.1 0.2 0.3 0.4 0.5 0.6 0.7 0.8 0.9
V
in
ta
ge
Y
ea
r
IR
R
Commitments Last Two Years As % of Stock Market
Figure 12 VC-Backed IPOs by Year 1985–2008
0
50
100
150
200
250
300
# IPOs
19
85
19
87
19
89
19
91
19
93
19
95
19
97
19
99
20
01
20
03
20
05
20
07
Source: Jay Ritter
industry, with many investors thinking of terminating their
commitments to this asset class, this is actually good news
for venture investors who continue to invest. To the extent
that the past is a guide to the future, the reduced inflows are
likely to translate into higher venture returns.
Looking Forward
The previous sections describe the past and present of venture
capital. The more pressing question is what will happen going
forward. In particular, is the traditional venture capital model
broken?
One of the reasons that some believe the VC model is
broken is concern about the increased difficulty of taking
companies public. Figure 12, which shows the number
of venture backed IPOs in the U.S. from 1985 to 2008,
suggests there may be good reason for such concern. In
Moreover, when we repeated the analysis using capital
invested in venture capital companies instead of capital
committed, we obtained similar results:
Venture Economics:
IRR = 18% – 24.4 x Capital Invested last two years as % of
market.
[9.5]
Cambridge Associates: |
IRR = 26% – 36.4 x Capital Invested last two years as % of
market.
[12.7]
In sum, there is a strong negative correlation between VC
returns and the preceding years’ capital commitments and
investments. And if, as appears to be the case, we are now in
a period of general disillusionment with the venture capital
10 Journal of Applied Corporate Finance • Volume 22 Number 2
A Morgan Stanley Publication • Spring 2010
Figure 13 IPO and M&A Exit Values to Market Cap
0.00%
0.20%
0.40%
0.60%
0.80%
1.00%
1.20%
1.40%
1985 1987 1989 1991 1993 1995 1997 1999 2001 2003 2005
2007
M&A Values
IPO Values
We are skeptical of claims that the VC model is broken
or needs to be radically changed. As our historical analyses
indicated, the level of commitments to and the investment
pace of the U.S. VC industry since 2002 have both been
consistent with the historic averages. At the same time, the
returns to VC funds appear to have been roughly equal to
those of the overall stock market. This does not suggest to
us that there is too much money in U.S. VC, nor does it
indicate to us that the VC model is broken. Instead it appears
to represent the more or less natural evolution of a relatively
competitive market.
In fact, given the unusual and unexplained paucity of
IPOs (and overall exits) between 2004 and 2007, we suspect
there is more upside than downside for the VC vintages of
2001 to 2007. According to informal sources, Sarbanes-Oxley
is likely less costly and more manageable than it was in 2005
and 2006. There are more boutique investment banks with
incentives to market IPOs. And, as we mentioned earlier,
recent reports suggest that there is now a larger pipeline of
IPO candidates.
What Will Happen in the Next Several Years?
As we write this, commitments to U.S. VC partnerships
appear to be historically low in 2009. In 2009, the Private
Equity Analyst reported commitments of about $13 billion to
U.S. VC funds. Compared to the value of the stock market at
the beginning of 2009, commitments are only 0.111% versus
the historical average of 0.138%. Measured relative to the
stock market at the end of the year, the 2009 commitments
are even lower, at 0.086% , as compared to the historical
average of 0.125%. All indications are that commitments are
likely to continue to be low into 2010 and, possibly beyond.
all but one year during the 1990s, there were over 100
VC-backed IPOs. In five of the ten years, there were more
than 150. Then, in the recession/bear market of 2001 to
2003, the number of VC-backed IPOs dropped below 50
each year. But this was not unusual for a down market; a
similar pattern had occurred in the recession/bear market
from 1989 to 1991.
What was unusual and unexpected was the small
number of VC-backed IPOs from 2004 to 2007, averag-
ing only slightly more than 50 per year, despite the robust
stock market over that period and despite the large number
of companies that had received VC funding over the previ-
ous five to ten years. It is not yet clear why there were so few
IPOs. Some blame the increased costs imposed on compa-
nies by the Sarbanes-Oxley legislation. Some blame increased
litigation risk and the concomitant increase in directors’ and
officers’ and other insurance. Some blame inattention from
investment banks that were able to make more money from
other activities. And some blame the scarcity on the fact that
too many similar companies were funded during the dotcom
boom, competing so fiercely that consumers received most
of the benefits.11
But it’s important to keep in mind that an IPO is not
the only way for a VC to exit an investment. VCs also exit
by selling their portfolio companies. Nevertheless, as shown
in Figure 13, the increase in M&A exits did not offset the
decline in IPOs.
Is the VC Model Broken?
What does all this mean for the U.S. venture capital model?
Is it broken? Does it need to be appreciably smaller? Does it
need to be appreciably different?
11. See Weild and Kim (2009) for a discussion of some of these
and other potential
explanations.
11Journal of Applied Corporate Finance • Volume 22 Number 2
A Morgan Stanley Publication • Spring 2010
globally, is many times the magnitude of venture capital invest-
ment, the size of the opportunity is likely to be substantial.
Conclusion
The U.S. VC model has been enormously successful over the
last 30 years. During that time, the U.S. VC industry has
consistently received commitments and invested at a pace of
roughly 0.15% of the value of the overall U.S. stock market.
Of course, there has been some variation in commitments
and investments around that mean—a variation that can be
traced in large part to the recent returns of the industry. As
a general rule, higher returns have typically attracted more
capital from LPs. But the greater capital has put downward
pressure on returns, which in turn has resulted in smaller
capital commitments. And as less capital has predictably led
to increased returns, we have seen another increase in capital
commitments and investment—and hence the beginnings
of a new cycle.
We see little that makes us believe that the VC model
has changed or is broken. As far as we can tell, we are now
leaving a period with slightly above average capital and average
to slightly below average returns for a period of well below
average capital. We would not be surprised to see this followed,
perhaps quickly, by a period of above-average returns.
steven kaplan is the Neubauer Family Professor of
Entrepreneurship
and Finance, as well as Faculty Director of the Polsky
Entrepreneurship
Center, at the University of Chicago’s Booth School of
Business. Along
with his many published papers on private equity and
entrepreneurial
finance, and on corporate governance and M&A, Steve has been
recog-
nized as one of the top-rated business school teachers in the
country.
He serves on the boards of three companies: Accretive Health,
Columbia
Acorn Funds, and Morningstar.
josh lerner is the Jacob H. Schiff Professor of Investment
Banking
at Harvard Business School, and organizes two groups at the
National
Bureau of Economic Research: Entrepreneurship and Innovation
Policy
and the Economy. He has written extensively about venture
capital and
private equity. His most recent book is Boulevard of Broken
Dreams:
Why Public Efforts to Boost Entrepreneurship and Venture
Capital Have
Failed—and What to Do About It. He has led an international
team of
scholars in a multi-year study of the economic impact of private
equity for
the World Economic Forum. He is the winner of the 2010
Global Entre-
preneurship Research Award.
Based on the historical relationship between commitments
and performance, the low level of commitments suggests that
returns to the 2009 and 2010 vintage years are likely to be
relatively strong.
And there are other grounds for optimism about VC.
The most compelling is the transformation of the U.S. corpo-
rate research and development system. The central corporate
R&D laboratory was a dominant feature of the innovation
landscape in the U.S. for most of the 20th century. While
the concept of the centralized laboratory originated in the
German chemical industry, U.S. corporations had adopted
it with enthusiasm by the 1950s. These campus-like facilities
employed many thousands of researchers, many of whom
were free to pursue fundamental science with little direct
commercial applicability. Among the best-known were Bell
Laboratories (with 11 Nobel Laureates) and IBM Central
Research (with 5).
Beginning in the early 1990s, however, American corpo-
rations began fundamentally rethinking the role of these
centralized research facilities.12 Reflecting both a perception
of disappointing commercial returns and intensified competi-
tive pressures, U.S. companies undertook a variety of changes
to these facilities. Notable among them were paring the size
of central research facilities in favor of divisional laboratories
and relying much more heavily on what has been termed
“open innovation”—that is, alliances with and acquisitions
of smaller firms.
To economists, however, these changes are not surprising.
Observers such as Michael Jensen have contrasted the incen-
tives within corporate research facilities unfavorably with
those offered by venture capitalists. Jensen suggests that had
higher-powered incentives been offered, some of the poor
performance of research-intensive firms would have been
avoided.13 And consistent with this argument, Kortum and
Lerner (2000) find that venture-backed firms are approxi-
mately three times as efficient in generating innovations as
corporate research.
This transformation suggests that the demand for
venture-backed firms is likely to increase in the medium
and longer term. The model of growing companies for
full or partial acquisition by larger firms—which has been
standard practice for many years in the computer network-
ing business, for instance—is likely to be a growing segment
of the venture activity in the years to come. And given
the fact that corporate research spending, both in the U.S. and
12. See, for example, the discussions in Rosenbloom and
Spencer (1996) and Ches-
brough (2003)).
13. Jensen (1993).
12 Journal of Applied Corporate Finance • Volume 22 Number 2
A Morgan Stanley Publication • Spring 2010
Kaplan, S. and P. Strömberg, 2004, Characteristics,
Contracts, and Actions: Evidence From Venture Capitalist
Analyses, Journal of Finance 59, 2177-2210.
Kedrosky, Paul, 2009, “Right-Sizing The U.S. Venture
Capital Industry,” Working paper, Kauffman Foundation.
Kortum, S., and J. Lerner, 2000, “Assessing the contri-
bution of Venture Capital to Innovation,” Rand Journal of
Economics 31, 674-92.
Lerner, J., 1995, “Venture Capitalists and the Oversight
of Private Firms,” Journal of Finance 50, 301-318.
Lerner, J., 2009, The Boulevard of Broken Dreams: Why
Public Efforts to Boost Entrepreneurship and Venture Capital
Have Failed—and What to Do About It. Princeton: Princeton
University Press.
Lerner, J., A. Leamon, and F. Hardymon, 2011, Private
Equity, Venture Capital, and the Financing of Entrepreneurship:
The Power of Active Investing, New York: Wiley.
Lerner J., and A. Schoar, 2005, “Does Legal Enforcement
Affect Financial Transactions?: The Contractual Channel
in Private Equity,” Quarterly Journal of Economics, 120,
223-246.
Puri, M. and R. Zarutskie, 2009, “On the lifecycle dynam-
ics of venture-capital- and non-venture-capital-financed
firms,” Working paper, Duke University.
Sorensen, M., 2007, How Smart is Smart money? An
Empirical Two-sided Matching Model of Venture Capital,
Journal of Finance 62, 2725-2762.
U.S. Small Business Administration, 2009, The Small
Business Economy, Washington: U.S. Government Printing
Office.
Weild, David and Edward Kim, 2009, “Market structure
is causing the IPO crisis,” Working paper, Grant Thornton.
References
Austin, S., 2009, “Majority of VCs in Survey Call Industry
‘Broken,’” Wall Street Journal Blog, June 29.
Chesbrough, H., 2003, Open Innovation: The New
Imperative for Creating and Profiting from Technology,
Boston: Harvard Business School Press.
Gottschalg, O., and L. Phalippou, 2009, “The Perfor-
mance of Private Equity Funds,” Review of Financial Studies
22, 1747-1776.
Hellmann, T. and Puri, M., 2002, “Venture Capital
and the Professionalization of Start-Up Firms: Empirical
Evidence” Journal of Finance 57, 169-197.
Hochberg, Y., A. Ljungqvist,and A. Vissing-Jørgensen,
2009, Informational Hold-up and Performance Persistence in
Venture Capital,” Working paper, Northwestern University.
Jensen, M., 1993, “The Modern Industrial Revolution,
Exit, and the Failure of Internal Control Systems,” Journal
of Finance 48, 831-880.
Kaplan, S., F. Martel, and P. Strömberg, 2007, “How Do
Legal Differences and Learning Affect Financial Contracts?”
Journal of Financial Intermediation 16, 273-311.
Kaplan, S., and A. Schoar, 2005, “Private Equity Perfor-
mance: Returns, Persistence and Capital Flows,” Journal of
Finance 60, 1791-1823.
Kaplan, S., B. Sensoy and P. Strömberg, 2009, Should
investors bet on the jockey or the horse? Evidence from the
evolution of firms from early business plans to public compa-
nies, Journal of Finance 64, 75-115.
Kaplan, S. and P. Strömberg, 2001, “Venture Capital-
ists As Principals: Contracting, Screening, and Monitoring,”
American Economic Review 91, 426-430.
Kaplan, S. and P. Strömberg, 2003, Financial Contracting
Theory Meets the Real World: Evidence from Venture Capital
Contracts, Review of Economic Studies 70, 281-315.
One Million Students Homeless
With collaboration and smart strategies, some districts are
cracking the code and
finding ways to help their homeless students.
By Caralee Adams
PRINT
EMAIL
The Teacher Store
Star Students! Printer
Paper
Colorful printer paper that can
be used as awards, invitations,
notes to parents, classroom
newsletters, and more. Two
writing templates are
included—one for the primary
grades and one for the upper
grades. Measures 8 1/2" x 11".
Includes 50 sheets + writing
templates.
$3.38 You save: 25%
Design Paper | Grades PreK-5
The Scholastic Store
Autism Spectrum
Disorders in the
Mainstream Classroom
: How to Reach and
Teach Students with
ASDS
by Boroson, Barbara
This engaging and informative
book gives you the knowledge
you need to understand
students with autism spectrum
disorders (ASDs) and the
strategies you can use to help
them succeed in school. An
educator with more than 20
years experience working with
students with ASDs, Barbara
Boroson guides you through
creating a responsive
classroom attuned to the
needs of your students with
ASDs, and she shares
http://www.scholastic.com/content/
https://store.scholastic.com/webapp/wcs/stores/servlet/ProductD
isplay?productId=50532&langId=-
1&storeId=10052&catalogId=10051
javascript:addToCartTS('96630')
https://store.scholastic.com/webapp/wcs/stores/servlet/ProductD
isplay?productId=50532&langId=-
1&storeId=10052&catalogId=10051&sa_campaign=internal_ads
/scholastic3_0/search
http://shop.scholastic.com/webapp/wcs/stores/servlet/ProductDi
splayView?productId=96630&langId=-
1&storeId=10751&catalogId=10004&sa_campaign=internal_ads
/scholastic3_0/search
preventative strategies that
help head off challenging
behavior before it becomes
disruptive. She offers
suggestions for breaking
through to hard-to-reach kids,
ideas for collaborating with
families, and strategies for
differentiating instruction to
support every student. The
end goal is a classroom in
which all students feel valued
and respected, in which all
students can learn and grow.
For use with Grades K-6.
Biography:
Barbara Boroson holds an
undergraduate degree from
Cornell and a masters degree
in social work from Columbia
University. She has worked in
the field of autism spectrum
education for almost twenty
years in clinical,
administrative, and advisory
capacities. She is a guest
lecturer at colleges of
education and, as a
consultant, helps districts
integrate students on the
spectrum into mainstream
settings. Her writing has
appeared in publications
across the country. Barbara
lives just outside of New York
City with her husband and
their two children.
$19.99 You save: 20%
books;teaching
resources;paperbacks | Ages
5-12
Ways to Support Homeless Students
- Change bus routes so homeless students living in shelters or
motels are picked up first and delivered last to
respect their privacy.
- Consult service providers in shelters to learn what needs
homeless students may have, from transportation
to supplies to health care.
- Create a report card to hand to the next teacher that charts
students' progress. A running record of students'
strengths and needs will help them to maintain continuity if
they switch schools. Also, give students a weekly
self-evaluation form to reflect on what they are proud of
accomplishing.
- Adjust homework by eliminating assignments requiring a
computer, a TV, or a phone, or offer supplies or
school time to complete those tasks.
- Assign a buddy to each homeless student. They often enter
school midyear, and a friend can familiarize
them with rules and procedures.
- Never punish homeless students by taking away a possession,
friend time, or recess.
javascript:addToCartSSO('50532')
Source: BethAnn Berliner, Imagine the Possibilities
Sourcebook, wested.org
The school secretary couldn't believe the student was homeless.
He had new Nike
sneakers, carried a cell phone, and looked like any other high
school student. That's
because Beth McCullough was doing her job.
McCullough is the homeless education coordinator for Adrian
Public Schools in
southeastern Michigan. Through a local service organization,
she was able to get a pair of
size-13 shoes for the boy. She gave him a prepaid phone for
safety, since he was sleeping
in an abandoned building. And every morning, McCullough
made sure the locker room was
open early and stocked with a clean towel and shampoo so he
could shower.
"If you have a good homeless program, you shouldn't be able to
tell who is homeless by the
way they look," says McCullough. She takes the secretary's
skepticism as "a compliment."
McCullough is one of 16,000 liaisons across the nation who
support a growing number of
homeless students. In 2009-10, there were nearly a million
homeless students in U.S. public
schools. That's a 38 percent increase from 2006-07 and is likely
an undercount, reports
Barbara Duffield, policy director for the National Association
for the Education of Homeless
Children and Youth (NAEHCY) in Washington, D.C.
"With the recession, job loss, unemployment, and the fore-
closure crisis, it's unprecedented
to see homelessness on this scale," says Duffield. "Rather than
being a blip, it's now
lasting."
As more families, including some who were once middle class,
enter the ranks of the
homeless, the demand for services and the need for sensitivity
training are rising just as
schools' budgets are being cut. Some districts are coping by
partnering with community-
based organizations and getting creative with services. Others
are taking advantage of
government subgrants. Advocates maintain there are ways to
accommodate this vulnerable
population. But first educators must learn how to best approach,
and deal with, the
challenges involved.
Meeting the Law's Requirements
in 1987, the federal government enacted the Mckinney-Vento
Act, which requires that every
http://www.wested.org/
school district provide homeless students with equal access to
public education. Districts
need to count homeless students and have a homeless liaison to
serve their needs.
Homeless students, as defined by the law, include those who are
staying in a hotel/motel or
shelter, are unsheltered, or are "doubled up" with friends or
family. Being doubled up is the
most common, accounting for 71 percent of homeless students
in the 2009-10 school year.
The law sets up competitive subgrants to help fund support
services. Many districts use
grants to transport students back to their schools of origin so
they can have some stability in
their educational life. Others use subgrants for after-school
programs, tutoring, and school
supplies. But districts must know how to craft an effective
application.
The program is "woefully underfunded," says Duffield, with $65
million a year in federal
grants going to about 3,000 of the country's 15,000 school
districts. All schools need to
provide homeless services, but most do so without extra grants.
"The McKinney-Vento Act is supposed to count kids and do
everything to help them
succeed, but schools are strapped for resources," says Ellen
Bassuk, founder of the
National Center on Family Homelessness (NCFH) in Needham,
Massachusetts. "It's not
about intention; it's about resources. Some schools have better
resources than others."
Since 1988, Bassuk's organization has been working on the
problem of family
homelessness. Lack of affordable housing and poverty are
drivers, along with the increase
in families headed by single moms, which now make up one in
five families nationwide. "If
the mom is stressed, the kids will be stressed," says Bassuk.
"Going to school tired,
stressed, and worried, and then having to pay attention-it's very
hard."
Pairing Sensitivity With Assistance
because their living situations are so unstable, children who are
homeless find it difficult to
maintain academic continuity, says Diana Bowman, program
director for the National
Center for Homeless Education at the SERVE Center in Browns
Summit, North Carolina.
"Every time a child moves from one school to another, there are
issues of being in a place
where nobody knows them, with a new peer group. Moving from
one new curriculum to
another-that's a huge challenge," she says.
To help children adapt, and to identify those who are homeless
in a discreet manner, a
district or school must have a coordinated and solid plan. At the
top, administrators need to
understand their responsibilities under McKinney-Vento and
support the work of homeless
liaisons, says McCullough. A superintendent once told her the
district was doing for a
homeless kid what it would do for any kid. "It isn't enough to do
what we would do for any
student," responded McCullough. They need extra support, just
as special education
students do.
In the classroom, teachers should look for children who appear
sleepy or are wearing the
same clothes, or who are carrying lots of belongings, hoarding
food, or talking about moving
often, says Bowman.
Many children are embarrassed about their situation, and
interventions should be done
confidentially. Consider avoiding the term "homeless"
altogether, says Lisa Mentesana,
support specialist with the Beaverton, Oregon, school district,
which has the highest
homeless student population in the state. In 2010, she worked
with 1,580 students; in the
fall of 2011, she had already served 1,033 students.
"In our first communication, we never say ‘homeless,'" she
says. "We say, ‘We are from a
social support office and understand you might be having a
difficult time. We wanted to let
you know about some support services available.'" Families who
are doubling up often don't
consider themselves to be homeless, although they are eligible
for support under the law.
Mentesana has seen families trying to "sneak" their children
into school after they've moved
out of the area, and they are relieved when they learn their kids
can stay in their home
school.
Small Changes Can Make a Big Difference
Dona Bolt, homeless education coordinator for the Oregon
Department of Education, has
seen homelessness rise over the past 25 years. Since families
are mobile and districts often
share students, school administrators must collaborate, she says.
They can coordinate
transportation and outreach efforts and partner to share
community resources and
strategies.
Sometimes school policies need to be revisited to serve
homeless students, says Bassuk of
the NCFH. Kids who are homeless may act out and need a
second chance, prompting
administrators to rethink zero-tolerance policies. "These are not
bad kids," says Bassuk.
"They are traumatized kids."
Experts suggest training administrators, teachers, counselors,
and even bus drivers on the
law and how to work with this population to meet their needs.
Teachers can help by being flexible with assignments and
procedures, says BethAnn
Berliner, a senior research associate at WestEd, a research,
development, and service
agency in Oakland, California. A homeless student may not
want to hang up a coat, for
instance, since it may be his or her only one. Letting the child
wear it in class can help to
make him or her feel more secure.
"From constantly moving and not having personal space, these
students may have difficulty
completing tasks," she adds. "Divide big assignments into bite-
size pieces." And remember
that these kids often live in crowded conditions, without a quiet
place to study or computer
access. Providing a clipboard to do homework and allowing a
paper to be handwritten are
simple and reasonable accommodations. If parents can't make a
conference, don't presume
that they don't care, adds McCullough. They might lack
transportation or the ability to get
away from work.
What the Community Can Do
in Pittsburgh, the homeless children's education fund supports
17 after-school learning
centers that serve students in housing facilities for the
homeless. The centers are equipped
with computers and books, and qualified tutors help students
with homework on weekday
afternoons.
Some of the centers have reading specialists from the local
schools who know the
curriculum and have a direct line back to the teachers, says Bill
Wolfe, the group's
executive director. These connections and support through
community-based programs
help to provide children with access to the best possible
education.
In the Adrian Public Schools, McCullough has seen funding for
her program decrease from
$62,000 last year to $39,000 this year. She uses more volunteers
and recently worked with
a local business on a "Pajama Rama" fund-raiser that brought in
$8,000 to help bridge the
gap. "I'm lucky to have a very giving community," she says.
Shifting the Mind-Set
Over the past decade, Berliner says, the landscape has
improved-but more needs to be
done. "It's really easy to blame children for their behaviors that
frustrate us-when they don't
bring in their homework or they are destructive in the
classroom," she says. "Those are
things that we as adults need to deal with rather than blaming
the kids. How can you blame
a kid for not doing homework when they have no place to do
homework?"
Educators should not see homeless students as threatening.
Instead, they must dig deep to
understand their needs, advises Bassuk. "Talk to the kids and
find out what's bothering
them. Then, in that context, find a way to contain the child.
Kids will really perk up if they are
responded to appropriately." With the right help, she says, kids
can be resilient.
And keep in mind that children who are homeless don't always
ask for help, partly because
they don't want to be categorized, especially at the high school
level, says Denise Ross,
supervisor for homeless education programs in Maryland's
Prince George's County Public
Schools. Of the district's 124,000 students, homeless services
helped 2,700 of them last
year.
"School is a safe haven for them. They want to be in school,"
says Ross. "They want to be
successful. Sometimes there are other things going on and they
need an advocate in the
school. They want to learn, and they want to be accepted."
Journal of Applied Corporate Finance • Volume 22 Number 2 A Mo.docx

Contenu connexe

Similaire à Journal of Applied Corporate Finance • Volume 22 Number 2 A Mo.docx

Right Sizing The US VC Environ061009202
Right Sizing The US VC Environ061009202Right Sizing The US VC Environ061009202
Right Sizing The US VC Environ061009202Kristin DePlatchett
 
US Venture Capital
US Venture CapitalUS Venture Capital
US Venture CapitalColumbia
 
Grant Thornton IPO Crisis And More
Grant Thornton IPO Crisis And MoreGrant Thornton IPO Crisis And More
Grant Thornton IPO Crisis And Morefnapoli
 
Venture Capital Investments Q1 ’06 – MoneyTree Release
  	Venture Capital Investments Q1 ’06 – MoneyTree Release   	Venture Capital Investments Q1 ’06 – MoneyTree Release
Venture Capital Investments Q1 ’06 – MoneyTree Release mensa25
 
HOLT Cash and the Corporate Life Cycle White Paper11.2010
HOLT Cash and the Corporate Life Cycle White Paper11.2010HOLT Cash and the Corporate Life Cycle White Paper11.2010
HOLT Cash and the Corporate Life Cycle White Paper11.2010Michael Oliveros
 
Trends in Healthcare Investments and Exits Report
Trends in Healthcare Investments and Exits ReportTrends in Healthcare Investments and Exits Report
Trends in Healthcare Investments and Exits ReportSilicon Valley Bank
 
Do Initial Public Offerings impact Capital Structure [cm716]
Do Initial Public Offerings impact Capital Structure [cm716]Do Initial Public Offerings impact Capital Structure [cm716]
Do Initial Public Offerings impact Capital Structure [cm716]Charmaine Marimba
 
2016_Commercial_Real_Estate_Outlook
2016_Commercial_Real_Estate_Outlook2016_Commercial_Real_Estate_Outlook
2016_Commercial_Real_Estate_OutlookDavid A. Kessler
 
Venture Capital in the US
Venture Capital in the USVenture Capital in the US
Venture Capital in the USEric Gabrys
 
Decision making process of venture capitalists (v cs)
Decision making process of venture capitalists (v cs)Decision making process of venture capitalists (v cs)
Decision making process of venture capitalists (v cs)yhtiyar
 
The INFLUENCE OF FINANCIAL MARKETS ON INVESTMENT IN VENTURE CAPITAL
The INFLUENCE OF FINANCIAL MARKETS ON INVESTMENT IN VENTURE CAPITALThe INFLUENCE OF FINANCIAL MARKETS ON INVESTMENT IN VENTURE CAPITAL
The INFLUENCE OF FINANCIAL MARKETS ON INVESTMENT IN VENTURE CAPITALBABACAR SECK
 
2016 IVCA Viewpoint - The Art+Science of Investing in Private Companies
2016 IVCA Viewpoint - The Art+Science of Investing in Private Companies2016 IVCA Viewpoint - The Art+Science of Investing in Private Companies
2016 IVCA Viewpoint - The Art+Science of Investing in Private Companiesillinoisvc
 
Denver vc report 2013
Denver vc report   2013Denver vc report   2013
Denver vc report 2013Lisa Amidon
 
Funding A Technology Start Up Insights Into The World Of Venture Capital
Funding A Technology Start Up   Insights Into The World Of Venture CapitalFunding A Technology Start Up   Insights Into The World Of Venture Capital
Funding A Technology Start Up Insights Into The World Of Venture CapitalThomas Weithman
 
SME development, constraints, credit risk & islamic banking solutions
SME development, constraints, credit risk & islamic banking solutionsSME development, constraints, credit risk & islamic banking solutions
SME development, constraints, credit risk & islamic banking solutionsMace Abdullah
 
How Corporate Governance Matters - Credit Suisse 2016 Report
How Corporate Governance Matters - Credit Suisse 2016 ReportHow Corporate Governance Matters - Credit Suisse 2016 Report
How Corporate Governance Matters - Credit Suisse 2016 ReportTurlough Guerin GAICD FGIA
 
Mercer Capital's Value Focus: Venture Capital | Mid-Year 2016
Mercer Capital's Value Focus: Venture Capital | Mid-Year 2016Mercer Capital's Value Focus: Venture Capital | Mid-Year 2016
Mercer Capital's Value Focus: Venture Capital | Mid-Year 2016Mercer Capital
 
The Purpose Of The Cash Flow Statement
The Purpose Of The Cash Flow StatementThe Purpose Of The Cash Flow Statement
The Purpose Of The Cash Flow StatementRikki Wright
 
Portico Advisers: Is Emerging Markets Private Equity Dying?
Portico Advisers: Is Emerging Markets Private Equity Dying?Portico Advisers: Is Emerging Markets Private Equity Dying?
Portico Advisers: Is Emerging Markets Private Equity Dying?PorticoAdvisers
 

Similaire à Journal of Applied Corporate Finance • Volume 22 Number 2 A Mo.docx (20)

Right Sizing The US VC Environ061009202
Right Sizing The US VC Environ061009202Right Sizing The US VC Environ061009202
Right Sizing The US VC Environ061009202
 
US Venture Capital
US Venture CapitalUS Venture Capital
US Venture Capital
 
Grant Thornton IPO Crisis And More
Grant Thornton IPO Crisis And MoreGrant Thornton IPO Crisis And More
Grant Thornton IPO Crisis And More
 
Venture Capital Investments Q1 ’06 – MoneyTree Release
  	Venture Capital Investments Q1 ’06 – MoneyTree Release   	Venture Capital Investments Q1 ’06 – MoneyTree Release
Venture Capital Investments Q1 ’06 – MoneyTree Release
 
HOLT Cash and the Corporate Life Cycle White Paper11.2010
HOLT Cash and the Corporate Life Cycle White Paper11.2010HOLT Cash and the Corporate Life Cycle White Paper11.2010
HOLT Cash and the Corporate Life Cycle White Paper11.2010
 
Trends in Healthcare Investments and Exits Report
Trends in Healthcare Investments and Exits ReportTrends in Healthcare Investments and Exits Report
Trends in Healthcare Investments and Exits Report
 
Do Initial Public Offerings impact Capital Structure [cm716]
Do Initial Public Offerings impact Capital Structure [cm716]Do Initial Public Offerings impact Capital Structure [cm716]
Do Initial Public Offerings impact Capital Structure [cm716]
 
2016_Commercial_Real_Estate_Outlook
2016_Commercial_Real_Estate_Outlook2016_Commercial_Real_Estate_Outlook
2016_Commercial_Real_Estate_Outlook
 
Findharm96
Findharm96Findharm96
Findharm96
 
Venture Capital in the US
Venture Capital in the USVenture Capital in the US
Venture Capital in the US
 
Decision making process of venture capitalists (v cs)
Decision making process of venture capitalists (v cs)Decision making process of venture capitalists (v cs)
Decision making process of venture capitalists (v cs)
 
The INFLUENCE OF FINANCIAL MARKETS ON INVESTMENT IN VENTURE CAPITAL
The INFLUENCE OF FINANCIAL MARKETS ON INVESTMENT IN VENTURE CAPITALThe INFLUENCE OF FINANCIAL MARKETS ON INVESTMENT IN VENTURE CAPITAL
The INFLUENCE OF FINANCIAL MARKETS ON INVESTMENT IN VENTURE CAPITAL
 
2016 IVCA Viewpoint - The Art+Science of Investing in Private Companies
2016 IVCA Viewpoint - The Art+Science of Investing in Private Companies2016 IVCA Viewpoint - The Art+Science of Investing in Private Companies
2016 IVCA Viewpoint - The Art+Science of Investing in Private Companies
 
Denver vc report 2013
Denver vc report   2013Denver vc report   2013
Denver vc report 2013
 
Funding A Technology Start Up Insights Into The World Of Venture Capital
Funding A Technology Start Up   Insights Into The World Of Venture CapitalFunding A Technology Start Up   Insights Into The World Of Venture Capital
Funding A Technology Start Up Insights Into The World Of Venture Capital
 
SME development, constraints, credit risk & islamic banking solutions
SME development, constraints, credit risk & islamic banking solutionsSME development, constraints, credit risk & islamic banking solutions
SME development, constraints, credit risk & islamic banking solutions
 
How Corporate Governance Matters - Credit Suisse 2016 Report
How Corporate Governance Matters - Credit Suisse 2016 ReportHow Corporate Governance Matters - Credit Suisse 2016 Report
How Corporate Governance Matters - Credit Suisse 2016 Report
 
Mercer Capital's Value Focus: Venture Capital | Mid-Year 2016
Mercer Capital's Value Focus: Venture Capital | Mid-Year 2016Mercer Capital's Value Focus: Venture Capital | Mid-Year 2016
Mercer Capital's Value Focus: Venture Capital | Mid-Year 2016
 
The Purpose Of The Cash Flow Statement
The Purpose Of The Cash Flow StatementThe Purpose Of The Cash Flow Statement
The Purpose Of The Cash Flow Statement
 
Portico Advisers: Is Emerging Markets Private Equity Dying?
Portico Advisers: Is Emerging Markets Private Equity Dying?Portico Advisers: Is Emerging Markets Private Equity Dying?
Portico Advisers: Is Emerging Markets Private Equity Dying?
 

Plus de priestmanmable

9©iStockphotoThinkstockPlanning for Material and Reso.docx
9©iStockphotoThinkstockPlanning for Material and Reso.docx9©iStockphotoThinkstockPlanning for Material and Reso.docx
9©iStockphotoThinkstockPlanning for Material and Reso.docxpriestmanmable
 
a 12 page paper on how individuals of color would be a more dominant.docx
a 12 page paper on how individuals of color would be a more dominant.docxa 12 page paper on how individuals of color would be a more dominant.docx
a 12 page paper on how individuals of color would be a more dominant.docxpriestmanmable
 
978-1-5386-6589-318$31.00 ©2018 IEEE COSO Framework for .docx
978-1-5386-6589-318$31.00 ©2018 IEEE COSO Framework for .docx978-1-5386-6589-318$31.00 ©2018 IEEE COSO Framework for .docx
978-1-5386-6589-318$31.00 ©2018 IEEE COSO Framework for .docxpriestmanmable
 
92 Academic Journal Article Critique  Help with Journal Ar.docx
92 Academic Journal Article Critique  Help with Journal Ar.docx92 Academic Journal Article Critique  Help with Journal Ar.docx
92 Academic Journal Article Critique  Help with Journal Ar.docxpriestmanmable
 
A ) Society perspective90 year old female, Mrs. Ruth, from h.docx
A ) Society perspective90 year old female, Mrs. Ruth, from h.docxA ) Society perspective90 year old female, Mrs. Ruth, from h.docx
A ) Society perspective90 year old female, Mrs. Ruth, from h.docxpriestmanmable
 
9 dissuasion question Bartol, C. R., & Bartol, A. M. (2017)..docx
9 dissuasion question Bartol, C. R., & Bartol, A. M. (2017)..docx9 dissuasion question Bartol, C. R., & Bartol, A. M. (2017)..docx
9 dissuasion question Bartol, C. R., & Bartol, A. M. (2017)..docxpriestmanmable
 
9 AssignmentAssignment Typologies of Sexual AssaultsT.docx
9 AssignmentAssignment Typologies of Sexual AssaultsT.docx9 AssignmentAssignment Typologies of Sexual AssaultsT.docx
9 AssignmentAssignment Typologies of Sexual AssaultsT.docxpriestmanmable
 
9 0 0 0 09 7 8 0 1 3 4 4 7 7 4 0 4ISBN-13 978-0-13-44.docx
9 0 0 0 09 7 8 0 1 3 4 4 7 7 4 0 4ISBN-13 978-0-13-44.docx9 0 0 0 09 7 8 0 1 3 4 4 7 7 4 0 4ISBN-13 978-0-13-44.docx
9 0 0 0 09 7 8 0 1 3 4 4 7 7 4 0 4ISBN-13 978-0-13-44.docxpriestmanmable
 
900 BritishJournalofNursing,2013,Vol22,No15©2.docx
900 BritishJournalofNursing,2013,Vol22,No15©2.docx900 BritishJournalofNursing,2013,Vol22,No15©2.docx
900 BritishJournalofNursing,2013,Vol22,No15©2.docxpriestmanmable
 
9 Augustine Confessions (selections) Augustine of Hi.docx
9 Augustine Confessions (selections) Augustine of Hi.docx9 Augustine Confessions (selections) Augustine of Hi.docx
9 Augustine Confessions (selections) Augustine of Hi.docxpriestmanmable
 
8.3 Intercultural CommunicationLearning Objectives1. Define in.docx
8.3 Intercultural CommunicationLearning Objectives1. Define in.docx8.3 Intercultural CommunicationLearning Objectives1. Define in.docx
8.3 Intercultural CommunicationLearning Objectives1. Define in.docxpriestmanmable
 
8413 906 AMLife in a Toxic Country - NYTimes.comPage 1 .docx
8413 906 AMLife in a Toxic Country - NYTimes.comPage 1 .docx8413 906 AMLife in a Toxic Country - NYTimes.comPage 1 .docx
8413 906 AMLife in a Toxic Country - NYTimes.comPage 1 .docxpriestmanmable
 
8. A 2 x 2 Experimental Design - Quality and Economy (x1 and x2.docx
8. A 2 x 2 Experimental Design - Quality and Economy (x1 and x2.docx8. A 2 x 2 Experimental Design - Quality and Economy (x1 and x2.docx
8. A 2 x 2 Experimental Design - Quality and Economy (x1 and x2.docxpriestmanmable
 
800 Words 42-year-old man presents to ED with 2-day history .docx
800 Words 42-year-old man presents to ED with 2-day history .docx800 Words 42-year-old man presents to ED with 2-day history .docx
800 Words 42-year-old man presents to ED with 2-day history .docxpriestmanmable
 
8.1 What Is Corporate StrategyLO 8-1Define corporate strategy.docx
8.1 What Is Corporate StrategyLO 8-1Define corporate strategy.docx8.1 What Is Corporate StrategyLO 8-1Define corporate strategy.docx
8.1 What Is Corporate StrategyLO 8-1Define corporate strategy.docxpriestmanmable
 
8.0 RESEARCH METHODS These guidelines address postgr.docx
8.0  RESEARCH METHODS  These guidelines address postgr.docx8.0  RESEARCH METHODS  These guidelines address postgr.docx
8.0 RESEARCH METHODS These guidelines address postgr.docxpriestmanmable
 
95People of AppalachianHeritageChapter 5KATHLEEN.docx
95People of AppalachianHeritageChapter 5KATHLEEN.docx95People of AppalachianHeritageChapter 5KATHLEEN.docx
95People of AppalachianHeritageChapter 5KATHLEEN.docxpriestmanmable
 
9 781292 041452ISBN 978-1-29204-145-2Forensic Science.docx
9 781292 041452ISBN 978-1-29204-145-2Forensic Science.docx9 781292 041452ISBN 978-1-29204-145-2Forensic Science.docx
9 781292 041452ISBN 978-1-29204-145-2Forensic Science.docxpriestmanmable
 
8-10 slide Powerpoint The example company is Tesla.Instructions.docx
8-10 slide Powerpoint The example company is Tesla.Instructions.docx8-10 slide Powerpoint The example company is Tesla.Instructions.docx
8-10 slide Powerpoint The example company is Tesla.Instructions.docxpriestmanmable
 
8Network Security April 2020FEATUREAre your IT staf.docx
8Network Security  April 2020FEATUREAre your IT staf.docx8Network Security  April 2020FEATUREAre your IT staf.docx
8Network Security April 2020FEATUREAre your IT staf.docxpriestmanmable
 

Plus de priestmanmable (20)

9©iStockphotoThinkstockPlanning for Material and Reso.docx
9©iStockphotoThinkstockPlanning for Material and Reso.docx9©iStockphotoThinkstockPlanning for Material and Reso.docx
9©iStockphotoThinkstockPlanning for Material and Reso.docx
 
a 12 page paper on how individuals of color would be a more dominant.docx
a 12 page paper on how individuals of color would be a more dominant.docxa 12 page paper on how individuals of color would be a more dominant.docx
a 12 page paper on how individuals of color would be a more dominant.docx
 
978-1-5386-6589-318$31.00 ©2018 IEEE COSO Framework for .docx
978-1-5386-6589-318$31.00 ©2018 IEEE COSO Framework for .docx978-1-5386-6589-318$31.00 ©2018 IEEE COSO Framework for .docx
978-1-5386-6589-318$31.00 ©2018 IEEE COSO Framework for .docx
 
92 Academic Journal Article Critique  Help with Journal Ar.docx
92 Academic Journal Article Critique  Help with Journal Ar.docx92 Academic Journal Article Critique  Help with Journal Ar.docx
92 Academic Journal Article Critique  Help with Journal Ar.docx
 
A ) Society perspective90 year old female, Mrs. Ruth, from h.docx
A ) Society perspective90 year old female, Mrs. Ruth, from h.docxA ) Society perspective90 year old female, Mrs. Ruth, from h.docx
A ) Society perspective90 year old female, Mrs. Ruth, from h.docx
 
9 dissuasion question Bartol, C. R., & Bartol, A. M. (2017)..docx
9 dissuasion question Bartol, C. R., & Bartol, A. M. (2017)..docx9 dissuasion question Bartol, C. R., & Bartol, A. M. (2017)..docx
9 dissuasion question Bartol, C. R., & Bartol, A. M. (2017)..docx
 
9 AssignmentAssignment Typologies of Sexual AssaultsT.docx
9 AssignmentAssignment Typologies of Sexual AssaultsT.docx9 AssignmentAssignment Typologies of Sexual AssaultsT.docx
9 AssignmentAssignment Typologies of Sexual AssaultsT.docx
 
9 0 0 0 09 7 8 0 1 3 4 4 7 7 4 0 4ISBN-13 978-0-13-44.docx
9 0 0 0 09 7 8 0 1 3 4 4 7 7 4 0 4ISBN-13 978-0-13-44.docx9 0 0 0 09 7 8 0 1 3 4 4 7 7 4 0 4ISBN-13 978-0-13-44.docx
9 0 0 0 09 7 8 0 1 3 4 4 7 7 4 0 4ISBN-13 978-0-13-44.docx
 
900 BritishJournalofNursing,2013,Vol22,No15©2.docx
900 BritishJournalofNursing,2013,Vol22,No15©2.docx900 BritishJournalofNursing,2013,Vol22,No15©2.docx
900 BritishJournalofNursing,2013,Vol22,No15©2.docx
 
9 Augustine Confessions (selections) Augustine of Hi.docx
9 Augustine Confessions (selections) Augustine of Hi.docx9 Augustine Confessions (selections) Augustine of Hi.docx
9 Augustine Confessions (selections) Augustine of Hi.docx
 
8.3 Intercultural CommunicationLearning Objectives1. Define in.docx
8.3 Intercultural CommunicationLearning Objectives1. Define in.docx8.3 Intercultural CommunicationLearning Objectives1. Define in.docx
8.3 Intercultural CommunicationLearning Objectives1. Define in.docx
 
8413 906 AMLife in a Toxic Country - NYTimes.comPage 1 .docx
8413 906 AMLife in a Toxic Country - NYTimes.comPage 1 .docx8413 906 AMLife in a Toxic Country - NYTimes.comPage 1 .docx
8413 906 AMLife in a Toxic Country - NYTimes.comPage 1 .docx
 
8. A 2 x 2 Experimental Design - Quality and Economy (x1 and x2.docx
8. A 2 x 2 Experimental Design - Quality and Economy (x1 and x2.docx8. A 2 x 2 Experimental Design - Quality and Economy (x1 and x2.docx
8. A 2 x 2 Experimental Design - Quality and Economy (x1 and x2.docx
 
800 Words 42-year-old man presents to ED with 2-day history .docx
800 Words 42-year-old man presents to ED with 2-day history .docx800 Words 42-year-old man presents to ED with 2-day history .docx
800 Words 42-year-old man presents to ED with 2-day history .docx
 
8.1 What Is Corporate StrategyLO 8-1Define corporate strategy.docx
8.1 What Is Corporate StrategyLO 8-1Define corporate strategy.docx8.1 What Is Corporate StrategyLO 8-1Define corporate strategy.docx
8.1 What Is Corporate StrategyLO 8-1Define corporate strategy.docx
 
8.0 RESEARCH METHODS These guidelines address postgr.docx
8.0  RESEARCH METHODS  These guidelines address postgr.docx8.0  RESEARCH METHODS  These guidelines address postgr.docx
8.0 RESEARCH METHODS These guidelines address postgr.docx
 
95People of AppalachianHeritageChapter 5KATHLEEN.docx
95People of AppalachianHeritageChapter 5KATHLEEN.docx95People of AppalachianHeritageChapter 5KATHLEEN.docx
95People of AppalachianHeritageChapter 5KATHLEEN.docx
 
9 781292 041452ISBN 978-1-29204-145-2Forensic Science.docx
9 781292 041452ISBN 978-1-29204-145-2Forensic Science.docx9 781292 041452ISBN 978-1-29204-145-2Forensic Science.docx
9 781292 041452ISBN 978-1-29204-145-2Forensic Science.docx
 
8-10 slide Powerpoint The example company is Tesla.Instructions.docx
8-10 slide Powerpoint The example company is Tesla.Instructions.docx8-10 slide Powerpoint The example company is Tesla.Instructions.docx
8-10 slide Powerpoint The example company is Tesla.Instructions.docx
 
8Network Security April 2020FEATUREAre your IT staf.docx
8Network Security  April 2020FEATUREAre your IT staf.docx8Network Security  April 2020FEATUREAre your IT staf.docx
8Network Security April 2020FEATUREAre your IT staf.docx
 

Dernier

Interactive Powerpoint_How to Master effective communication
Interactive Powerpoint_How to Master effective communicationInteractive Powerpoint_How to Master effective communication
Interactive Powerpoint_How to Master effective communicationnomboosow
 
Accessible design: Minimum effort, maximum impact
Accessible design: Minimum effort, maximum impactAccessible design: Minimum effort, maximum impact
Accessible design: Minimum effort, maximum impactdawncurless
 
Measures of Dispersion and Variability: Range, QD, AD and SD
Measures of Dispersion and Variability: Range, QD, AD and SDMeasures of Dispersion and Variability: Range, QD, AD and SD
Measures of Dispersion and Variability: Range, QD, AD and SDThiyagu K
 
Software Engineering Methodologies (overview)
Software Engineering Methodologies (overview)Software Engineering Methodologies (overview)
Software Engineering Methodologies (overview)eniolaolutunde
 
SOCIAL AND HISTORICAL CONTEXT - LFTVD.pptx
SOCIAL AND HISTORICAL CONTEXT - LFTVD.pptxSOCIAL AND HISTORICAL CONTEXT - LFTVD.pptx
SOCIAL AND HISTORICAL CONTEXT - LFTVD.pptxiammrhaywood
 
Advanced Views - Calendar View in Odoo 17
Advanced Views - Calendar View in Odoo 17Advanced Views - Calendar View in Odoo 17
Advanced Views - Calendar View in Odoo 17Celine George
 
Measures of Central Tendency: Mean, Median and Mode
Measures of Central Tendency: Mean, Median and ModeMeasures of Central Tendency: Mean, Median and Mode
Measures of Central Tendency: Mean, Median and ModeThiyagu K
 
The byproduct of sericulture in different industries.pptx
The byproduct of sericulture in different industries.pptxThe byproduct of sericulture in different industries.pptx
The byproduct of sericulture in different industries.pptxShobhayan Kirtania
 
Russian Call Girls in Andheri Airport Mumbai WhatsApp 9167673311 💞 Full Nigh...
Russian Call Girls in Andheri Airport Mumbai WhatsApp  9167673311 💞 Full Nigh...Russian Call Girls in Andheri Airport Mumbai WhatsApp  9167673311 💞 Full Nigh...
Russian Call Girls in Andheri Airport Mumbai WhatsApp 9167673311 💞 Full Nigh...Pooja Nehwal
 
BASLIQ CURRENT LOOKBOOK LOOKBOOK(1) (1).pdf
BASLIQ CURRENT LOOKBOOK  LOOKBOOK(1) (1).pdfBASLIQ CURRENT LOOKBOOK  LOOKBOOK(1) (1).pdf
BASLIQ CURRENT LOOKBOOK LOOKBOOK(1) (1).pdfSoniaTolstoy
 
APM Welcome, APM North West Network Conference, Synergies Across Sectors
APM Welcome, APM North West Network Conference, Synergies Across SectorsAPM Welcome, APM North West Network Conference, Synergies Across Sectors
APM Welcome, APM North West Network Conference, Synergies Across SectorsAssociation for Project Management
 
A Critique of the Proposed National Education Policy Reform
A Critique of the Proposed National Education Policy ReformA Critique of the Proposed National Education Policy Reform
A Critique of the Proposed National Education Policy ReformChameera Dedduwage
 
Student login on Anyboli platform.helpin
Student login on Anyboli platform.helpinStudent login on Anyboli platform.helpin
Student login on Anyboli platform.helpinRaunakKeshri1
 
Ecosystem Interactions Class Discussion Presentation in Blue Green Lined Styl...
Ecosystem Interactions Class Discussion Presentation in Blue Green Lined Styl...Ecosystem Interactions Class Discussion Presentation in Blue Green Lined Styl...
Ecosystem Interactions Class Discussion Presentation in Blue Green Lined Styl...fonyou31
 
microwave assisted reaction. General introduction
microwave assisted reaction. General introductionmicrowave assisted reaction. General introduction
microwave assisted reaction. General introductionMaksud Ahmed
 
mini mental status format.docx
mini    mental       status     format.docxmini    mental       status     format.docx
mini mental status format.docxPoojaSen20
 
Grant Readiness 101 TechSoup and Remy Consulting
Grant Readiness 101 TechSoup and Remy ConsultingGrant Readiness 101 TechSoup and Remy Consulting
Grant Readiness 101 TechSoup and Remy ConsultingTechSoup
 
Mastering the Unannounced Regulatory Inspection
Mastering the Unannounced Regulatory InspectionMastering the Unannounced Regulatory Inspection
Mastering the Unannounced Regulatory InspectionSafetyChain Software
 
social pharmacy d-pharm 1st year by Pragati K. Mahajan
social pharmacy d-pharm 1st year by Pragati K. Mahajansocial pharmacy d-pharm 1st year by Pragati K. Mahajan
social pharmacy d-pharm 1st year by Pragati K. Mahajanpragatimahajan3
 

Dernier (20)

Interactive Powerpoint_How to Master effective communication
Interactive Powerpoint_How to Master effective communicationInteractive Powerpoint_How to Master effective communication
Interactive Powerpoint_How to Master effective communication
 
Accessible design: Minimum effort, maximum impact
Accessible design: Minimum effort, maximum impactAccessible design: Minimum effort, maximum impact
Accessible design: Minimum effort, maximum impact
 
Measures of Dispersion and Variability: Range, QD, AD and SD
Measures of Dispersion and Variability: Range, QD, AD and SDMeasures of Dispersion and Variability: Range, QD, AD and SD
Measures of Dispersion and Variability: Range, QD, AD and SD
 
Advance Mobile Application Development class 07
Advance Mobile Application Development class 07Advance Mobile Application Development class 07
Advance Mobile Application Development class 07
 
Software Engineering Methodologies (overview)
Software Engineering Methodologies (overview)Software Engineering Methodologies (overview)
Software Engineering Methodologies (overview)
 
SOCIAL AND HISTORICAL CONTEXT - LFTVD.pptx
SOCIAL AND HISTORICAL CONTEXT - LFTVD.pptxSOCIAL AND HISTORICAL CONTEXT - LFTVD.pptx
SOCIAL AND HISTORICAL CONTEXT - LFTVD.pptx
 
Advanced Views - Calendar View in Odoo 17
Advanced Views - Calendar View in Odoo 17Advanced Views - Calendar View in Odoo 17
Advanced Views - Calendar View in Odoo 17
 
Measures of Central Tendency: Mean, Median and Mode
Measures of Central Tendency: Mean, Median and ModeMeasures of Central Tendency: Mean, Median and Mode
Measures of Central Tendency: Mean, Median and Mode
 
The byproduct of sericulture in different industries.pptx
The byproduct of sericulture in different industries.pptxThe byproduct of sericulture in different industries.pptx
The byproduct of sericulture in different industries.pptx
 
Russian Call Girls in Andheri Airport Mumbai WhatsApp 9167673311 💞 Full Nigh...
Russian Call Girls in Andheri Airport Mumbai WhatsApp  9167673311 💞 Full Nigh...Russian Call Girls in Andheri Airport Mumbai WhatsApp  9167673311 💞 Full Nigh...
Russian Call Girls in Andheri Airport Mumbai WhatsApp 9167673311 💞 Full Nigh...
 
BASLIQ CURRENT LOOKBOOK LOOKBOOK(1) (1).pdf
BASLIQ CURRENT LOOKBOOK  LOOKBOOK(1) (1).pdfBASLIQ CURRENT LOOKBOOK  LOOKBOOK(1) (1).pdf
BASLIQ CURRENT LOOKBOOK LOOKBOOK(1) (1).pdf
 
APM Welcome, APM North West Network Conference, Synergies Across Sectors
APM Welcome, APM North West Network Conference, Synergies Across SectorsAPM Welcome, APM North West Network Conference, Synergies Across Sectors
APM Welcome, APM North West Network Conference, Synergies Across Sectors
 
A Critique of the Proposed National Education Policy Reform
A Critique of the Proposed National Education Policy ReformA Critique of the Proposed National Education Policy Reform
A Critique of the Proposed National Education Policy Reform
 
Student login on Anyboli platform.helpin
Student login on Anyboli platform.helpinStudent login on Anyboli platform.helpin
Student login on Anyboli platform.helpin
 
Ecosystem Interactions Class Discussion Presentation in Blue Green Lined Styl...
Ecosystem Interactions Class Discussion Presentation in Blue Green Lined Styl...Ecosystem Interactions Class Discussion Presentation in Blue Green Lined Styl...
Ecosystem Interactions Class Discussion Presentation in Blue Green Lined Styl...
 
microwave assisted reaction. General introduction
microwave assisted reaction. General introductionmicrowave assisted reaction. General introduction
microwave assisted reaction. General introduction
 
mini mental status format.docx
mini    mental       status     format.docxmini    mental       status     format.docx
mini mental status format.docx
 
Grant Readiness 101 TechSoup and Remy Consulting
Grant Readiness 101 TechSoup and Remy ConsultingGrant Readiness 101 TechSoup and Remy Consulting
Grant Readiness 101 TechSoup and Remy Consulting
 
Mastering the Unannounced Regulatory Inspection
Mastering the Unannounced Regulatory InspectionMastering the Unannounced Regulatory Inspection
Mastering the Unannounced Regulatory Inspection
 
social pharmacy d-pharm 1st year by Pragati K. Mahajan
social pharmacy d-pharm 1st year by Pragati K. Mahajansocial pharmacy d-pharm 1st year by Pragati K. Mahajan
social pharmacy d-pharm 1st year by Pragati K. Mahajan
 

Journal of Applied Corporate Finance • Volume 22 Number 2 A Mo.docx

  • 1. Journal of Applied Corporate Finance • Volume 22 Number 2 A Morgan Stanley Publication • Spring 2010 1 It Ain’t Broke: The Past, Present, and Future of Venture Capital BT by Steven N. Kaplan, University of Chicago Booth School of Business and NBER, and Josh Lerner, Harvard Business School and NBER* he U.S. venture capital (VC) industry is currently subject to a great deal of uncertainty and contro- versy. Some observers and practitioners believe that the VC model is broken and that the U.S. VC industry needs to shrink.1 In this paper, we put the U.S. VC industry into its historical context, assess the current state of the VC market, and discuss the implications of that history and the current conditions for the future. We begin by describing the fundamental problem that entrepreneurs face and VCs need to solve in order to invest successfully. There is a great deal of evidence to support what is now a highly developed theory of how the U.S. VC model provides an efficient solution to this basic problem of entre- preneurial finance. And there is little doubt that the U.S. venture capital industry has been very successful. A large fraction of IPOs, including many that are now among the most successful public companies in the world, have been funded by VCs. And, where possible, the U.S. VC model has
  • 2. been copied around the world. Next we look at the historical patterns of commitments to U.S. VC funds and investments in companies by those funds. U.S. VC investments in companies have represented a remarkably constant 0.15% of the total value of the stock market over the past three decades—the period for which we have reliable data. Commitments to VC funds, while more variable, have been consistently in the 0.10% to 0.20% range. These percentages have not changed in recent years. Third, we consider the historical record on VC fund returns, paying particular attention to returns of post-2000 “vintages.” Contrary to the popular impression, we do not find that returns to VC funds this decade have been unusually low (or high) relative to the overall stock market. This is true despite the relatively low number of IPOs. Overall, VC investment and returns have been subject to boom-and-bust cycles over time. Based on our historical analyses, we make some observa- tions about the current situation and consider what is likely to happen going forward. The level of commitments to and the investment pace of VC funds since 2002 have been consistent with the long-term historic averages. At the same time, the returns relative to the overall stock market appear to have been roughly average. This does not suggest to us that there is too much money in U.S. VC, or that the VC model is broken. Instead it appears to reflect the natural evolution of a relatively competitive market. In fact, given the unusual and unexplained paucity of IPOs between 2004 and 2007, we argue there is more upside than downside for the VC vintages of 2001 to 2007. The costs for public companies associated with Sarbanes-Oxley are now smaller and more manageable than they were in 2005 and
  • 3. 2006. There are more boutique investment banks with incen- tives to market IPOs. And according to anecdotal reports, there has recently been growth in the pipeline of IPO candidates. We also note that commitments to U.S. VC partnerships were historically low in 2009, a trend that is likely to continue into 2010 and, possibly beyond. Based on the historical relationship between commitments and performance, the low level of commitments suggests that returns to the 2009 and 2010 vintage years are likely to be strong. Finally, we consider some of the longer-term drivers of venture capital financing. Corporate funding of innova- tion has increasingly moved from large, centralized research facilities to various “open innovation” models, including acquisitions and strategic alliances with smaller firms. This increased willingness to reach outside the organization, which reflects the difficulties of managing early-stage innovation within a large corporation, appears likely to create more opportunities for venture investors in the years to come. The Problem and Solution An important problem in a market economy, and the one that VCs attempt to solve, is to connect entrepreneurs with good ideas (but no money) with investors who have money but are looking for good ideas. The solution, as suggested by theoretical analysis and implemented by venture capitalists,
  • 4. involves (at least) three distinct activities.2 First, VCs spend a large amount of time and resources screening and selecting deals. VCs systematically evaluate the attractiveness and risks of the opportunity, considering factors that include market size, strategy, technology, customer adoption, competition, and the quality and experience of the * Chris Allen and Jacek Rycko provided excellent research support for this article. We thank Harvard Business School’s Division of Research and the Kauffman Foundation for financial support. All errors and omissions are our own. 1. For example, see Kedrosky (2009) and Austin (2009). Full citations for all articles appear at the end of the article. 2. See Kaplan and Strömberg (2001) for a more detailed discussion. 2 Journal of Applied Corporate Finance • Volume 22 Number 2 A Morgan Stanley Publication • Spring 2010
  • 5. Figure 1 Share of all Non-financial, Non-reverse LBO, Non- REIT, Non-SPAC IPOs that are Venture-backed from 1995–(July) 2009 0.0% 10.0% 20.0% 30.0% 40.0% 50.0% 60.0% 70.0% 80.0% 1995 1996 1997 1998 1999 2000 2001 2002 2003 2004 2005 2006 2007 2008 2009
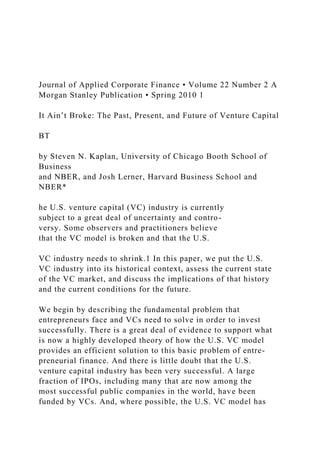
  • 6. Year measures or indicators of that importance and success. Let’s start by recognizing how uncommon VC funding is. While roughly 600,000 new businesses (that employ others) are started each year in the U.S., reports from Venture Source suggest that, in an average year, roughly 1,000 businesses will receive their first round of funding from a VC. That means that only 1/6 of 1% of new businesses manage to obtain VC funding.6 But while very few companies receive VC funding, a remarkably large fraction of the start-ups that make it to the public company stage are funded with venture capital. To estimate this fraction, we used Thomson Banker to identify all IPOs in the U.S. since 1995—and then attempted to eliminate IPOs that were not true industrial start-ups by excluding blank- check companies, corporate spin-outs or spin-offs, financial institutions, REITS, and reverse leveraged buyouts. Using this better measure of the true start-up population that goes public, we found that from 1999 through 2009 (as illustrated in Figure 1), over 60% of IPOs have had VC backing.
  • 7. This is an extraordinary percentage considering that only 1/6 of 1% of all companies are VC-backed. What’s more, in only two years of these eleven years have fewer than 50% of IPOs been VC-backed.7 One way of interpreting these results is that receiv- ing VC funding and going public are both very uncommon, but highly related events. While not a necessary condition for going public, VC funding very significantly increases the likelihood that a start-up will eventually go public. Venture capital has fueled many of the most successful start-ups of the last 30 years. Four of today’s 20 largest (in management team. The screening process is an intensive and disciplined one that often takes several months.3 Second, VCs engage in sophisticated contracting and structuring of their investments. VC contracts are efficiently designed to ensure the follow- ing: the entrepreneur does very well if he or she performs well; the VC takes control if the entrepreneur does not perform. VCs implement this design by carefully allocating cash flow rights (the equity upside that provides incentives to perform), control rights (the rights VCs have to intervene
  • 8. if the entrepreneur does not perform, liquidation rights (the senior payoff to VCs if the entrepreneur does not perform), and employment terms, particularly vesting (which gives the entrepreneur incentives both to perform and stay with the firm). The various aspects and provisions of the contracts typically reflect the VC’s earlier analysis (during the screening phase) of the attractiveness and risks of the investment.4 Third, VCs improve the outcomes of and add value to their portfolio companies by monitoring and aiding companies after they invest. Part of the added value comes from providing governance and monitoring. This often means replacing the entrepreneur when it becomes clear the entrepreneur is not up the task of growing the company. Part of the added value involves assisting the entrepreneur with strategy, hiring other executives, introductions to customers and other partners.5 Historical Impact It is generally believed that VC investing has been impor- tant to the U.S. economy. In this section, we provide several 3. For a detailed description and analysis of VC screening, see Kaplan and Strömberg (2004).
  • 9. 4. For a detailed description and analysis of VC contracts, see Kaplan and Strömberg (2003). 5. Hellmann and Puri (2002), Kaplan and Strömberg (2004), and Lerner (1995) all document different aspects of this VC value-added. Sorensen (2007) seeks to assess the relative importance of deal screening and subsequent value- added and concludes that the two are of roughly equal importance for top VCs. 6. Using detailed Census data, Puri and Zarutskie (2009) obtain similar percentages for the 1996 to 2000 period. 7. If anything, our numbers underestimate the percentage of start-ups that are VC- backed. Kaplan, Sensoy and Strömberg (2009) study 2004 IPOs in greater detail and find a somewhat higher percentage are VC-backed than the Thomson database indi- cates. In other words, it is highly unlikely that a company that does not take venture capital ends up going public.
  • 10. 3Journal of Applied Corporate Finance • Volume 22 Number 2 A Morgan Stanley Publication • Spring 2010 Figure 2 Commitments to U.S. Venture Capital Partnerships, 1980–2009 ($ billions) Source: Private Equity Analysis 0 10 20 30 40 50 60
  • 11. 70 80 1980 1982 1984 1986 1988 1990 1992 1994 1996 1998 2000 2002 2004 2006 2008 $ B ill io ns Figure 3 Commitments to U.S. VC Partnerships as Fraction of Stock Market Capitalization 1980–2009 Source: Private Equity Analyst, Steven N. Kaplan 0 .05
  • 12. .1 .15 .2 .25 .3 .35 .4 .45 1980 1982 1984 1986 1988 1990 1992 1994 1996 1998 2000 2002 2004 2006 2008 % S to
  • 13. ck M ar ke t analyze historical performance. Figure 2 presents annual limited partner commitments to venture capital funds from 1980 to 2009 (using data from Private Equity Analyst) in nominal (or actual) dollars. The figure documents the huge run-up in venture capital through the dot-com era and the subsequent decline. From 2005 to 2008, annual commitments to venture capital ran in the range of $25 to $33 billion. But these depictions do not take account of the fact that the size of the economy and the stock market has increased markedly since 1980. In Figure 3, we address this shortcom- ing by scaling annual commitments by the total value of the U.S. stock market at the beginning of each year. This scaling, then, presents VC commitments as a fraction of the total market value of equity. Measured this way, VC commit-
  • 14. ments are much more stable. VC commitments have never terms of market capitalization) U.S. companies—Micro- soft, Apple, Google, and Cisco—have been funded in part by venture capital in the last 30 years. And so were a large number of other highly valuable companies, including Gilead, eBay, Amazon, Yahoo, Amgen, Adobe, Celgene, Starbucks, Genzyme, Juniper, Symantec, Stryker, and Intuit. Thanks in part to such highly visible successes, U.S. venture capital practices have been exported to other parts of the world.8 Fundraising and Investment Those who believe that the U.S. venture model is broken argue that there is an excessive amount of capital in the venture industry and point out that the recent financial performance of the venture industry has been poor. In this section, we examine the amount of capital in the industry and consider whether it appears excessive. In the following section, we 8. There has been a proliferation of efforts by the public sector in many nations in recent years to encourage the formation of local venture clusters, albeit with mixed re- sults. See Kaplan, Martel and Strömberg (2007) and Lerner and Schoar (2006).
  • 15. 4 Journal of Applied Corporate Finance • Volume 22 Number 2 A Morgan Stanley Publication • Spring 2010 Figure 4 U.S. VC Deals and $ Invested (as % of Market) Figure 5 U.S. VC Vintage Year IRRs Source: Private Equity Analyst, Steven N. Kaplan Source: NVCA 0 1000 2000 3000 4000 5000
  • 16. 6000 7000 0 0.1 0.2 0.3 0.4 0.5 0.6 0.7 1980 1982 1984 1986 1988 1990 1992 1994 1996 1998 2000 2002 2004 2006 2008 D
  • 21. 19 99 20 00 20 01 20 02 20 03 20 04 20 05 relative to the overall stock market. And the recent pace of VC commitments and, particularly, investments is histori- cally average, not high.
  • 22. Performance What about the performance of VC funds? Figure 5 presents the average vintage year returns reported by Cambridge Asso- ciates (CA) and by Venture Economics (VE) as of December 2008. The two series track each other very closely, with CA being higher in the mid-90s vintages and lower in the most recent vintages. The figure illustrates the large variation in performance across different vintage years. Figure 6 presents VE vintage year returns by quartile of fund performance. The figure illustrates the large differ- ences in performance between funds in the top and bottom quartiles of the distribution. But these figures—and most publicly available data—do not provide enough information to answer three important gone below 0.05% of the total stock market; and with the exception of the three years of the dotcom boom (1999 to 2001), commitments have not gone above 0.23%. Since 2002, commitments have run just slightly above the histori- cal average (0.146% versus 0.138%). Figure 4 presents the analogous analysis for venture capital
  • 23. investments in portfolio companies (through 2008). The left axis shows VC investments as a fraction of total stock market value at the beginning of each year. The right axis shows the number of VC investments. Like Figure 3, Figure 4 shows that VC investment has been remarkably stable. On average, U.S. VCs have invested 0.164% of the value of the stock market each year in portfolio companies. Except in the three dotcom boom years, investment has not exceeded 0.203% of the stock market. Since 2002, investments have run slightly below the historical average (0.155% versus 0.164%). Both Figures 3 and 4, then, indicate that the U.S. VC market has been remarkably stable over the last 30 years 5Journal of Applied Corporate Finance • Volume 22 Number 2 A Morgan Stanley Publication • Spring 2010 Figure 6 Venture Returns by Vintage Year Median, Upper, and Lower Quartile 1984–2005 Source: Venture Economics -30.0
  • 27. 01 20 02 20 03 20 04 20 05 investors would have been $18 not $20 million, and the PME would have been only 0.87 (18/20.7). Kaplan and Schoar restrict their analysis largely to funds raised (or committed) before 1997. Their study finds that the average VC fund in their sample, net of fees and carry, had a PME of 0.96. This means that the average fund slightly underperformed the public stock market after the VCs’ share. Gross of fees, the average PME was estimated to be 1.25 or above, and thus well above 1.0.
  • 28. When Kaplan and Schoar weight their sample by the amount of capital in the funds, they find an average PME of 1.22 net of fees, indicating that the VC industry as a whole outperformed the public markets net of fees (as well as gross of fees). The reason for the difference between average and capital- weighted average has to do with timing. As Figure 7 indicates, PMEs were higher for 1990s vintage years than for 1980s vintage years. And because more money was committed to VC in the 1990s than the 1980s, the capital-weighted average gives more weight to the performance of the fund of the 1990s. We believe there are several takeaways here. First, VC returns net of fees have been competitive with the return from public markets. Second, VC outperforms public markets gross of fees, but GPs capture a lot of the outperformance (on average). Third, there is a great deal of variation over time in whether VC returns outperform or underperform the public markets. There are two caveats to these results, one positive and one negative. On the negative side, the results do not include the dot-com bust. On the positive side, Cambridge Associates has a larger sample and has reported higher returns, indicating
  • 29. that Kaplan and Schoar may understate VC performance. questions. First, how do VC returns really compare with public stock market returns? Second, do the same general partners (GPs) consistently outperform? And, third, how does fund-raising affect subsequent performance? In a much-cited study, Kaplan and Schoar (2005) attempted to answer each of these questions using detailed fund performance data from Venture Economics on U.S. VC funds from 1980 through the end of 2001. We now review the findings of that study.9 VC Performance vs. Public Markets Kaplan and Schoar (2005) evaluated VC performance rela- tive to the public stock market by calculating a public market equivalent (PME). The PME compares an investment in a VC fund to an investment in the S&P 500 by assuming that all cash payouts (net of fees) by a fund to LPs are reinvested at the total return to the S&P 500. The resulting fund value is then divided by the value of the cash inflows (or inves- tor contributions) including the fees the investors would have earned if the funds have been invested in the S&P 500. Using this measure, any fund with a PME greater than 1.0 outperformed the S&P 500 (net of all fees). The PME is a
  • 30. particularly relevant measure for LPs who view VC invest- ments as an alternative to investments in public equities. To illustrate, if a VC invested $10 million in March of 1997 and sold the investment in March of 2000 for $20 million, the investment would have had an IRR of 26% gross of fees and earned a multiple of two times. During that period, however, $10 million invested in the S&P 500 would have grown to $20.7 million. As a result, the PME of the investment would have been only 0.97 (20/20.7) gross of fees. Net of a carry of $2 million, the net cash outflow to 9. Later work by others – Gottschalg and Phallipou (2007) and Hochberg et al. (2009) – using somewhat later data for U.S. VC funds is largely consistent with the find- ings in Kaplan and Schoar (2005). 6 Journal of Applied Corporate Finance • Volume 22 Number 2 A Morgan Stanley Publication • Spring 2010 Figure 8 Excess Vintage Year Return versus Total Market and NASDAQ
  • 32. s R et u rn Vintage Year NASDAQ XRet Total XRet 19 81 19 80 19 82 19 83
  • 35. 00 20 01 20 02 20 03 20 04 20 05 Figure 7 U.S. VC PME by Vintage Year 0.50 1.00 1.50
  • 36. 2.00 2.50 1980 1981 1982 1983 1984 1985 1986 1987 1988 1989 1990 1991 1992 1993 1994 1995 P M E Vintage Year 0.00 vintage, we use the four-year IRRs because five-years are not available.) Because of timing differences, this provides an imperfect measure of the net-of-market performance of these vintages. We arbitrarily stop at 2005 because more recent vintages have likely not had enough time to establish even an inexact estimate of their performance. Figure 8 shows excess returns by vintage year from 2000
  • 37. to 2005. For the entire period, performance has been roughly equal to the total stock market. Two vintages have IRRs below the total market return; two have IRRs roughly the same; and two have IRRs above. When compared to NASDAQ, four of the six vintages exceed NASDAQ. These results suggest that VC funds have held their own relative to public stock markets over this decade. Figure 9 plots the PMEs from Kaplan and Schoar (2005) against the excess returns we calculated relative to the total market. This graph indicates that the excess returns calculated What about more recent vintages? There are two problems in estimating the performance of the more recent vintages. The first is a practical one: the cash flows to the individual funds are not readily available. Thus, we cannot undertake PME analyses, only a cruder assessment of overall perfor- mance. Second, because the investments remain largely in the portfolios of the venture groups, we do not know how much the more recent funds are really worth. Given the difficulty of valuing venture firms and the varying practices regard- ing marking-to-market portfolios, we cannot be sure of the underlying values. As a result, the analysis that follows is somewhat speculative.
  • 38. With these qualifications, we now compare the perfor- mance of recent vintages to that of the stock market. We compare the average vintage year IR R (using Venture Economics returns) to the five-year IRR of the total stock market and to the five-year IRR of NASDAQ. (For the 2005 7Journal of Applied Corporate Finance • Volume 22 Number 2 A Morgan Stanley Publication • Spring 2010 Figure 9 Vintage Year Return less NASDAQ Return versus PME 0.00 0.50 1.00 1.50 2.00 2.50
  • 43. 19 99 20 00 20 01 20 02 20 03 20 04 20 05 preference of LPs to invest in top quartile funds or GPs. Some LPs have taken this preference a step farther and believe that it does not make sense to invest in venture capital at all unless they can invest in top quartile, or even top decile, funds.
  • 44. Consistent with wide differences in performance, Kaplan and Schoar find large differences between the bottom and top quartiles. Funds in the top quartile have PMEs of 1.11 and above while those in the bottom quartile have PMEs of 0.67 and below. They also find strong evidence of persistence. Subsequent fund performance is significantly related to previ- ous fund performance for the same GPs. They also find a strongly significant relationship between the performance of funds that are two apart (e.g., funds III and V) and even three apart. This is important because those funds are less likely to have investments in common.10 What’s more, this persistence of returns among venture capitalists is notably different from findings for other asset classes. Similar studies of mutual funds find no evidence of persistence among top performers. Studies of hedge funds have mixed results, but generally find limited evidence of persistence. There are three other important comments to make about persistence: First, persistence is not concentrated in the top decile. When Kaplan and Schoar divided funds into performance
  • 45. terciles (thirds), they found that funds in the top tercile typically had PME’s above 1, indicating outperformance of the public stock market net of fees. As with the overall persis- tence result, funds in the top tercile were significantly more likely to repeat in the top tercile than funds in the middle or bottom tercile. this way correlated with PMEs. In particular, when excess returns are positive, PMEs tend to be greater than 1. We confirmed this by estimating a regression of the PMEs against the excess return measure. We obtained the following result: PME = 1.1 + 0.05 x Excess Return % [0.01] where 0.01 is the standard error of the estimated relationship. This regression indicates a highly significant relationship. Given that recent vintages have returns comparable to those of the overall stock market, this regression suggests that the recent vintages will perform about as well as public markets when all is said and done. As we noted earlier, this analysis assumes that the 2000 to 2005 vintages are correctly marked-to-market. To the extent
  • 46. that bad investments have not yet been written down, the funds are overvalued and the ultimate results will be worse than the public markets. To the extent that good investments have not yet been written up, the funds are undervalued and the ultimate results will be better than the public markets. We suspect that, on average, those vintages are underval- ued because most bad investments have been written down as they have failed or needed additional financing (at lower valua- tions). At the same time, many companies that are performing well, particularly in IT, have not been written up. Persistence The second question that Kaplan and Schoar address is the consistency, or “persistence,” of performance. It is widely believed that the best GPs in venture capital consistently outperform other GPs. This observation explains the strong 10. More recent papers that have revisited this question with updated data sets have found similar results. 8 Journal of Applied Corporate Finance • Volume 22 Number 2
  • 47. A Morgan Stanley Publication • Spring 2010 Figure 10 Looking at Venture Funds and Returns Source: Lerner, Leamon and Hardymon, 2011. 0% 5% 10% 15% 20% 25% 10 20 50 100 200 500 1,000 2,000 5,000 P re d ic
  • 48. te d R el at iv e IR R Venture Capital–Fund Size ($ millions) fund-raising related to performance, but so is overall indus- try fundraising. When performance is strong, LPs commit more capital to venture capital. In turn, fundraising has an effect on future venture capital performance, but not in a good way. When more capital is committed to or invested in venture capital, vintage year returns suffer. As a result, venture capital has a self-correct-
  • 49. ing mechanism: a period of poor returns leads to decreased inflows, which in turn leads to a recovery in returns. Thus, there has historically been a strong element of “mean rever- sion” in venture returns. To explore these relationships, we again used regression analysis. This time, we attempted to predict vintage year returns using the amount of capital committed to venture capital. To better capture the amount of capital available, we used capital committed in the same vintage year and the previous vintage year. To make different time periods compa- rable, we measured capital committed as a fraction of the total beginning of year stock market value. When running regressions that use average vintage year returns reported by Venture Economics and Cambridge Associ- ates, we came up with the following two relationships: Venture Economics: IRR = 18% – 28.1 x Capital Committed last two years as % of market. [12.1]
  • 50. Cambridge Associates: IRR = 24% – 41.1 x Capital Committed last two years as % of market. [15.7] Both of these results are strongly statistically significant. Figure 11 shows these relationships graphically. Second, although there is strong statistical evidence of persistence in venture capital, it is by no means guaranteed. If subsequent performance were random, roughly 33% of top tercile funds should repeat in the top tercile. If subsequent performance were completely persistent, 100% of top tercile funds would repeat in the top tercile. Kaplan and Schoar find the true level of persistence is 50%. Third and last, fund size is the enemy of persistence. GPs with funds that have produced high returns tend to get larger (while GPs of funds with poor returns either get smaller or are unable to raise additional funds). Kaplan and Schoar find that, for funds raised by the same GP, a 50% increase in fund size is associated with roughly a 0.07 decline in PME, which translates into a 1.5% to 2% decline in a fund’s IRR.
  • 51. Moreover, for all GPs, there appears to be a tradeoff between size and returns. In their recent study of the relation of fund size to IRRs, Lerner et al. (2011), as shown in Figure 10, find that better GPs get larger, which is accompanied by increases returns for a while. But at a fund size of roughly $200 million, the negative effect of size kicks in and perfor- mance stops increasing with size. At fund sizes greater than $500 million, performance clearly begins to decline. Overall, then, we think the persistence results have two implications. First, the top-decile funds are not the only consistent outperformers. Persistence is evident in the returns of even the top third of VCs. Second, even though persistence exists, outperformance is not guaranteed. Top quartile and top decile GPs do have bad funds, particularly after they have raised a lot of capital. Fundraising and Future Performance The last question of interest is the relation of fundraising and performance. It turns out that not only is individual GP 9Journal of Applied Corporate Finance • Volume 22 Number 2
  • 52. A Morgan Stanley Publication • Spring 2010 Figure 11 VC Vintage Year Returns vs. Fundraising -10 0 10 20 30 40 50 60 70 80 0 0.1 0.2 0.3 0.4 0.5 0.6 0.7 0.8 0.9
  • 53. V in ta ge Y ea r IR R Commitments Last Two Years As % of Stock Market Figure 12 VC-Backed IPOs by Year 1985–2008 0 50 100
  • 55. 19 95 19 97 19 99 20 01 20 03 20 05 20 07 Source: Jay Ritter industry, with many investors thinking of terminating their commitments to this asset class, this is actually good news
  • 56. for venture investors who continue to invest. To the extent that the past is a guide to the future, the reduced inflows are likely to translate into higher venture returns. Looking Forward The previous sections describe the past and present of venture capital. The more pressing question is what will happen going forward. In particular, is the traditional venture capital model broken? One of the reasons that some believe the VC model is broken is concern about the increased difficulty of taking companies public. Figure 12, which shows the number of venture backed IPOs in the U.S. from 1985 to 2008, suggests there may be good reason for such concern. In Moreover, when we repeated the analysis using capital invested in venture capital companies instead of capital committed, we obtained similar results: Venture Economics: IRR = 18% – 24.4 x Capital Invested last two years as % of market.
  • 57. [9.5] Cambridge Associates: | IRR = 26% – 36.4 x Capital Invested last two years as % of market. [12.7] In sum, there is a strong negative correlation between VC returns and the preceding years’ capital commitments and investments. And if, as appears to be the case, we are now in a period of general disillusionment with the venture capital 10 Journal of Applied Corporate Finance • Volume 22 Number 2 A Morgan Stanley Publication • Spring 2010 Figure 13 IPO and M&A Exit Values to Market Cap 0.00% 0.20%
  • 58. 0.40% 0.60% 0.80% 1.00% 1.20% 1.40% 1985 1987 1989 1991 1993 1995 1997 1999 2001 2003 2005 2007 M&A Values IPO Values We are skeptical of claims that the VC model is broken or needs to be radically changed. As our historical analyses indicated, the level of commitments to and the investment pace of the U.S. VC industry since 2002 have both been consistent with the historic averages. At the same time, the returns to VC funds appear to have been roughly equal to
  • 59. those of the overall stock market. This does not suggest to us that there is too much money in U.S. VC, nor does it indicate to us that the VC model is broken. Instead it appears to represent the more or less natural evolution of a relatively competitive market. In fact, given the unusual and unexplained paucity of IPOs (and overall exits) between 2004 and 2007, we suspect there is more upside than downside for the VC vintages of 2001 to 2007. According to informal sources, Sarbanes-Oxley is likely less costly and more manageable than it was in 2005 and 2006. There are more boutique investment banks with incentives to market IPOs. And, as we mentioned earlier, recent reports suggest that there is now a larger pipeline of IPO candidates. What Will Happen in the Next Several Years? As we write this, commitments to U.S. VC partnerships appear to be historically low in 2009. In 2009, the Private Equity Analyst reported commitments of about $13 billion to U.S. VC funds. Compared to the value of the stock market at the beginning of 2009, commitments are only 0.111% versus the historical average of 0.138%. Measured relative to the stock market at the end of the year, the 2009 commitments are even lower, at 0.086% , as compared to the historical
  • 60. average of 0.125%. All indications are that commitments are likely to continue to be low into 2010 and, possibly beyond. all but one year during the 1990s, there were over 100 VC-backed IPOs. In five of the ten years, there were more than 150. Then, in the recession/bear market of 2001 to 2003, the number of VC-backed IPOs dropped below 50 each year. But this was not unusual for a down market; a similar pattern had occurred in the recession/bear market from 1989 to 1991. What was unusual and unexpected was the small number of VC-backed IPOs from 2004 to 2007, averag- ing only slightly more than 50 per year, despite the robust stock market over that period and despite the large number of companies that had received VC funding over the previ- ous five to ten years. It is not yet clear why there were so few IPOs. Some blame the increased costs imposed on compa- nies by the Sarbanes-Oxley legislation. Some blame increased litigation risk and the concomitant increase in directors’ and officers’ and other insurance. Some blame inattention from investment banks that were able to make more money from other activities. And some blame the scarcity on the fact that too many similar companies were funded during the dotcom boom, competing so fiercely that consumers received most
  • 61. of the benefits.11 But it’s important to keep in mind that an IPO is not the only way for a VC to exit an investment. VCs also exit by selling their portfolio companies. Nevertheless, as shown in Figure 13, the increase in M&A exits did not offset the decline in IPOs. Is the VC Model Broken? What does all this mean for the U.S. venture capital model? Is it broken? Does it need to be appreciably smaller? Does it need to be appreciably different? 11. See Weild and Kim (2009) for a discussion of some of these and other potential explanations. 11Journal of Applied Corporate Finance • Volume 22 Number 2 A Morgan Stanley Publication • Spring 2010 globally, is many times the magnitude of venture capital invest- ment, the size of the opportunity is likely to be substantial.
  • 62. Conclusion The U.S. VC model has been enormously successful over the last 30 years. During that time, the U.S. VC industry has consistently received commitments and invested at a pace of roughly 0.15% of the value of the overall U.S. stock market. Of course, there has been some variation in commitments and investments around that mean—a variation that can be traced in large part to the recent returns of the industry. As a general rule, higher returns have typically attracted more capital from LPs. But the greater capital has put downward pressure on returns, which in turn has resulted in smaller capital commitments. And as less capital has predictably led to increased returns, we have seen another increase in capital commitments and investment—and hence the beginnings of a new cycle. We see little that makes us believe that the VC model has changed or is broken. As far as we can tell, we are now leaving a period with slightly above average capital and average to slightly below average returns for a period of well below average capital. We would not be surprised to see this followed, perhaps quickly, by a period of above-average returns. steven kaplan is the Neubauer Family Professor of
  • 63. Entrepreneurship and Finance, as well as Faculty Director of the Polsky Entrepreneurship Center, at the University of Chicago’s Booth School of Business. Along with his many published papers on private equity and entrepreneurial finance, and on corporate governance and M&A, Steve has been recog- nized as one of the top-rated business school teachers in the country. He serves on the boards of three companies: Accretive Health, Columbia Acorn Funds, and Morningstar. josh lerner is the Jacob H. Schiff Professor of Investment Banking at Harvard Business School, and organizes two groups at the National
  • 64. Bureau of Economic Research: Entrepreneurship and Innovation Policy and the Economy. He has written extensively about venture capital and private equity. His most recent book is Boulevard of Broken Dreams: Why Public Efforts to Boost Entrepreneurship and Venture Capital Have Failed—and What to Do About It. He has led an international team of scholars in a multi-year study of the economic impact of private equity for the World Economic Forum. He is the winner of the 2010 Global Entre- preneurship Research Award. Based on the historical relationship between commitments
  • 65. and performance, the low level of commitments suggests that returns to the 2009 and 2010 vintage years are likely to be relatively strong. And there are other grounds for optimism about VC. The most compelling is the transformation of the U.S. corpo- rate research and development system. The central corporate R&D laboratory was a dominant feature of the innovation landscape in the U.S. for most of the 20th century. While the concept of the centralized laboratory originated in the German chemical industry, U.S. corporations had adopted it with enthusiasm by the 1950s. These campus-like facilities employed many thousands of researchers, many of whom were free to pursue fundamental science with little direct commercial applicability. Among the best-known were Bell Laboratories (with 11 Nobel Laureates) and IBM Central Research (with 5). Beginning in the early 1990s, however, American corpo- rations began fundamentally rethinking the role of these centralized research facilities.12 Reflecting both a perception of disappointing commercial returns and intensified competi- tive pressures, U.S. companies undertook a variety of changes to these facilities. Notable among them were paring the size of central research facilities in favor of divisional laboratories
  • 66. and relying much more heavily on what has been termed “open innovation”—that is, alliances with and acquisitions of smaller firms. To economists, however, these changes are not surprising. Observers such as Michael Jensen have contrasted the incen- tives within corporate research facilities unfavorably with those offered by venture capitalists. Jensen suggests that had higher-powered incentives been offered, some of the poor performance of research-intensive firms would have been avoided.13 And consistent with this argument, Kortum and Lerner (2000) find that venture-backed firms are approxi- mately three times as efficient in generating innovations as corporate research. This transformation suggests that the demand for venture-backed firms is likely to increase in the medium and longer term. The model of growing companies for full or partial acquisition by larger firms—which has been standard practice for many years in the computer network- ing business, for instance—is likely to be a growing segment of the venture activity in the years to come. And given the fact that corporate research spending, both in the U.S. and 12. See, for example, the discussions in Rosenbloom and
  • 67. Spencer (1996) and Ches- brough (2003)). 13. Jensen (1993). 12 Journal of Applied Corporate Finance • Volume 22 Number 2 A Morgan Stanley Publication • Spring 2010 Kaplan, S. and P. Strömberg, 2004, Characteristics, Contracts, and Actions: Evidence From Venture Capitalist Analyses, Journal of Finance 59, 2177-2210. Kedrosky, Paul, 2009, “Right-Sizing The U.S. Venture Capital Industry,” Working paper, Kauffman Foundation. Kortum, S., and J. Lerner, 2000, “Assessing the contri- bution of Venture Capital to Innovation,” Rand Journal of Economics 31, 674-92. Lerner, J., 1995, “Venture Capitalists and the Oversight of Private Firms,” Journal of Finance 50, 301-318. Lerner, J., 2009, The Boulevard of Broken Dreams: Why
  • 68. Public Efforts to Boost Entrepreneurship and Venture Capital Have Failed—and What to Do About It. Princeton: Princeton University Press. Lerner, J., A. Leamon, and F. Hardymon, 2011, Private Equity, Venture Capital, and the Financing of Entrepreneurship: The Power of Active Investing, New York: Wiley. Lerner J., and A. Schoar, 2005, “Does Legal Enforcement Affect Financial Transactions?: The Contractual Channel in Private Equity,” Quarterly Journal of Economics, 120, 223-246. Puri, M. and R. Zarutskie, 2009, “On the lifecycle dynam- ics of venture-capital- and non-venture-capital-financed firms,” Working paper, Duke University. Sorensen, M., 2007, How Smart is Smart money? An Empirical Two-sided Matching Model of Venture Capital, Journal of Finance 62, 2725-2762. U.S. Small Business Administration, 2009, The Small Business Economy, Washington: U.S. Government Printing Office.
  • 69. Weild, David and Edward Kim, 2009, “Market structure is causing the IPO crisis,” Working paper, Grant Thornton. References Austin, S., 2009, “Majority of VCs in Survey Call Industry ‘Broken,’” Wall Street Journal Blog, June 29. Chesbrough, H., 2003, Open Innovation: The New Imperative for Creating and Profiting from Technology, Boston: Harvard Business School Press. Gottschalg, O., and L. Phalippou, 2009, “The Perfor- mance of Private Equity Funds,” Review of Financial Studies 22, 1747-1776. Hellmann, T. and Puri, M., 2002, “Venture Capital and the Professionalization of Start-Up Firms: Empirical Evidence” Journal of Finance 57, 169-197. Hochberg, Y., A. Ljungqvist,and A. Vissing-Jørgensen, 2009, Informational Hold-up and Performance Persistence in Venture Capital,” Working paper, Northwestern University. Jensen, M., 1993, “The Modern Industrial Revolution, Exit, and the Failure of Internal Control Systems,” Journal
  • 70. of Finance 48, 831-880. Kaplan, S., F. Martel, and P. Strömberg, 2007, “How Do Legal Differences and Learning Affect Financial Contracts?” Journal of Financial Intermediation 16, 273-311. Kaplan, S., and A. Schoar, 2005, “Private Equity Perfor- mance: Returns, Persistence and Capital Flows,” Journal of Finance 60, 1791-1823. Kaplan, S., B. Sensoy and P. Strömberg, 2009, Should investors bet on the jockey or the horse? Evidence from the evolution of firms from early business plans to public compa- nies, Journal of Finance 64, 75-115. Kaplan, S. and P. Strömberg, 2001, “Venture Capital- ists As Principals: Contracting, Screening, and Monitoring,” American Economic Review 91, 426-430. Kaplan, S. and P. Strömberg, 2003, Financial Contracting Theory Meets the Real World: Evidence from Venture Capital Contracts, Review of Economic Studies 70, 281-315.
  • 71. One Million Students Homeless With collaboration and smart strategies, some districts are cracking the code and finding ways to help their homeless students. By Caralee Adams PRINT EMAIL The Teacher Store Star Students! Printer Paper Colorful printer paper that can be used as awards, invitations, notes to parents, classroom newsletters, and more. Two writing templates are
  • 72. included—one for the primary grades and one for the upper grades. Measures 8 1/2" x 11". Includes 50 sheets + writing templates. $3.38 You save: 25% Design Paper | Grades PreK-5 The Scholastic Store Autism Spectrum Disorders in the Mainstream Classroom : How to Reach and Teach Students with ASDS by Boroson, Barbara This engaging and informative book gives you the knowledge
  • 73. you need to understand students with autism spectrum disorders (ASDs) and the strategies you can use to help them succeed in school. An educator with more than 20 years experience working with students with ASDs, Barbara Boroson guides you through creating a responsive classroom attuned to the needs of your students with ASDs, and she shares http://www.scholastic.com/content/ http://www.scholastic.com/content/ https://store.scholastic.com/webapp/wcs/stores/servlet/ProductD isplay?productId=50532&langId=- 1&storeId=10052&catalogId=10051 javascript:addToCartTS('96630') https://store.scholastic.com/webapp/wcs/stores/servlet/ProductD isplay?productId=50532&langId=- 1&storeId=10052&catalogId=10051&sa_campaign=internal_ads /scholastic3_0/search http://shop.scholastic.com/webapp/wcs/stores/servlet/ProductDi
  • 74. splayView?productId=96630&langId=- 1&storeId=10751&catalogId=10004&sa_campaign=internal_ads /scholastic3_0/search preventative strategies that help head off challenging behavior before it becomes disruptive. She offers suggestions for breaking through to hard-to-reach kids, ideas for collaborating with families, and strategies for differentiating instruction to support every student. The end goal is a classroom in which all students feel valued and respected, in which all students can learn and grow. For use with Grades K-6. Biography: Barbara Boroson holds an
  • 75. undergraduate degree from Cornell and a masters degree in social work from Columbia University. She has worked in the field of autism spectrum education for almost twenty years in clinical, administrative, and advisory capacities. She is a guest lecturer at colleges of education and, as a consultant, helps districts integrate students on the spectrum into mainstream settings. Her writing has appeared in publications across the country. Barbara lives just outside of New York City with her husband and their two children. $19.99 You save: 20% books;teaching resources;paperbacks | Ages 5-12
  • 76. Ways to Support Homeless Students - Change bus routes so homeless students living in shelters or motels are picked up first and delivered last to respect their privacy. - Consult service providers in shelters to learn what needs homeless students may have, from transportation to supplies to health care. - Create a report card to hand to the next teacher that charts students' progress. A running record of students' strengths and needs will help them to maintain continuity if they switch schools. Also, give students a weekly self-evaluation form to reflect on what they are proud of accomplishing. - Adjust homework by eliminating assignments requiring a computer, a TV, or a phone, or offer supplies or school time to complete those tasks. - Assign a buddy to each homeless student. They often enter school midyear, and a friend can familiarize them with rules and procedures.
  • 77. - Never punish homeless students by taking away a possession, friend time, or recess. javascript:addToCartSSO('50532') Source: BethAnn Berliner, Imagine the Possibilities Sourcebook, wested.org The school secretary couldn't believe the student was homeless. He had new Nike sneakers, carried a cell phone, and looked like any other high school student. That's because Beth McCullough was doing her job. McCullough is the homeless education coordinator for Adrian Public Schools in southeastern Michigan. Through a local service organization, she was able to get a pair of
  • 78. size-13 shoes for the boy. She gave him a prepaid phone for safety, since he was sleeping in an abandoned building. And every morning, McCullough made sure the locker room was open early and stocked with a clean towel and shampoo so he could shower. "If you have a good homeless program, you shouldn't be able to tell who is homeless by the way they look," says McCullough. She takes the secretary's skepticism as "a compliment." McCullough is one of 16,000 liaisons across the nation who support a growing number of homeless students. In 2009-10, there were nearly a million homeless students in U.S. public schools. That's a 38 percent increase from 2006-07 and is likely an undercount, reports
  • 79. Barbara Duffield, policy director for the National Association for the Education of Homeless Children and Youth (NAEHCY) in Washington, D.C. "With the recession, job loss, unemployment, and the fore- closure crisis, it's unprecedented to see homelessness on this scale," says Duffield. "Rather than being a blip, it's now lasting." As more families, including some who were once middle class, enter the ranks of the homeless, the demand for services and the need for sensitivity training are rising just as schools' budgets are being cut. Some districts are coping by partnering with community-
  • 80. based organizations and getting creative with services. Others are taking advantage of government subgrants. Advocates maintain there are ways to accommodate this vulnerable population. But first educators must learn how to best approach, and deal with, the challenges involved. Meeting the Law's Requirements in 1987, the federal government enacted the Mckinney-Vento Act, which requires that every http://www.wested.org/ school district provide homeless students with equal access to public education. Districts need to count homeless students and have a homeless liaison to serve their needs.
  • 81. Homeless students, as defined by the law, include those who are staying in a hotel/motel or shelter, are unsheltered, or are "doubled up" with friends or family. Being doubled up is the most common, accounting for 71 percent of homeless students in the 2009-10 school year. The law sets up competitive subgrants to help fund support services. Many districts use grants to transport students back to their schools of origin so they can have some stability in their educational life. Others use subgrants for after-school programs, tutoring, and school supplies. But districts must know how to craft an effective application.
  • 82. The program is "woefully underfunded," says Duffield, with $65 million a year in federal grants going to about 3,000 of the country's 15,000 school districts. All schools need to provide homeless services, but most do so without extra grants. "The McKinney-Vento Act is supposed to count kids and do everything to help them succeed, but schools are strapped for resources," says Ellen Bassuk, founder of the National Center on Family Homelessness (NCFH) in Needham, Massachusetts. "It's not about intention; it's about resources. Some schools have better resources than others." Since 1988, Bassuk's organization has been working on the problem of family
  • 83. homelessness. Lack of affordable housing and poverty are drivers, along with the increase in families headed by single moms, which now make up one in five families nationwide. "If the mom is stressed, the kids will be stressed," says Bassuk. "Going to school tired, stressed, and worried, and then having to pay attention-it's very hard." Pairing Sensitivity With Assistance because their living situations are so unstable, children who are homeless find it difficult to maintain academic continuity, says Diana Bowman, program director for the National Center for Homeless Education at the SERVE Center in Browns Summit, North Carolina. "Every time a child moves from one school to another, there are
  • 84. issues of being in a place where nobody knows them, with a new peer group. Moving from one new curriculum to another-that's a huge challenge," she says. To help children adapt, and to identify those who are homeless in a discreet manner, a district or school must have a coordinated and solid plan. At the top, administrators need to understand their responsibilities under McKinney-Vento and support the work of homeless liaisons, says McCullough. A superintendent once told her the district was doing for a homeless kid what it would do for any kid. "It isn't enough to do what we would do for any
  • 85. student," responded McCullough. They need extra support, just as special education students do. In the classroom, teachers should look for children who appear sleepy or are wearing the same clothes, or who are carrying lots of belongings, hoarding food, or talking about moving often, says Bowman. Many children are embarrassed about their situation, and interventions should be done confidentially. Consider avoiding the term "homeless" altogether, says Lisa Mentesana, support specialist with the Beaverton, Oregon, school district, which has the highest homeless student population in the state. In 2010, she worked
  • 86. with 1,580 students; in the fall of 2011, she had already served 1,033 students. "In our first communication, we never say ‘homeless,'" she says. "We say, ‘We are from a social support office and understand you might be having a difficult time. We wanted to let you know about some support services available.'" Families who are doubling up often don't consider themselves to be homeless, although they are eligible for support under the law. Mentesana has seen families trying to "sneak" their children into school after they've moved out of the area, and they are relieved when they learn their kids can stay in their home school.
  • 87. Small Changes Can Make a Big Difference Dona Bolt, homeless education coordinator for the Oregon Department of Education, has seen homelessness rise over the past 25 years. Since families are mobile and districts often share students, school administrators must collaborate, she says. They can coordinate transportation and outreach efforts and partner to share community resources and strategies. Sometimes school policies need to be revisited to serve homeless students, says Bassuk of the NCFH. Kids who are homeless may act out and need a second chance, prompting administrators to rethink zero-tolerance policies. "These are not
  • 88. bad kids," says Bassuk. "They are traumatized kids." Experts suggest training administrators, teachers, counselors, and even bus drivers on the law and how to work with this population to meet their needs. Teachers can help by being flexible with assignments and procedures, says BethAnn Berliner, a senior research associate at WestEd, a research, development, and service agency in Oakland, California. A homeless student may not want to hang up a coat, for instance, since it may be his or her only one. Letting the child wear it in class can help to
  • 89. make him or her feel more secure. "From constantly moving and not having personal space, these students may have difficulty completing tasks," she adds. "Divide big assignments into bite- size pieces." And remember that these kids often live in crowded conditions, without a quiet place to study or computer access. Providing a clipboard to do homework and allowing a paper to be handwritten are simple and reasonable accommodations. If parents can't make a conference, don't presume that they don't care, adds McCullough. They might lack transportation or the ability to get away from work. What the Community Can Do
  • 90. in Pittsburgh, the homeless children's education fund supports 17 after-school learning centers that serve students in housing facilities for the homeless. The centers are equipped with computers and books, and qualified tutors help students with homework on weekday afternoons. Some of the centers have reading specialists from the local schools who know the curriculum and have a direct line back to the teachers, says Bill Wolfe, the group's executive director. These connections and support through community-based programs help to provide children with access to the best possible education.
  • 91. In the Adrian Public Schools, McCullough has seen funding for her program decrease from $62,000 last year to $39,000 this year. She uses more volunteers and recently worked with a local business on a "Pajama Rama" fund-raiser that brought in $8,000 to help bridge the gap. "I'm lucky to have a very giving community," she says. Shifting the Mind-Set Over the past decade, Berliner says, the landscape has improved-but more needs to be done. "It's really easy to blame children for their behaviors that frustrate us-when they don't bring in their homework or they are destructive in the classroom," she says. "Those are things that we as adults need to deal with rather than blaming
  • 92. the kids. How can you blame a kid for not doing homework when they have no place to do homework?" Educators should not see homeless students as threatening. Instead, they must dig deep to understand their needs, advises Bassuk. "Talk to the kids and find out what's bothering them. Then, in that context, find a way to contain the child. Kids will really perk up if they are responded to appropriately." With the right help, she says, kids can be resilient. And keep in mind that children who are homeless don't always ask for help, partly because they don't want to be categorized, especially at the high school
  • 93. level, says Denise Ross, supervisor for homeless education programs in Maryland's Prince George's County Public Schools. Of the district's 124,000 students, homeless services helped 2,700 of them last year. "School is a safe haven for them. They want to be in school," says Ross. "They want to be successful. Sometimes there are other things going on and they need an advocate in the school. They want to learn, and they want to be accepted."