Contenu connexe
Similaire à April Chester county Sold Median Price
Similaire à April Chester county Sold Median Price (17)
Plus de Prudential Fox & Roach, Realtors
Plus de Prudential Fox & Roach, Realtors (20)
April Chester county Sold Median Price
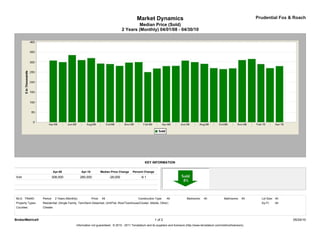
- 1. Market Dynamics Prudential Fox & Roach
Median Price (Sold)
2 Years (Monthly) 04/01/08 - 04/30/10
KEY INFORMATION
Apr-08 Apr-10 Median Price Change Percent Change
Sold 308,000 280,000 -28,000 -9.1
MLS: TReND Period: 2 Years (Monthly) Price: All Construction Type: All Bedrooms: All Bathrooms: All Lot Size: All
Property Types: Residential: (Single Family, Twin/Semi-Detached, Unit/Flat, Row/Townhouse/Cluster, Mobile, Other) Sq Ft: All
Counties: Chester
BrokerMetrics® 1 of 2 05/24/10
Information not guaranteed. © 2010 - 2011 Terradatum and its suppliers and licensors (http://www.terradatum.com/metrics/licensors).
- 2. Market Dynamics Prudential Fox & Roach
Median Price (Sold)
2 Years (Monthly) 04/01/08 - 04/30/10
FOR SALE UNDER CONTRACT SOLD EXPIRED NEW LISTINGS
Time Period Median $ # Properties Median $ # Properties Median $ # Properties Median $ # Properties Median $ # Properties
Apr-10 349,900 5,046 289,900 724 280,000 411 329,950 420 345,000 1,248
Mar-10 345,000 4,653 289,400 502 269,900 363 359,990 353 329,000 1,081
Feb-10 347,870 4,194 309,900 363 289,950 196 359,900 259 325,000 694
Jan-10 346,950 4,168 289,900 337 315,725 248 349,900 331 315,000 786
Dec-09 349,990 4,092 314,950 224 310,000 341 366,750 486 289,900 399
Nov-09 354,470 4,381 319,000 311 268,875 556 387,500 377 319,900 556
Oct-09 350,000 4,718 285,000 477 265,000 477 384,750 416 300,000 748
Sep-09 350,000 4,892 272,250 480 269,950 430 349,900 442 313,990 803
Aug-09 349,900 4,951 285,450 448 291,250 508 359,950 414 299,900 805
Jul-09 357,200 5,016 287,500 469 300,000 510 379,900 401 309,994 836
Jun-09 359,000 5,154 304,000 529 307,500 530 365,000 445 319,900 913
May-09 362,900 5,125 325,000 508 281,250 366 399,450 376 349,900 976
Apr-09 359,000 4,933 289,900 420 280,000 317 350,000 364 329,000 1,017
Mar-09 357,650 4,670 299,900 413 268,000 297 339,900 341 335,000 939
Feb-09 352,945 4,374 262,272 318 250,000 238 377,192 325 329,450 752
Jan-09 359,900 4,354 299,900 290 300,000 225 388,450 442 344,495 708
Dec-08 359,900 4,331 299,000 239 297,500 282 372,490 446 334,950 406
Nov-08 359,900 4,604 298,750 245 281,120 300 386,397 434 317,558 518
Oct-08 360,000 4,801 275,000 283 290,000 337 382,804 432 335,000 720
Sep-08 364,900 4,936 300,000 354 292,575 418 371,990 501 349,900 905
Aug-08 363,700 4,872 309,950 364 320,000 522 369,900 477 325,000 702
Jul-08 365,000 5,185 314,700 484 310,000 551 389,000 531 345,000 886
Jun-08 365,000 5,244 317,000 457 335,000 579 385,000 488 349,500 953
May-08 369,900 5,243 339,950 512 299,900 459 379,900 440 349,900 1,113
Apr-08 369,900 5,182 319,899 552 308,000 452 395,175 500 359,900 1,195
BrokerMetrics® 2 of 2 05/24/10
Information not guaranteed. © 2010 - 2011 Terradatum and its suppliers and licensors (http://www.terradatum.com/metrics/licensors).