SlideShare une entreprise Scribd logo
1  sur  10
Télécharger pour lire hors ligne
MontanaTrading Relationships -- 2004 to 2010                                                                                                                                                   Mexico
                                                                                                                                                                                                      Domestic
                                                                                                                                                                                                       Canada


                                                                                                                                                     2009-2010 2009-2010      2004-2010 2004-2010
                                                               2004         2005         2006          2007         2008          2009        2010   Difference % Change      Difference % Change
Mexico
Truck           Exports                                   $3,763,202   $3,842,938   $5,857,311   $4,956,643 $12,998,930 $19,233,120 $17,998,415 -$1,234,705          -6.4%   $14,235,213    378.3%
                Imports                                   $4,418,349   $2,953,084   $3,834,932   $4,340,106 $6,365,663 $6,490,304 $8,399,339 $1,909,035              29.4%    $3,980,990     90.1%
                Total Truck Trade with Mexico             $8,181,551   $6,796,022   $9,692,243   $9,296,749 $19,364,593 $25,723,424 $26,397,754    $674,330           2.6%   $18,216,203    222.6%
                                                                                                                                                                  #DIV/0!
Rail            Exports                                  $30,302,093 $33,830,579 $35,884,972 $18,700,711 $21,299,052        $9,906,746 $61,186,804 $51,280,058     517.6%    $30,884,711    101.9%
                Imports                                    $467,501    $145,244           $0          $0 $1,381,158                 $0          $0          $0    #DIV/0!      -$467,501   -100.0%
                Total Rail Trade with Mexico             $30,769,594 $33,975,823 $35,884,972 $18,700,711 $22,680,210        $9,906,746 $61,186,804 $51,280,058     517.6%    $30,417,210     98.9%
                                                                                                                                                                  #DIV/0!
TOTAL           Exports                                  $34,065,295 $37,673,517 $41,742,283 $23,657,354 $34,297,982 $29,139,866 $79,185,219 $50,045,353           171.7%    $45,119,924    132.5%
                Imports                                   $4,885,850 $3,098,328 $3,834,932 $4,340,106 $7,746,821 $6,490,304 $8,399,339 $1,909,035                    29.4%    $3,513,489     71.9%
                Total Trade with Mexico                  $38,951,145 $40,771,845 $45,577,215 $27,997,460 $42,044,803 $35,630,170 $87,584,558 $51,954,388           145.8%    $48,633,413    124.9%


Laredo, TX

Truck           Exports                                  $1,348,584    $2,398,331   $3,742,861   $2,866,711 $8,775,714 $16,460,451 $9,098,139 -$7,362,312           -44.7%  $7,749,555      574.6%
                          % of Total Exports to Mexico        35.8%        62.4%        63.9%        57.8%       67.5%       85.6%       50.5%                      -35.0%                   14.7%
                Imports                                  $2,852,877    $1,916,789   $2,670,669   $3,258,239 $4,174,941 $5,333,448 $6,621,187 $1,287,739              24.1%  $3,768,310      132.1%
                         % of Total Imports to Mexico         64.6%        64.9%        69.6%        75.1%       65.6%       82.2%       78.8%                       -3.3%                   14.3%
                Total Truck Trade Thru Laredo             $4,201,461   $4,315,120   $6,413,530   $6,124,950 $12,950,655 $21,793,899 $15,719,326 -$6,074,573         -27.9% $11,517,865      274.1%
                            % Total Trade with Mexico         51.4%        63.5%        66.2%        65.9%       66.9%       84.7%       59.5%                      -25.2%                    8.2%

Rail            Exports                                $21,615,170 $16,859,257 $10,906,641       $2,331,790    $7,429,094   $2,770,883     $865,630 -$1,905,253     -68.8% -$20,749,540      -96.0%
                          % of Total Exports to Mexico       71.3%       49.8%       30.4%           12.5%         34.9%        28.0%         1.4%                  -26.6%                   -69.9%
                Imports                                   $467,501     $145,244          $0               $0   $1,342,941            $0           $0         $0   #DIV/0!     -$467,501     -100.0%
                          % of Total Imports to Mexico      100.0%      100.0%        0.0%        #DIV/0!          97.2%     #DIV/0!      #DIV/0!                 #DIV/0!                  #DIV/0!
                Total Rail Trade Thru Laredo            $22,082,671 $17,004,501 $10,906,641      $2,331,790    $8,772,035   $2,770,883     $865,630 -$1,905,253     -68.8% -$21,217,041      -96.1%
                            % Total Trade with Mexico        71.8%       50.0%       30.4%           12.5%         38.7%        28.0%         1.4%                  -26.6%                   -70.4%

TOTAL
                Exports                               $22,963,754 $19,257,588 $14,649,502        $5,198,501 $16,204,808 $19,231,334 $9,963,769 -$9,267,565          -48.2% -$12,999,985      -56.6%
                          % of Total Exports to Mexico      67.4%       51.1%       35.1%            22.0%       47.2%       66.0%       12.6%                      -53.4%                   -54.8%
                Imports                                $3,320,378   $2,062,033 $2,670,669        $3,258,239 $5,517,882 $5,333,448 $6,621,187 $1,287,739              24.1%   $3,300,809       99.4%
                         % of Total Imports to Mexico       68.0%       66.6%       69.6%            75.1%       71.2%       82.2%       78.8%                       -3.3%                    10.9%
                Total Trade Thru Laredo                $26,284,132 $21,319,621 $17,320,171       $8,456,740 $21,722,690 $24,564,782 $16,584,956 -$7,979,826         -32.5% -$9,699,176       -36.9%
                            % Total Trade with Mexico       67.5%       52.3%       38.0%            30.2%       51.7%       68.9%       18.9%                      -50.0%                   -48.5%
MontanaTrading Relationships -- 2004 to 2010                                                                                                                                                Mexico
                                                                                                                                                                                                  Domestic
                                                                                                                                                                                                   Canada


                                                                                                                                                    2009-2010 2009-2010    2004-2010 2004-2010
                                                                2004         2005         2006        2007         2008         2009        2010    Difference % Change    Difference % Change
Eagle Pass, TX


Truck            Exports                                    $93,372      $307,043     $466,573    $717,614    $1,043,850    $223,878    $701,474     $477,596    213.3%     $608,102    651.3%
                           % of Total Exports to Mexico        2.5%         8.0%         8.0%       14.5%          8.0%        1.2%        3.9%                    2.7%                   1.4%
                 Imports                                    $42,270            $0       $8,266      $8,790       $12,130     $32,000     $13,241     -$18,759    -58.6%     -$29,029    -68.7%
                          % of Total Imports to Mexico         1.0%         0.0%         0.2%        0.2%          0.2%        0.5%        0.2%                   -0.3%                  -0.8%
                 Total Truck Trade Thru Eagle Pass          $135,642     $307,043     $474,839    $726,404    $1,055,980    $255,878    $714,715     $458,837    179.3%     $579,073    426.9%
                             % Total Trade with Mexico         1.7%         4.5%         4.9%        7.8%          5.5%        1.0%        2.7%                    1.7%                   1.0%

Rail             Exports                                  $1,515,214    $7,079,081 $14,325,730 $13,064,713    $9,570,243   $3,229,867 $17,070,741 $13,840,874    428.5% $15,555,527     1026.6%
                           % of Total Exports to Mexico         5.0%        20.9%       39.9%       69.9%         44.9%        32.6%       27.9%                   -4.7%                  22.9%
                 Imports                                          $0            $0          $0           $0           $0            $0          $0         $0   #DIV/0!          $0    #DIV/0!
                           % of Total Imports to Mexico         0.0%         0.0%        0.0%    #DIV/0!               0    #DIV/0!     #DIV/0!                 #DIV/0!                #DIV/0!
                 Total Rail Trade Thru Eagle Pass          $1,515,214   $7,079,081 $14,325,730 $13,064,713    $9,570,243   $3,229,867 $17,070,741 $13,840,874    428.5% $15,555,527     1026.6%
                             % Total Trade with Mexico          4.9%        20.8%       39.9%       69.9%         42.2%        32.6%       27.9%                   -4.7%                  23.0%

TOTAL
                 Exports                                  $1,608,586    $7,386,124 $14,792,303 $13,782,327 $10,614,093     $3,453,745 $17,772,215 $14,318,470    414.6% $16,163,629    1004.8%
                           % of Total Exports to Mexico         4.7%        19.6%       35.4%       58.3%       30.9%          11.9%       22.4%                  10.6%                  17.7%
                 Imports                                     $42,270            $0      $8,266      $8,790     $12,130        $32,000     $13,241    -$18,759    -58.6%    -$29,029     -68.7%
                          % of Total Imports to Mexico          0.9%         0.0%        0.2%        0.2%        0.2%           0.5%        0.2%                  -0.3%                  -0.7%
                 Total Trade Thru Eagle Pass               $1,650,856   $7,386,124 $14,800,569 $13,791,117 $10,626,223     $3,485,745 $17,785,456 $14,299,711    410.2% $16,134,600     977.3%
                             % Total Trade with Mexico          4.2%        18.1%       32.5%       49.3%       25.3%           9.8%       20.3%                  10.5%                  16.1%

Del Rio, TX

Truck            Exports                                          $0            $0          $0           $0      $3,000            $0          $0         $0    #DIV/0!          $0    #DIV/0!
                           % of Total Exports to Mexico         0.0%         0.0%        0.0%         0.0%        0.0%          0.0%        0.0%                    0.0%                   0.0%
                 Imports                                          $0            $0          $0           $0          $0         $845           $0       -$845    -100.0%         $0    #DIV/0!
                          % of Total Imports to Mexico          0.0%         0.0%        0.0%         0.0%        0.0%          0.0%        0.0%                    0.0%                   0.0%
                 Total Truck Trade Thru Del Rio                    $0           $0          $0           $0      $3,000         $845           $0       -$845    -100.0%         $0    #DIV/0!
                             % Total Trade with Mexico          0.0%         0.0%        0.0%         0.0%        0.0%          0.0%        0.0%                    0.0%                   0.0%

Rail             Exports                                          $0            $0                                                                        $0    #DIV/0!          $0    #DIV/0!
                           % of Total Exports to Mexico         0.0%         0.0%                #DIV/0!      #DIV/0!      #DIV/0!      #DIV/0!                 #DIV/0!                #DIV/0!
                 Imports                                          $0            $0                                                                        $0    #DIV/0!          $0    #DIV/0!
                           % of Total Imports to Mexico         0.0%         0.0%                #DIV/0!      #DIV/0!      #DIV/0!      #DIV/0!                 #DIV/0!                #DIV/0!
                 Total Rail Trade Thru Del Rio                     $0           $0                       $0           $0                                  $0    #DIV/0!          $0    #DIV/0!
                             % Total Trade with Mexico          0.0%         0.0%                     0.0%         0.0%         0.0%        0.0%                    0.0%                   0.0%

TOTAL
                 Exports                                          $0            $0          $0           $0      $3,000            $0          $0         $0    #DIV/0!          $0    #DIV/0!
                           % of Total Exports to Mexico         0.0%         0.0%        0.0%         0.0%        0.1%          0.0%        0.0%                    0.0%                   0.0%
                 Imports                                          $0            $0          $0           $0          $0         $845           $0       -$845    -100.0%         $0    #DIV/0!
                          % of Total Imports to Mexico          0.0%         0.0%        0.0%         0.0%        0.0%          0.0%        0.0%                    0.0%                   0.0%
                 Total Trade Thru Del Rio                          $0           $0          $0           $0      $3,000         $845           $0       -$845    -100.0%         $0    #DIV/0!
                             % Total Trade with Mexico          0.0%         0.0%        0.0%         0.0%        0.0%          0.0%        0.0%                    0.0%                   0.0%
MontanaTrading Relationships -- 2004 to 2010                                                                                                                                               Mexico
                                                                                                                                                                                                 Domestic
                                                                                                                                                                                                  Canada


                                                                                                                                                2009-2010 2009-2010     2004-2010 2004-2010
                                                              2004         2005         2006         2007        2008        2009        2010   Difference % Change     Difference % Change
GPITC

Truck          Exports                                  $1,441,956    $2,705,374   $4,209,434   $3,584,325 $9,822,564 $16,684,329 $9,799,613 -$6,884,716       -41.3%  $8,357,657      579.6%
                         % of Total Exports to Mexico        38.3%        70.4%        71.9%        72.3%       75.6%       86.7%       54.4%                  -32.3%                   16.1%
               Imports                                  $2,895,147    $1,916,789   $2,678,935   $3,267,029 $4,187,071 $5,366,293 $6,634,428 $1,268,135          23.6%  $3,739,281      129.2%
                        % of Total Imports to Mexico         65.5%        64.9%        69.9%        75.3%       65.8%       82.7%       79.0%                   -3.7%                   13.5%
               Total Truck Trade Thru GPITC              $4,337,103   $4,622,163   $6,888,369   $6,851,354 $14,009,635 $22,050,622 $16,434,041 -$5,616,581     -25.5% $12,096,938      278.9%
                           % Total Trade with Mexico         53.0%        68.0%        71.1%        73.7%       72.3%       85.7%       62.3%                  -23.5%                    9.2%

Rail           Exports                                $23,130,384 $23,938,338 $25,232,371 $15,396,503 $16,999,337       $6,000,750 $17,936,371 $11,935,621    198.9%    -$5,194,013     -22.5%
                         % of Total Exports to Mexico       76.3%       70.8%       70.3%       82.3%       79.8%           60.6%       29.3%                  -31.3%                   -47.0%
               Imports                                   $467,501     $145,244          $0           $0 $1,342,941               $0          $0         $0   #DIV/0!     -$467,501     -100.0%
                         % of Total Imports to Mexico        0.0%      100.0%        0.0%    #DIV/0!        97.2%        #DIV/0!     #DIV/0!                 #DIV/0!                  #DIV/0!
               Total Rail Trade Thru GPITC             $23,597,885 $24,083,582 $25,232,371 $15,396,503 $18,342,278      $6,000,750 $17,936,371 $11,935,621    198.9%    -$5,661,514     -24.0%
                           % Total Trade with Mexico        76.7%       70.9%       70.3%       82.3%       80.9%           60.6%       29.3%                  -31.3%                   -47.4%

TOTAL
               Exports                               $24,572,340 $26,643,712 $29,441,805 $18,980,828 $26,821,901 $22,685,079 $27,735,984        $5,050,905      22.3%   $3,163,644       12.9%
                         % of Total Exports to Mexico      72.1%       70.7%       70.5%       80.2%       78.2%       77.8%       35.0%                       -42.8%                   -37.1%
               Imports                                $3,362,648   $2,062,033 $2,678,935 $3,267,029 $5,530,012 $5,366,293 $6,634,428            $1,268,135      23.6%   $3,271,780       97.3%
                        % of Total Imports to Mexico       68.8%       66.6%       69.9%       75.3%       71.4%       82.7%       79.0%                        -3.7%                    10.2%
               Total Trade Thru GPITC                 $27,934,988 $28,705,745 $32,120,740 $22,247,857 $32,351,913 $28,051,372 $34,370,412       $6,319,040      22.5%   $6,435,424       23.0%
                           % Total Trade with Mexico       71.7%       70.4%       70.5%       79.5%       76.9%       78.7%       39.2%                       -39.5%                   -32.5%
MontanaTrading Relationships -- 2004 to 2010                                                                                                                                     Mexico
                                                                                                                                                                                  Domestic
                                                                                                                                                                                   Canada


                                                                                                          Leading Exports from Montana to Mexico (Surface Transportation)
 2010        Leading Exports from Montana to Mexico (Surface Transportation)         2010     2010                                                                                2010
Rank                                                                           Export        Rank         Coahuila                                                              Export
1       26   Ores; Slag and Ash                                                $30,754,218   1       10   Cereals                                                           $9,403,599
2       10   Cereals                                                           $22,332,448   2       27   Mineral Fuels; Oils and Waxes                                      $336,600
3       84   Computer-Related Machinery and Parts                               $7,690,758   3       84   Computer-Related Machinery and Parts                               $106,539
4       27   Mineral Fuels; Oils and Waxes                                      $5,055,155   4       25   Salt; Sulfur; Plaster and Cement                                     $91,026
5       44   Wood and Articles                                                  $2,494,340   5       86   Locomotives and Traffic Signals                                      $89,450
6       85   Electrical Machinery; Equipment and Parts                          $1,685,264   6       73   Articles of Iron and Steel                                           $63,000
7       47   Pulp of Wood and Paperboard                                        $1,245,049   7       98   Special Classification Provisions                                    $10,428
8       86   Locomotives and Traffic Signals                                    $1,231,298   8       85   Electrical Machinery; Equipment and Parts                             $4,515
9       87   Vehicles Other than Railway                                        $1,087,863   9
10      25   Salt; Sulfur; Plaster and Cement                                   $1,043,418   10

 2010        Leading Imports to Montana from Mexico (Surface Transportation)          2010    2010        Leading Exports from Montana to Mexico (Surface Transportation)        2010
Rank                                                                                Import   Rank         Nuevo Leon                                                            Export
1       87   Vehicles Other than Railway                                        $4,883,736   1       44   Wood and Articles                                                 $1,724,288
2       85   Electrical Machinery; Equipment and Parts                          $1,239,605   2       10   Cereals                                                           $1,083,637
3       62   Not Knitted or Crocheted Apparel                                    $478,091    3       73   Articles of Iron and Steel                                         $151,341
4       24   Tobacco and Manufactured Tobacco                                    $421,040    4       25   Salt; Sulfur; Plaster and Cement                                   $130,912
5       84   Computer-Related Machinery and Parts                                $419,102    5       39   Plastics and Articles                                                $64,950
6       98   Special Classification Provisions                                   $254,744    6        4   Dairy Products                                                       $60,947
7       94   Furniture; Lamps and Prefabricated Buildings                        $155,401    7       17   Sugars and Sugar Confectionery                                       $58,141
8       83   Miscellaneous Articles of Base Metals                               $150,990    8       86   Locomotives and Traffic Signals                                      $55,300
9       73   Articles of Iron and Steel                                          $100,247    9       84   Computer-Related Machinery and Parts                                 $33,165
10      64   Footwear                                                              $77,450   10      15   Animal or Vegetable Fats and Oils                                    $31,588

                                                                                              2010        Leading Exports from Montana to Mexico (Surface Transportation)       2010
                                                                                             Rank         Tamaulipas                                                           Export
                                                                                             1       59   Impregnated Fabrics                                                 $66,440
                                                                                             2       84   Computer-Related Machinery and Parts                                $14,768
                                                                                             3       95   Toys; Games and Sport Equipment                                     $10,800
                                                                                             4       73   Articles of Iron and Steel                                           $8,623
                                                                                             5       87   Vehicles Other than Railway                                          $3,305
                                                                                             6
                                                                                             7
                                                                                             8
                                                                                             9
                                                                                             10
MontanaTrading Relationships -- 2004 to 2010                                                                                                            Mexico
                                                                                                                                                          Domestic
                                                                                                                                                           Canada


                                                                              Rail Truck        Domestic --                               Rail    Truck
Domestic -- 2002                     Domestic -- 2007                      Change Change                2015                           Change    Change
Exports            Rail Truck        Exports            Rail Truck                           Exports            Rail   Truck
Colorado             0     46   5%   Colorado             0     80   5%        0%     74%    Colorado            48     103      6%    #DIV/0!    124%
Montana                              Montana                                                 Montana
Nebraska            11      17 3%    Nebraska            14    27     3%    27%    59%       Nebraska            11       21   1%          -4%    25%
New Mexico           0      11 1%    New Mexico          67           4% #DIV/0! -100%       New Mexico          60       15   3%      #DIV/0!    37%
North Dakota         0      50 5%    North Dakota        73   195    16% #DIV/0!  290%       North Dakota        83      247 13%       #DIV/0!   395%
Oklahoma            15       4 2%    Oklahoma             0     0     0%  -100%  -100%       Oklahoma            32       10   2%         115%   142%
South Dakota        40     146 18%   South Dakota         4   114     7%   -90%   -22%       South Dakota         2      164   7%         -94%    12%
Texas              206       0 20%   Texas              456    44    31%   121% #DIV/0!      Texas              377       64 18%           83% #DIV/0!
Wyoming              0     460 46%   Wyoming                  907    55% #DIV/0!   97%       Wyoming             15    1,253 51%       #DIV/0!   172%
Total ($m)         272     734       Total ($m)         614 1,367          126%    86%       Total ($m)         630    1,877 100%         131%   156%
                         1,006                              1,981                  97%                                 2,507                     149%

Imports            Rail Truck        Imports            Rail Truck                           Imports           Rail    Truck
Colorado            76    462 26%    Colorado             0    747 36%      -100%     62%    Colorado             13     780    30%       -83%     69%
Montana                              Montana                                                 Montana            170             0.07
Nebraska             0   195 9%      Nebraska             0   513    24%   #DIV/0!    163%   Nebraska              0      98     4%    #DIV/0!    -50%
New Mexico           0    19 1%      New Mexico           0     0     0%   #DIV/0!   -100%   New Mexico         -          3     0%    #DIV/0!    -84%
North Dakota         0   201 10%     North Dakota         0   398    19%   #DIV/0!     98%   North Dakota         43     411    17%    #DIV/0!    105%
Oklahoma             0   270 13%     Oklahoma             0   513    24%   #DIV/0!     90%   Oklahoma              6     192     8%    #DIV/0!    -29%
South Dakota         0   108 5%      South Dakota         0   191     9%   #DIV/0!     77%   South Dakota         21     177     8%    #DIV/0!     64%
Texas               43   677 34%     Texas                  1,367    65%    -100%     102%   Texas                19     275    11%       -56%    -59%
Wyoming              0    53 3%      Wyoming             91   283    18%   #DIV/0!    434%   Wyoming              33     362    15%    #DIV/0!    583%
Total ($m)         119 1,985         Total ($m)          91 4,012            -24%     102%   Total ($m)         304    2,299   100%       156%     16%
                       2,104                                4,103                      95%                             2,603                       24%

TOTALS             Rail Truck        TOTALS             Rail Truck                           TOTALS            Rail    Truck
Colorado            76    508 19%    Colorado             0    827 27%      -100%     63%    Colorado            61      883    19%       -19%     74%
Montana                              Montana                                                 Montana                              0
Nebraska            11   212 7%      Nebraska            14   540 18%    27%          155%   Montana             11      120     3%        -3%    -44%
New Mexico           0    30 1%      New Mexico          67     0 2% #DIV/0!         -100%   Nebraska            60       18     2%    #DIV/0!    -39%
North Dakota         0   251 8%      North Dakota        73   593 21% #DIV/0!         136%   New Mexico         126      658    16%    #DIV/0!    162%
Oklahoma            15   274 9%      Oklahoma             0   513 16%  -100%           87%   North Dakota        38      202     5%       155%    -26%
South Dakota        40   254 9%      South Dakota         4   305 10%   -90%           20%   Oklahoma            23      341     7%       -42%     34%
Texas              249   677 30%     Texas              456 1,411 60%    83%          108%   South Dakota       397      339    15%        59%    -50%
Wyoming              0   513 16%     Wyoming             91 1,190 41% #DIV/0!         132%   Texas               48    1,615    34%    #DIV/0!    215%
Total ($m)         391 2,719         Total ($m)         705 5,379        80%           98%   Total ($m)         764    4,176   100%    #DIV/0!     54%
                       3,110                                6,084                      96%                             4,940                       59%
MontanaTrading Relationships -- 2004 to 2010                                                                                                                                               Mexico
                                                                                                                                                                                                  Domestic
                                                                                                                                                                                                   Canada


                                                                                                                                                                     2009-2010 2009-2010        2004-2010 2004-2010
                                                                   2004           2005           2006           2007           2008          2009           2010     Difference % Change        Difference % Change
Canada
Truck            Exports                                   $165,589,904    $180,877,118   $260,106,701  $318,953,478   $369,833,474 $245,164,585     $297,595,726 $52,431,141       21.4%     $132,005,822      79.7%
                 Imports                                   $655,587,959    $643,908,657   $602,009,113  $805,317,832   $839,483,442 $410,307,062     $461,339,622 $51,032,560       12.4%    -$194,248,337     -29.6%
                 Total Truck Trade with Canada             $821,177,863    $824,785,775   $862,115,814 $1,124,271,310 $1,209,316,916 $655,471,647    $758,935,348 $103,463,701      15.8%     -$62,242,515      -7.6%
                                                                                                                                                                                  #DIV/0!
Rail             Exports                                   $125,214,933    $179,005,514   $158,371,199   $251,818,404   $307,198,966 $177,456,112    $162,772,777 -$14,683,335       -8.3%     $37,557,844      30.0%
                 Imports                                   $196,484,712    $203,705,262   $186,531,850   $190,313,837   $228,720,769 $104,972,893    $110,824,018   $5,851,125        5.6%    -$85,660,694     -43.6%
                 Total Rail Trade with Canada              $321,699,645    $382,710,776   $344,903,049   $442,132,241   $535,919,735 $282,429,005    $273,596,795 -$8,832,210        -3.1%    -$48,102,850     -15.0%
                                                                                                                                                                                  #DIV/0!
TOTAL            Exports                                   $290,804,837   $359,882,632   $418,477,900   $570,771,882   $677,032,440 $422,620,697   $460,368,503     $37,747,806       8.9%    $169,563,666      58.3%
                 Imports                                   $852,072,671   $847,613,919   $788,540,963   $995,631,669 $1,068,204,211 $515,279,955   $572,163,640     $56,883,685     11.0%    -$279,909,031     -32.9%
                 Total Trade with Canada                  $1,142,877,508 $1,207,496,551 $1,207,018,863 $1,566,403,551 $1,745,236,651 $937,900,652 $1,032,532,143    $94,631,491     10.1%    -$110,345,365      -9.7%


Raymond, MT

Truck            Exports                                   $17,419,032      $15,729,177    $16,266,332    $15,460,548    $20,835,730   $12,948,504    $15,889,528    $2,941,024     22.7%      -$1,529,504      -8.8%
                           % of Total Exports to Canada          10.5%            8.7%           6.3%           4.8%           5.6%          5.3%           5.3%                     0.1%                       -5.2%
                 Imports                                   $88,010,680      $77,981,295    $74,946,233    $66,847,217    $72,245,962   $32,361,277    $39,682,066    $7,320,789     22.6%     -$48,328,614     -54.9%
                          % of Total Imports to Canada           13.4%           12.1%          12.4%           8.3%           8.6%          7.9%           8.6%                     0.7%                       -4.8%
                 Total Truck Trade Thru Raymond            $105,429,712     $93,710,472    $91,212,565    $82,307,765    $93,081,692   $45,309,781    $55,571,594   $10,261,813     22.6%     -$49,858,118     -47.3%
                             % Total Trade with Canada           12.8%           11.4%          10.6%           7.3%           7.7%          6.9%           7.3%                     0.4%                       -5.5%

Rail             Exports                                             $0              $0                                                                                     $0    #DIV/0!              $0    #DIV/0!
                           % of Total Exports to Canada            0.0%           0.0%           0.0%           0.0%           0.0%          0.0%           0.0%                      0.0%                       0.0%
                 Imports                                             $0              $0                                                                                     $0    #DIV/0!              $0    #DIV/0!
                          % of Total Imports to Canada             0.0%           0.0%           0.0%           0.0%           0.0%          0.0%           0.0%                      0.0%                       0.0%
                 Total Truck Trade Thru Raymond                       $0             $0                            $0             $0            $0             $0           $0    #DIV/0!              $0    #DIV/0!
                             % Total Trade with Canada             0.0%           0.0%           0.0%           0.0%           0.0%          0.0%           0.0%                      0.0%                       0.0%

TOTAL
                 Exports                                    $17,419,032     $15,729,177    $16,266,332    $15,460,548    $20,835,730   $12,948,504    $15,889,528    $2,941,024     22.7%      -$1,529,504      -8.8%
                           % of Total Exports to Canada           6.0%            4.4%           3.9%           2.7%           3.1%          3.1%           3.5%                     0.4%                       -2.5%
                 Imports                                    $88,010,680     $77,981,295    $74,946,233    $66,847,217    $72,245,962   $32,361,277    $39,682,066    $7,320,789     22.6%     -$48,328,614     -54.9%
                          % of Total Imports to Canada           10.3%            9.2%           9.5%           6.7%           6.8%          6.3%           6.9%                     0.7%                       -3.4%
                 Total Trade Thru Raymond                  $105,429,712     $93,710,472    $91,212,565    $82,307,765    $93,081,692   $45,309,781    $55,571,594   $10,261,813     22.6%     -$49,858,118     -47.3%
                             % Total Trade with Canada            9.2%            7.8%           7.6%           5.3%           5.3%          4.8%           5.4%                     0.6%                       -3.8%
MontanaTrading Relationships -- 2004 to 2010                                                                                                                                            Mexico
                                                                                                                                                                                              Domestic
                                                                                                                                                                                               Canada


                                                                                                                                                                    2009-2010 2009-2010     2004-2010 2004-2010
                                                                  2004           2005           2006           2007           2008          2009           2010     Difference % Change     Difference % Change
Sweet Grass, MT


Truck             Exports                                  $73,604,550     $90,339,751   $139,893,709   $187,682,890   $239,263,950 $135,052,880    $184,930,742   $49,877,862   36.9% $111,326,192      151.2%
                            % of Total Exports to Canada         44.4%          49.9%          53.8%          58.8%          64.7%        55.1%           62.1%                   7.1%                    17.7%
                  Imports                                  $245,974,813   $271,403,781   $256,431,167   $472,093,151   $440,902,777 $197,393,020    $213,828,200   $16,435,180    8.3% -$32,146,613      -13.1%
                           % of Total Exports to Canada          37.5%          42.1%          42.6%          58.6%          52.5%        48.1%           46.3%                  -1.8%                     8.8%
                  Total Truck Trade Thru Sweetgrass         319,579,363   $361,743,532   $396,324,876   $659,776,041   $680,166,727 $332,445,900    $398,758,942   $66,313,042   19.9%  $79,179,579       24.8%
                              % Total Trade with Canada          38.9%          43.9%          46.0%          58.7%          56.2%        50.7%           52.5%                   1.8%                    13.6%

Rail              Exports                                  $54,028,154     $57,004,860    $35,683,132    $82,247,290   $146,069,980 $83,706,311      $95,683,332   $11,977,021   14.3%    $41,655,178      77.1%
                            % of Total Exports to Canada         43.1%          31.8%          22.5%          32.7%          47.5%        47.2%           58.8%                  11.6%                     15.6%
                  Imports                                  $149,096,740   $150,464,210   $120,539,726   $131,840,975   $174,647,026 $74,402,611      $71,035,928   -$3,366,683   -4.5%    -$78,060,812    -52.4%
                            % of Total Exports to Canada         46.3%          73.9%          64.6%          69.3%          76.4%        70.9%           64.1%                  -6.8%                     17.8%
                  Total Rail Trade Thru Sweet Grass        $203,124,894   $207,469,070   $156,222,858   $214,088,265   $320,717,006 $158,108,922    $166,719,260    $8,610,338    5.4%    -$36,405,634    -17.9%
                               % Total Trade with Canada         63.1%          54.2%          45.3%          48.4%          59.8%        56.0%           60.9%                   5.0%                     -2.2%

TOTAL
                  Exports                                  $127,632,704   $147,344,611   $175,576,841   $269,930,180  $385,333,930 $218,759,191     $280,614,074   $61,854,883   28.3% $152,981,370      119.9%
                            % of Total Exports to Canada         43.9%          40.9%          42.0%          47.3%          56.9%        51.8%           61.0%                   9.2%                    17.1%
                  Imports                                  $395,071,553   $421,867,991   $376,970,893   $603,934,126  $615,549,803 $271,795,631     $284,864,128   $13,068,497    4.8% -$110,207,425     -27.9%
                           % of Total Imports to Canada          46.4%          49.8%          47.8%          60.7%          57.6%        52.7%           49.8%                  -3.0%                     3.4%
                  Total Trade Thru Sweet Grass             $522,704,257   $569,212,602   $552,547,734   $873,864,306 $1,000,883,733 $490,554,822    $565,478,202   $74,923,380   15.3%   $42,773,945       8.2%
                              % Total Trade with Canada          45.7%          47.1%          45.8%          55.8%          57.3%        52.3%           54.8%                   2.5%                     9.0%

Portal, ND

Truck             Exports                                   $17,180,365    $12,990,619    $27,894,913    $24,275,042    $18,675,432   $21,280,029    $22,924,763    $1,644,734    7.7%     $5,744,398     33.4%
                            % of Total Exports to Canada         10.4%           7.2%          10.7%           7.6%           5.0%          8.7%           7.7%                  -1.0%                    -2.7%
                  Imports                                   $10,959,252     $9,474,699    $10,848,134     $7,771,147     $9,217,533   $10,432,657    $12,862,007    $2,429,350   23.3%     $1,902,755     17.4%
                           % of Total Imports to Canada           1.7%           1.5%           0.0%           1.0%           1.1%          2.5%           2.8%                   0.2%                     1.1%
                  Total Truck Trade Thru Portal             $28,139,617    $22,465,318    $38,743,047    $32,046,189    $27,892,965   $31,712,686    $35,786,770    $4,074,084   12.8%     $7,647,153     27.2%
                              % Total Trade with Canada           3.4%           2.7%           4.5%           2.9%           2.3%          4.8%           4.7%                  -0.1%                     1.3%

Rail              Exports                                     $933,241       $981,205      $1,482,302     $2,718,560     $1,181,140    $9,351,440    $13,291,183   $11,808,881    42.1%   $12,357,942    1324.2%
                            % of Total Exports to Canada          0.7%           0.5%           0.9%           1.1%           0.4%          5.3%           8.2%                    2.9%                     7.4%
                  Imports                                     $496,273       $228,896       $153,155       $332,533       $765,475      $347,985       $102,813       -$50,342   -70.5%     -$393,460     -79.3%
                            % of Total Imports to Canada          0.3%           0.1%           0.1%           0.2%           0.3%          0.3%           0.1%                   -0.2%                    -0.2%
                  Total Rail Trade Thru Portal               $1,429,514     $1,210,101     $1,635,457     $3,051,093     $1,946,615    $9,699,425    $13,393,996   $11,758,539    38.1%   $11,964,482     837.0%
                               % Total Trade with Canada          0.4%           0.3%           0.5%           0.7%           0.4%          3.4%           4.9%                    1.5%                     4.5%

TOTAL
                  Exports                                   $18,113,606    $13,971,824    $27,894,913    $24,275,042    $18,675,432   $21,280,029    $22,924,763    $1,644,734    7.7%    $18,102,340     26.6%
                            % of Total Exports to Canada          6.2%           3.9%           6.7%           4.3%           2.8%          5.0%           5.0%                  -0.1%                    -1.2%
                  Imports                                   $11,455,525     $9,703,595    $11,001,289     $8,103,680     $9,983,008   $10,780,642    $12,964,820    $2,184,178   20.3%     $1,509,295     13.2%
                           % of Total Imports to Canada           1.3%           1.1%           1.4%           0.5%           0.6%          2.1%           2.3%                   0.2%                     0.9%
                  Total Trade Thru Portal                   $29,569,131    $23,675,419    $38,896,202    $32,378,722    $28,658,440   $32,060,671    $35,889,583    $3,828,912   11.9%    $19,611,635     21.4%
                              % Total Trade with Canada           2.6%           2.0%           3.2%           2.1%           1.6%          3.4%           3.5%                   0.1%                     0.9%
MontanaTrading Relationships -- 2004 to 2010                                                                                                                                    Mexico
                                                                                                                                                                                      Domestic
                                                                                                                                                                                       Canada


                                                                                                                                                            2009-2010 2009-2010     2004-2010 2004-2010
                                                                2004          2005          2006          2007          2008          2009          2010    Difference % Change     Difference % Change
Wild Horse
                                                                    0
Truck           Exports                                            $0            $0            $0            $0            $0            $0            $0          $0    #DIV/0!           $0    #DIV/0!
                          % of Total Exports to Canada          0.0%          0.0%          0.0%         19.4%          0.0%          0.0%          0.0%                     0.0%                    0.0%
                Imports                                  $14,344,808    $48,908,056   $23,835,553   $24,189,788   $59,432,153   $19,691,493   $23,445,137   $3,753,644      19.1%   $9,100,329     63.4%
                         % of Total Imports to Canada          -7.4%          7.6%          4.0%         19.0%          7.1%          4.8%          5.1%                     0.3%                   12.5%
                Total Truck Trade Thru GPITC             $14,344,808    $48,908,056   $23,835,553   $24,189,788   $59,432,153   $19,691,493   $23,445,137   $3,753,644      19.1%   $9,100,329     63.4%
                            % Total Trade with Canada         -23.0%          5.9%          2.8%         19.3%          4.9%          3.0%          3.1%                     0.1%                   26.1%

Rail            Exports                                            $0            $0            $0            $0            $0            $0            $0          $0    #DIV/0!           $0    #DIV/0!
                          % of Total Exports to Canada          0.0%          0.0%          0.0%         11.0%          0.0%          0.0%          0.0%                     0.0%                    0.0%
                Imports                                            $0            $0            $0            $0            $0            $0            $0          $0    #DIV/0!           $0    #DIV/0!
                          % of Total Imports to Canada          0.0%          0.0%          0.0%         22.4%          0.0%          0.0%          0.0%                     0.0%                    0.0%
                Total Rail Trade Thru GPITC                        $0            $0            $0            $0            $0            $0            $0          $0    #DIV/0!           $0    #DIV/0!
                             % Total Trade with Canada          0.0%          0.0%          0.0%         17.7%          0.0%          0.0%          0.0%                     0.0%                    0.0%

TOTAL
                Exports                                            $0            $0            $0            $0            $0            $0            $0          $0    #DIV/0!           $0    #DIV/0!
                          % of Total Exports to Canada          0.0%          0.0%          0.0%          0.0%          0.0%          0.0%          0.0%                     0.0%                    0.0%
                Imports                                  $14,344,808    $48,908,056   $23,835,553   $24,189,788   $59,432,153   $19,691,493   $23,445,137   $3,753,644      19.1%   $9,100,329     63.4%
                         % of Total Imports to Canada          -5.1%          5.8%          3.0%          2.4%          5.6%          3.8%          4.1%                     0.3%                    9.2%
                Total Trade Thru GPITC                   $14,344,808    $48,908,056   $23,835,553   $24,189,788   $59,432,153   $19,691,493   $23,445,137   $3,753,644      19.1%   $9,100,329     63.4%
                            % Total Trade with Canada         -13.0%          4.1%          2.0%          1.5%          3.4%          2.1%          2.3%                     0.2%                   15.3%
MontanaTrading Relationships -- 2004 to 2010                                                                                                                                         Mexico
                                                                                                                                                                                           Domestic
                                                                                                                                                                                            Canada


                                                                                                                                                                 2009-2010 2009-2010     2004-2010 2004-2010
                                                                2004           2005           2006           2007           2008         2009           2010     Difference % Change     Difference % Change

GPITC
                                                          #DIV/0!
Truck           Exports                                  $108,203,947   $119,059,547   $184,054,954   $227,418,480   $278,775,112 $169,281,413   $223,745,033   $54,463,620   32.2% $115,541,086      106.8%
                          % of Total Exports to Canada         65.3%          65.8%          70.8%          71.3%          75.4%        69.0%          75.2%                   6.1%                     9.8%
                Imports                                  $288,697,905   $345,515,713   $307,381,186   $519,514,634   $530,388,193 $240,465,674   $266,024,872   $25,559,198   10.6% -$22,673,033       -7.9%
                         % of Total Imports to Canada          44.0%          53.7%          51.1%          64.5%          63.2%        58.6%          57.7%                  -0.9%                    13.6%
                Total Truck Trade Thru GPITC             $396,901,852   $464,575,260   $491,436,140   $746,933,114   $809,163,305 $409,747,087   $489,769,905   $80,022,818   19.5%  $92,868,053       23.4%
                            % Total Trade with Canada          48.3%          56.3%          57.0%          66.4%          66.9%        62.5%          64.5%                   2.0%                    16.2%

Rail            Exports                                   $54,961,395    $57,986,065    $37,165,434    $84,965,850   $147,251,120 $93,057,751    $108,974,515   $15,916,764   17.1%    $54,013,120     98.3%
                          % of Total Exports to Canada         33.2%          32.1%          14.3%          26.6%          39.8%        38.0%          36.6%                  -1.3%                     3.4%
                Imports                                  $149,593,013   $150,693,106   $120,692,881   $132,173,508   $175,412,501 $74,750,596     $71,138,741   -$3,611,855   -4.8%    -$78,454,272   -52.4%
                          % of Total Imports to Canada         22.8%          23.4%          20.0%          16.4%          20.9%        18.2%          15.4%                  -2.8%                    -7.4%
                Total Rail Trade Thru GPITC              $204,554,408   $208,679,171   $157,858,315   $217,139,358   $322,663,621 $167,808,347   $180,113,256   $12,304,909    7.3%    -$24,441,152   -11.9%
                             % Total Trade with Canada         24.9%          25.3%          18.3%          19.3%          26.7%        25.6%          23.7%                  -1.9%                    -1.2%

TOTAL
                Exports                                  $163,165,342   $177,045,612   $221,220,388   $312,384,330  $426,026,232 $262,339,164    $332,719,548   $70,380,384   26.8% $169,554,206      103.9%
                          % of Total Exports to Canada         56.1%          49.2%          52.9%          54.7%          62.9%        62.1%          72.3%                  10.2%                    16.2%
                Imports                                  $438,290,918   $496,208,819   $428,074,067   $651,688,142  $705,800,694 $315,216,270    $337,163,613   $21,947,343    7.0% -$101,127,305     -23.1%
                         % of Total Imports to Canada          51.4%          58.5%          54.3%          65.5%          66.1%        61.2%          58.9%                  -2.2%                     7.5%
                Total Trade Thru GPITC                   $601,456,260   $673,254,431   $649,294,455   $964,072,472 $1,131,826,926 $577,555,434   $669,883,161   $92,327,727   16.0%   $68,426,901      11.4%
                            % Total Trade with Canada          52.6%          55.8%          53.8%          61.5%          64.9%        61.6%          64.9%                   3.3%                    12.3%
MontanaTrading Relationships -- 2004 to 2010                                                                                                                                          Mexico
                                                                                                                                                                                      Domestic
                                                                                                                                                                                       Canada


                                                                                                             Leading Exports from Montana to Canada (Surface Transportation)
2010        Leading Exports from Montana to Canada (Surface Transportation)           2010       2010                                                                                 2010
Rank                                                                                 Export    Export        Alberta                                                                Export
   1   27   Mineral Fuels; Oils and Waxes                                       $96,375,033         1   87   Vehicles Other than Railway                                       $74,663,972
   2   87   Vehicles Other than Railway                                         $89,654,951         2   27   Mineral Fuels; Oils and Waxes                                     $55,768,755
   3   88   Aircraft; Spacecraft and Parts                                      $54,030,874         3   25   Salt; Sulfur; Plaster and Cement                                  $37,264,279
   4   29   Organic Chemicals                                                   $52,178,833         4   29   Organic Chemicals                                                 $32,129,156
   5   25   Salt; Sulfur; Plaster and Cement                                    $42,308,877         5   84   Computer-Related Machinery and Parts                              $23,713,149
   6   84   Computer-Related Machinery and Parts                                $42,215,717         6   23   Food Residues and Waste                                           $10,241,699
   7   44   Wood and Articles                                                   $22,742,241         7    1   Live Animals                                                       $9,230,240
   8   38   Miscellaneous Chemical Products                                     $14,228,555         8   12   Oil Seeds and Oleaginous Fruits                                    $4,293,333
   9   26   Ores; Slag and Ash                                                  $10,982,068         9   73   Articles of Iron and Steel                                         $3,971,337
  10   23   Food Residues and Waste                                             $10,481,580        10   85   Electrical Machinery; Equipment and Parts                          $3,344,922

2010        Leading Imports to Montana from Canada (Surface Transportation)             2010     2010        Leading Exports from Montana to Canada (Surface Transportation)          2010
Rank                                                                                  Import   Export        British Colombia                                                       Export
   1   27   Mineral Fuels; Oils and Waxes                                     $3,773,944,557        1   44   Wood and Articles                                                 $16,024,075
   2   31   Fertilizers                                                        $127,742,168         2   84   Computer-Related Machinery and Parts                               $3,318,958
   3   44   Wood and Articles                                                    $68,557,863        3   87   Vehicles Other than Railway                                        $2,831,822
   4   84   Computer-Related Machinery and Parts                                 $61,129,063        4   27   Mineral Fuels; Oils and Waxes                                      $2,516,751
   5   73   Articles of Iron and Steel                                           $39,610,755        5   19   Preparations of Cereals and Flour                                  $1,915,114
   6   98   Special Classification Provisions                                    $30,838,325        6   68   Stone; Plaster; Cement and Asbestos                                $1,890,770
   7   23   Food Residues and Waste                                              $17,533,756        7   25   Salt; Sulfur; Plaster and Cement                                   $1,421,268
   8   12   Oil Seeds and Oleaginous Fruits                                      $14,259,731        8    8   Edible Fruit and Nuts                                              $1,276,167
   9   28   Inorganic Chemicals                                                  $13,887,582        9   90   Measuring and Testing Instruments                                   $699,664
  10   39   Plastics and Articles                                                $12,787,268       10   21   Miscellaneous Edible Preparations                                   $660,866

                                                                                                2010         Leading Exports from Montana to Canada (Surface Transportation)          2010
                                                                                               Export        Saskatchewan                                                           Export
                                                                                                   1    27   Mineral Fuels; Oils and Waxes                                     $28,444,501
                                                                                                   2    38   Miscellaneous Chemical Products                                    $9,444,276
                                                                                                   3    84   Computer-Related Machinery and Parts                               $8,353,204
                                                                                                   4    29   Organic Chemicals                                                  $6,494,946
                                                                                                   5    87   Vehicles Other than Railway                                        $5,127,907
                                                                                                   6     7   Edible Vegetables and Roots                                        $3,116,217
                                                                                                   7    72   Iron and Steel                                                     $1,842,316
                                                                                                   8    12   Oil Seeds and Oleaginous Fruits                                      $768,694
                                                                                                   9    98   Special Classification Provisions                                   $683,655
                                                                                                  10    95   Toys; Games and Sport Equipment                                     $666,245

Contenu connexe

Tendances

Colorado's Trading Relationship Through the Ports-to-Plains Region -- 2004-2010
Colorado's Trading Relationship Through the Ports-to-Plains Region -- 2004-2010Colorado's Trading Relationship Through the Ports-to-Plains Region -- 2004-2010
Colorado's Trading Relationship Through the Ports-to-Plains Region -- 2004-2010Ports-To-Plains Blog
 
Texas Trade Relationships 2004 - 2011
Texas Trade Relationships 2004 - 2011Texas Trade Relationships 2004 - 2011
Texas Trade Relationships 2004 - 2011Ports-To-Plains Blog
 
Slide presentation 2 q10
Slide presentation 2 q10Slide presentation 2 q10
Slide presentation 2 q10Cia Hering RI
 
Market Watch June 2013
Market Watch June 2013Market Watch June 2013
Market Watch June 2013Chaba Tamasi
 
August 2021 market watch
August 2021 market watchAugust 2021 market watch
August 2021 market watchMichelle Makos
 
September 2020 - Market Report - Toronto & GTA Housing Sales
September 2020 - Market Report - Toronto & GTA Housing SalesSeptember 2020 - Market Report - Toronto & GTA Housing Sales
September 2020 - Market Report - Toronto & GTA Housing SalesMichelle Makos
 
November Market Watch 2020
November Market Watch 2020November Market Watch 2020
November Market Watch 2020Michelle Makos
 
July 2021 - Market Report
July 2021 - Market Report July 2021 - Market Report
July 2021 - Market Report Michelle Makos
 

Tendances (11)

Colorado's Trading Relationship Through the Ports-to-Plains Region -- 2004-2010
Colorado's Trading Relationship Through the Ports-to-Plains Region -- 2004-2010Colorado's Trading Relationship Through the Ports-to-Plains Region -- 2004-2010
Colorado's Trading Relationship Through the Ports-to-Plains Region -- 2004-2010
 
Texas Trade Relationships 2004 - 2011
Texas Trade Relationships 2004 - 2011Texas Trade Relationships 2004 - 2011
Texas Trade Relationships 2004 - 2011
 
Slide presentation 2 q10
Slide presentation 2 q10Slide presentation 2 q10
Slide presentation 2 q10
 
IT Industry Statistics 2007 Final Report
IT Industry Statistics 2007 Final ReportIT Industry Statistics 2007 Final Report
IT Industry Statistics 2007 Final Report
 
Market Watch June 2013
Market Watch June 2013Market Watch June 2013
Market Watch June 2013
 
August 2021 market watch
August 2021 market watchAugust 2021 market watch
August 2021 market watch
 
September 2020 - Market Report - Toronto & GTA Housing Sales
September 2020 - Market Report - Toronto & GTA Housing SalesSeptember 2020 - Market Report - Toronto & GTA Housing Sales
September 2020 - Market Report - Toronto & GTA Housing Sales
 
Hhaf Defaultprob
Hhaf DefaultprobHhaf Defaultprob
Hhaf Defaultprob
 
November Market Watch 2020
November Market Watch 2020November Market Watch 2020
November Market Watch 2020
 
July 2021 - Market Report
July 2021 - Market Report July 2021 - Market Report
July 2021 - Market Report
 
Canada taxation 2009
Canada taxation 2009Canada taxation 2009
Canada taxation 2009
 

En vedette (20)

Princípios do direito penal
Princípios do direito penalPrincípios do direito penal
Princípios do direito penal
 
Historia
HistoriaHistoria
Historia
 
Presentation 3
Presentation 3Presentation 3
Presentation 3
 
MBA (GCO)
MBA (GCO)MBA (GCO)
MBA (GCO)
 
O Surgimento de Si Mesmo (Individuação)
O Surgimento de Si Mesmo (Individuação)O Surgimento de Si Mesmo (Individuação)
O Surgimento de Si Mesmo (Individuação)
 
pereira
pereirapereira
pereira
 
Lobo
LoboLobo
Lobo
 
CalendáRio So Para Mulheres..
CalendáRio So Para Mulheres..CalendáRio So Para Mulheres..
CalendáRio So Para Mulheres..
 
Facundo Cabral
Facundo CabralFacundo Cabral
Facundo Cabral
 
Se304 lec11
Se304 lec11Se304 lec11
Se304 lec11
 
Perii abrazive
Perii abrazivePerii abrazive
Perii abrazive
 
FéRias
FéRiasFéRias
FéRias
 
Licao21
Licao21Licao21
Licao21
 
TEst japones
TEst japonesTEst japones
TEst japones
 
Exponor Brasil Apresentacao 2009
Exponor Brasil Apresentacao 2009Exponor Brasil Apresentacao 2009
Exponor Brasil Apresentacao 2009
 
SEXTA SÉRIE_REGRA DE TRÊS NO "PAÍS DAS LETRAS"-Revisada
SEXTA SÉRIE_REGRA DE TRÊS NO "PAÍS DAS LETRAS"-RevisadaSEXTA SÉRIE_REGRA DE TRÊS NO "PAÍS DAS LETRAS"-Revisada
SEXTA SÉRIE_REGRA DE TRÊS NO "PAÍS DAS LETRAS"-Revisada
 
El buena medicina
El buena medicinaEl buena medicina
El buena medicina
 
DivulgaçãO Do Curso
DivulgaçãO Do CursoDivulgaçãO Do Curso
DivulgaçãO Do Curso
 
Sistema Local
Sistema LocalSistema Local
Sistema Local
 
One Size Fits All
One Size Fits AllOne Size Fits All
One Size Fits All
 

Similaire à Montana's Trading Relationship Through the Ports-to-Plains Region -- 2004-2010

South Dakota Trade Relationships 2004-2011
South Dakota Trade Relationships 2004-2011South Dakota Trade Relationships 2004-2011
South Dakota Trade Relationships 2004-2011Ports-To-Plains Blog
 
Montana Trading Relationship 2004-2011
Montana Trading Relationship 2004-2011Montana Trading Relationship 2004-2011
Montana Trading Relationship 2004-2011Ports-To-Plains Blog
 
Colorado Trade Relationships 2004-2011
Colorado Trade Relationships 2004-2011Colorado Trade Relationships 2004-2011
Colorado Trade Relationships 2004-2011Ports-To-Plains Blog
 
North Dakota Trade Relationships 2004-2011
North Dakota Trade Relationships 2004-2011North Dakota Trade Relationships 2004-2011
North Dakota Trade Relationships 2004-2011Ports-To-Plains Blog
 
Nebraska Trade Relationships 2004 – 2011
Nebraska Trade Relationships 2004 – 2011Nebraska Trade Relationships 2004 – 2011
Nebraska Trade Relationships 2004 – 2011Ports-To-Plains Blog
 
Ports-to-Plains Alliance Trade Summary 2004-2011
Ports-to-Plains Alliance Trade Summary 2004-2011Ports-to-Plains Alliance Trade Summary 2004-2011
Ports-to-Plains Alliance Trade Summary 2004-2011Ports-To-Plains Blog
 
Oklahoma Trade Relationships 2004-2011
Oklahoma Trade Relationships 2004-2011Oklahoma Trade Relationships 2004-2011
Oklahoma Trade Relationships 2004-2011Ports-To-Plains Blog
 
Naa Annual Newspaper Ad Expenditures 09
Naa Annual Newspaper Ad Expenditures 09Naa Annual Newspaper Ad Expenditures 09
Naa Annual Newspaper Ad Expenditures 09Juan Varela
 
The 99% Tax Plan Taxation Schedules
The 99% Tax Plan Taxation SchedulesThe 99% Tax Plan Taxation Schedules
The 99% Tax Plan Taxation Schedulesdarrick72
 
Caída Publicidad EEUU 2009
Caída Publicidad EEUU 2009Caída Publicidad EEUU 2009
Caída Publicidad EEUU 2009Juan Varela
 
June Market Report 2014
June Market Report 2014June Market Report 2014
June Market Report 2014Michelle Makos
 
JLL Great Lakes Scorecard
JLL Great Lakes ScorecardJLL Great Lakes Scorecard
JLL Great Lakes ScorecardAndrew Batson
 
TREB January 2017 Market Watch
TREB January 2017 Market WatchTREB January 2017 Market Watch
TREB January 2017 Market WatchMichelle Makos
 
Toronto Real Estate Board's MARKET WATCH - JANUARY 2017
Toronto Real Estate Board's MARKET WATCH - JANUARY 2017Toronto Real Estate Board's MARKET WATCH - JANUARY 2017
Toronto Real Estate Board's MARKET WATCH - JANUARY 2017Shawn Venasse
 
Toronto Real Estate Board's MARKET WATCH - JANUARY 2017
Toronto Real Estate Board's MARKET WATCH - JANUARY 2017Toronto Real Estate Board's MARKET WATCH - JANUARY 2017
Toronto Real Estate Board's MARKET WATCH - JANUARY 2017Shawn Venasse
 
September 2021 Market Watch Report
September 2021 Market Watch ReportSeptember 2021 Market Watch Report
September 2021 Market Watch ReportMichelle Makos
 
THE TORONTO REAL ESTATE BOARD'S MAY 2018 MARKET SALES STATISTICS WITH MEDIA R...
THE TORONTO REAL ESTATE BOARD'S MAY 2018 MARKET SALES STATISTICS WITH MEDIA R...THE TORONTO REAL ESTATE BOARD'S MAY 2018 MARKET SALES STATISTICS WITH MEDIA R...
THE TORONTO REAL ESTATE BOARD'S MAY 2018 MARKET SALES STATISTICS WITH MEDIA R...Shawn Venasse
 
Market watch jul 2019 frank yu oakville
Market watch jul 2019 frank yu oakvilleMarket watch jul 2019 frank yu oakville
Market watch jul 2019 frank yu oakvilleFrank Yu
 

Similaire à Montana's Trading Relationship Through the Ports-to-Plains Region -- 2004-2010 (20)

South Dakota Trade Relationships 2004-2011
South Dakota Trade Relationships 2004-2011South Dakota Trade Relationships 2004-2011
South Dakota Trade Relationships 2004-2011
 
Montana Trading Relationship 2004-2011
Montana Trading Relationship 2004-2011Montana Trading Relationship 2004-2011
Montana Trading Relationship 2004-2011
 
Colorado Trade Relationships 2004-2011
Colorado Trade Relationships 2004-2011Colorado Trade Relationships 2004-2011
Colorado Trade Relationships 2004-2011
 
North Dakota Trade Relationships 2004-2011
North Dakota Trade Relationships 2004-2011North Dakota Trade Relationships 2004-2011
North Dakota Trade Relationships 2004-2011
 
Nebraska Trade Relationships 2004 – 2011
Nebraska Trade Relationships 2004 – 2011Nebraska Trade Relationships 2004 – 2011
Nebraska Trade Relationships 2004 – 2011
 
Ports-to-Plains Alliance Trade Summary 2004-2011
Ports-to-Plains Alliance Trade Summary 2004-2011Ports-to-Plains Alliance Trade Summary 2004-2011
Ports-to-Plains Alliance Trade Summary 2004-2011
 
Oklahoma Trade Relationships 2004-2011
Oklahoma Trade Relationships 2004-2011Oklahoma Trade Relationships 2004-2011
Oklahoma Trade Relationships 2004-2011
 
Naa Annual Newspaper Ad Expenditures 09
Naa Annual Newspaper Ad Expenditures 09Naa Annual Newspaper Ad Expenditures 09
Naa Annual Newspaper Ad Expenditures 09
 
The 99% Tax Plan Taxation Schedules
The 99% Tax Plan Taxation SchedulesThe 99% Tax Plan Taxation Schedules
The 99% Tax Plan Taxation Schedules
 
Caída Publicidad EEUU 2009
Caída Publicidad EEUU 2009Caída Publicidad EEUU 2009
Caída Publicidad EEUU 2009
 
June Market Report 2014
June Market Report 2014June Market Report 2014
June Market Report 2014
 
May Market Watch 2021
May Market Watch 2021May Market Watch 2021
May Market Watch 2021
 
JLL Great Lakes Scorecard
JLL Great Lakes ScorecardJLL Great Lakes Scorecard
JLL Great Lakes Scorecard
 
TREB January 2017 Market Watch
TREB January 2017 Market WatchTREB January 2017 Market Watch
TREB January 2017 Market Watch
 
Toronto Real Estate Board's MARKET WATCH - JANUARY 2017
Toronto Real Estate Board's MARKET WATCH - JANUARY 2017Toronto Real Estate Board's MARKET WATCH - JANUARY 2017
Toronto Real Estate Board's MARKET WATCH - JANUARY 2017
 
Toronto Real Estate Board's MARKET WATCH - JANUARY 2017
Toronto Real Estate Board's MARKET WATCH - JANUARY 2017Toronto Real Estate Board's MARKET WATCH - JANUARY 2017
Toronto Real Estate Board's MARKET WATCH - JANUARY 2017
 
September 2021 Market Watch Report
September 2021 Market Watch ReportSeptember 2021 Market Watch Report
September 2021 Market Watch Report
 
THE TORONTO REAL ESTATE BOARD'S MAY 2018 MARKET SALES STATISTICS WITH MEDIA R...
THE TORONTO REAL ESTATE BOARD'S MAY 2018 MARKET SALES STATISTICS WITH MEDIA R...THE TORONTO REAL ESTATE BOARD'S MAY 2018 MARKET SALES STATISTICS WITH MEDIA R...
THE TORONTO REAL ESTATE BOARD'S MAY 2018 MARKET SALES STATISTICS WITH MEDIA R...
 
CNR_DCF(USD)
CNR_DCF(USD)CNR_DCF(USD)
CNR_DCF(USD)
 
Market watch jul 2019 frank yu oakville
Market watch jul 2019 frank yu oakvilleMarket watch jul 2019 frank yu oakville
Market watch jul 2019 frank yu oakville
 

Plus de Ports-To-Plains Blog

2013 Ports-to-Plains Alliance Energy Conference Handouts
2013 Ports-to-Plains Alliance Energy Conference Handouts2013 Ports-to-Plains Alliance Energy Conference Handouts
2013 Ports-to-Plains Alliance Energy Conference HandoutsPorts-To-Plains Blog
 
Energy Development Impact on Transportation Infrastructure
Energy Development Impact on Transportation InfrastructureEnergy Development Impact on Transportation Infrastructure
Energy Development Impact on Transportation InfrastructurePorts-To-Plains Blog
 
Wind Energy's Future and the Impact on U.S. Manufacturing
Wind Energy's Future and the Impact on U.S. ManufacturingWind Energy's Future and the Impact on U.S. Manufacturing
Wind Energy's Future and the Impact on U.S. ManufacturingPorts-To-Plains Blog
 
Compressed Air Wind Energy Storage
Compressed Air Wind Energy StorageCompressed Air Wind Energy Storage
Compressed Air Wind Energy StoragePorts-To-Plains Blog
 
Fuels Policy, Ethanol and RFS Reform Political and Policy Implications on Gas...
Fuels Policy, Ethanol and RFS Reform Political and Policy Implications on Gas...Fuels Policy, Ethanol and RFS Reform Political and Policy Implications on Gas...
Fuels Policy, Ethanol and RFS Reform Political and Policy Implications on Gas...Ports-To-Plains Blog
 
Ports-to-Plains Letter Submitted to Department of State
Ports-to-Plains Letter Submitted to Department of StatePorts-to-Plains Letter Submitted to Department of State
Ports-to-Plains Letter Submitted to Department of StatePorts-To-Plains Blog
 
News Release Keystone XL Supporting SEIS Finding 041813
News Release Keystone XL Supporting SEIS Finding 041813News Release Keystone XL Supporting SEIS Finding 041813
News Release Keystone XL Supporting SEIS Finding 041813Ports-To-Plains Blog
 
Ports-to-Plains: The Importance of a Statewide Transportation to Colorado's E...
Ports-to-Plains: The Importance of a Statewide Transportation to Colorado's E...Ports-to-Plains: The Importance of a Statewide Transportation to Colorado's E...
Ports-to-Plains: The Importance of a Statewide Transportation to Colorado's E...Ports-To-Plains Blog
 
2013 Energy Conference Save the Date
2013 Energy Conference Save the Date2013 Energy Conference Save the Date
2013 Energy Conference Save the DatePorts-To-Plains Blog
 
February 2013 Update from the Ports-to-Plains Alliance
February 2013 Update from the Ports-to-Plains AllianceFebruary 2013 Update from the Ports-to-Plains Alliance
February 2013 Update from the Ports-to-Plains AlliancePorts-To-Plains Blog
 
Draft Supplemental EIS for the Keystone XL Project
Draft Supplemental EIS for the Keystone XL ProjectDraft Supplemental EIS for the Keystone XL Project
Draft Supplemental EIS for the Keystone XL ProjectPorts-To-Plains Blog
 
PTP supports Heineman Keystone XL Pipeline Decision
PTP supports Heineman Keystone XL Pipeline DecisionPTP supports Heineman Keystone XL Pipeline Decision
PTP supports Heineman Keystone XL Pipeline DecisionPorts-To-Plains Blog
 
News Release PTP Keystone XL Nebraska
News Release PTP Keystone XL NebraskaNews Release PTP Keystone XL Nebraska
News Release PTP Keystone XL NebraskaPorts-To-Plains Blog
 
Ports-to-Plains Alliance Webinar 113012
Ports-to-Plains Alliance Webinar 113012Ports-to-Plains Alliance Webinar 113012
Ports-to-Plains Alliance Webinar 113012Ports-To-Plains Blog
 
Comments on Interim Guidance on State Freight Plans and State Advisory Commit...
Comments on Interim Guidance on State Freight Plans and State Advisory Commit...Comments on Interim Guidance on State Freight Plans and State Advisory Commit...
Comments on Interim Guidance on State Freight Plans and State Advisory Commit...Ports-To-Plains Blog
 
Interim Guidance on State Freight Plans and State Freight Advisory Committees
Interim Guidance on State Freight Plans and State Freight Advisory CommitteesInterim Guidance on State Freight Plans and State Freight Advisory Committees
Interim Guidance on State Freight Plans and State Freight Advisory CommitteesPorts-To-Plains Blog
 
Ports-to-Plains Alliance Northern Working Group Strategic Plan October 2012
Ports-to-Plains Alliance Northern Working Group Strategic Plan October 2012Ports-to-Plains Alliance Northern Working Group Strategic Plan October 2012
Ports-to-Plains Alliance Northern Working Group Strategic Plan October 2012Ports-To-Plains Blog
 

Plus de Ports-To-Plains Blog (20)

Canada and U.S. Trade Overview
Canada and U.S. Trade Overview Canada and U.S. Trade Overview
Canada and U.S. Trade Overview
 
2013 Ports-to-Plains Alliance Energy Conference Handouts
2013 Ports-to-Plains Alliance Energy Conference Handouts2013 Ports-to-Plains Alliance Energy Conference Handouts
2013 Ports-to-Plains Alliance Energy Conference Handouts
 
Energy Development Impact on Transportation Infrastructure
Energy Development Impact on Transportation InfrastructureEnergy Development Impact on Transportation Infrastructure
Energy Development Impact on Transportation Infrastructure
 
Wind Energy's Future and the Impact on U.S. Manufacturing
Wind Energy's Future and the Impact on U.S. ManufacturingWind Energy's Future and the Impact on U.S. Manufacturing
Wind Energy's Future and the Impact on U.S. Manufacturing
 
Compressed Air Wind Energy Storage
Compressed Air Wind Energy StorageCompressed Air Wind Energy Storage
Compressed Air Wind Energy Storage
 
Fuels Policy, Ethanol and RFS Reform Political and Policy Implications on Gas...
Fuels Policy, Ethanol and RFS Reform Political and Policy Implications on Gas...Fuels Policy, Ethanol and RFS Reform Political and Policy Implications on Gas...
Fuels Policy, Ethanol and RFS Reform Political and Policy Implications on Gas...
 
Ports-to-Plains Letter Submitted to Department of State
Ports-to-Plains Letter Submitted to Department of StatePorts-to-Plains Letter Submitted to Department of State
Ports-to-Plains Letter Submitted to Department of State
 
News Release Keystone XL Supporting SEIS Finding 041813
News Release Keystone XL Supporting SEIS Finding 041813News Release Keystone XL Supporting SEIS Finding 041813
News Release Keystone XL Supporting SEIS Finding 041813
 
Ports-to-Plains: The Importance of a Statewide Transportation to Colorado's E...
Ports-to-Plains: The Importance of a Statewide Transportation to Colorado's E...Ports-to-Plains: The Importance of a Statewide Transportation to Colorado's E...
Ports-to-Plains: The Importance of a Statewide Transportation to Colorado's E...
 
2013 Energy Conference Save the Date
2013 Energy Conference Save the Date2013 Energy Conference Save the Date
2013 Energy Conference Save the Date
 
February 2013 Update from the Ports-to-Plains Alliance
February 2013 Update from the Ports-to-Plains AllianceFebruary 2013 Update from the Ports-to-Plains Alliance
February 2013 Update from the Ports-to-Plains Alliance
 
Draft Supplemental EIS for the Keystone XL Project
Draft Supplemental EIS for the Keystone XL ProjectDraft Supplemental EIS for the Keystone XL Project
Draft Supplemental EIS for the Keystone XL Project
 
PTP supports Heineman Keystone XL Pipeline Decision
PTP supports Heineman Keystone XL Pipeline DecisionPTP supports Heineman Keystone XL Pipeline Decision
PTP supports Heineman Keystone XL Pipeline Decision
 
Keystone XL Letter Dec 2012 NEDEQ
Keystone XL Letter Dec 2012 NEDEQKeystone XL Letter Dec 2012 NEDEQ
Keystone XL Letter Dec 2012 NEDEQ
 
News Release PTP Keystone XL Nebraska
News Release PTP Keystone XL NebraskaNews Release PTP Keystone XL Nebraska
News Release PTP Keystone XL Nebraska
 
Ports-to-Plains Alliance Webinar 113012
Ports-to-Plains Alliance Webinar 113012Ports-to-Plains Alliance Webinar 113012
Ports-to-Plains Alliance Webinar 113012
 
Comments on Interim Guidance on State Freight Plans and State Advisory Commit...
Comments on Interim Guidance on State Freight Plans and State Advisory Commit...Comments on Interim Guidance on State Freight Plans and State Advisory Commit...
Comments on Interim Guidance on State Freight Plans and State Advisory Commit...
 
Interim Guidance on State Freight Plans and State Freight Advisory Committees
Interim Guidance on State Freight Plans and State Freight Advisory CommitteesInterim Guidance on State Freight Plans and State Freight Advisory Committees
Interim Guidance on State Freight Plans and State Freight Advisory Committees
 
Ports-to-Plains Alliance Northern Working Group Strategic Plan October 2012
Ports-to-Plains Alliance Northern Working Group Strategic Plan October 2012Ports-to-Plains Alliance Northern Working Group Strategic Plan October 2012
Ports-to-Plains Alliance Northern Working Group Strategic Plan October 2012
 
Return to Rural
Return to RuralReturn to Rural
Return to Rural
 

Dernier

Genesis 1:6 || Meditate the Scripture daily verse by verse
Genesis 1:6  ||  Meditate the Scripture daily verse by verseGenesis 1:6  ||  Meditate the Scripture daily verse by verse
Genesis 1:6 || Meditate the Scripture daily verse by versemaricelcanoynuay
 
char Dham yatra, Uttarakhand tourism.pptx
char Dham yatra, Uttarakhand tourism.pptxchar Dham yatra, Uttarakhand tourism.pptx
char Dham yatra, Uttarakhand tourism.pptxpalakdigital7
 
9 Days Kenya Ultimate Safari Odyssey with Kibera Holiday Safaris
9 Days Kenya Ultimate Safari Odyssey with Kibera Holiday Safaris9 Days Kenya Ultimate Safari Odyssey with Kibera Holiday Safaris
9 Days Kenya Ultimate Safari Odyssey with Kibera Holiday SafarisKibera Holiday Safaris Safaris
 
Top 10 Traditional Indian Handicrafts.pptx
Top 10 Traditional Indian Handicrafts.pptxTop 10 Traditional Indian Handicrafts.pptx
Top 10 Traditional Indian Handicrafts.pptxdishha99
 
Night 7k Call Girls Noida Sector 93 Escorts Call Me: 8448380779
Night 7k Call Girls Noida Sector 93 Escorts Call Me: 8448380779Night 7k Call Girls Noida Sector 93 Escorts Call Me: 8448380779
Night 7k Call Girls Noida Sector 93 Escorts Call Me: 8448380779Delhi Call girls
 
Hire 💕 8617697112 Champawat Call Girls Service Call Girls Agency
Hire 💕 8617697112 Champawat Call Girls Service Call Girls AgencyHire 💕 8617697112 Champawat Call Girls Service Call Girls Agency
Hire 💕 8617697112 Champawat Call Girls Service Call Girls AgencyNitya salvi
 
08448380779 Call Girls In Chhattarpur Women Seeking Men
08448380779 Call Girls In Chhattarpur Women Seeking Men08448380779 Call Girls In Chhattarpur Women Seeking Men
08448380779 Call Girls In Chhattarpur Women Seeking MenDelhi Call girls
 
visa consultant | 📞📞 03094429236 || Best Study Visa Consultant
visa consultant | 📞📞 03094429236 || Best Study Visa Consultantvisa consultant | 📞📞 03094429236 || Best Study Visa Consultant
visa consultant | 📞📞 03094429236 || Best Study Visa ConsultantSherazi Tours
 
best weekend places near delhi where you should visit.pdf
best weekend places near delhi where you should visit.pdfbest weekend places near delhi where you should visit.pdf
best weekend places near delhi where you should visit.pdftour guide
 
08448380779 Call Girls In Bhikaji Cama Palace Women Seeking Men
08448380779 Call Girls In Bhikaji Cama Palace Women Seeking Men08448380779 Call Girls In Bhikaji Cama Palace Women Seeking Men
08448380779 Call Girls In Bhikaji Cama Palace Women Seeking MenDelhi Call girls
 
Visa Consultant in Lahore || 📞03094429236
Visa Consultant in Lahore || 📞03094429236Visa Consultant in Lahore || 📞03094429236
Visa Consultant in Lahore || 📞03094429236Sherazi Tours
 
🔥HOT🔥📲9602870969🔥Prostitute Service in Udaipur Call Girls in City Palace Lake...
🔥HOT🔥📲9602870969🔥Prostitute Service in Udaipur Call Girls in City Palace Lake...🔥HOT🔥📲9602870969🔥Prostitute Service in Udaipur Call Girls in City Palace Lake...
🔥HOT🔥📲9602870969🔥Prostitute Service in Udaipur Call Girls in City Palace Lake...Apsara Of India
 
DARK TRAVEL AGENCY presented by Khuda Bux
DARK TRAVEL AGENCY presented by Khuda BuxDARK TRAVEL AGENCY presented by Khuda Bux
DARK TRAVEL AGENCY presented by Khuda BuxBeEducate
 
💕📲09602870969💓Girl Escort Services Udaipur Call Girls in Chittorgarh Haldighati
💕📲09602870969💓Girl Escort Services Udaipur Call Girls in Chittorgarh Haldighati💕📲09602870969💓Girl Escort Services Udaipur Call Girls in Chittorgarh Haldighati
💕📲09602870969💓Girl Escort Services Udaipur Call Girls in Chittorgarh HaldighatiApsara Of India
 
08448380779 Call Girls In Chirag Enclave Women Seeking Men
08448380779 Call Girls In Chirag Enclave Women Seeking Men08448380779 Call Girls In Chirag Enclave Women Seeking Men
08448380779 Call Girls In Chirag Enclave Women Seeking MenDelhi Call girls
 

Dernier (20)

Call Girls In Munirka 📱 9999965857 🤩 Delhi 🫦 HOT AND SEXY VVIP 🍎 SERVICE
Call Girls In Munirka 📱  9999965857  🤩 Delhi 🫦 HOT AND SEXY VVIP 🍎 SERVICECall Girls In Munirka 📱  9999965857  🤩 Delhi 🫦 HOT AND SEXY VVIP 🍎 SERVICE
Call Girls In Munirka 📱 9999965857 🤩 Delhi 🫦 HOT AND SEXY VVIP 🍎 SERVICE
 
Genesis 1:6 || Meditate the Scripture daily verse by verse
Genesis 1:6  ||  Meditate the Scripture daily verse by verseGenesis 1:6  ||  Meditate the Scripture daily verse by verse
Genesis 1:6 || Meditate the Scripture daily verse by verse
 
char Dham yatra, Uttarakhand tourism.pptx
char Dham yatra, Uttarakhand tourism.pptxchar Dham yatra, Uttarakhand tourism.pptx
char Dham yatra, Uttarakhand tourism.pptx
 
Rohini Sector 18 Call Girls Delhi 9999965857 @Sabina Saikh No Advance
Rohini Sector 18 Call Girls Delhi 9999965857 @Sabina Saikh No AdvanceRohini Sector 18 Call Girls Delhi 9999965857 @Sabina Saikh No Advance
Rohini Sector 18 Call Girls Delhi 9999965857 @Sabina Saikh No Advance
 
9 Days Kenya Ultimate Safari Odyssey with Kibera Holiday Safaris
9 Days Kenya Ultimate Safari Odyssey with Kibera Holiday Safaris9 Days Kenya Ultimate Safari Odyssey with Kibera Holiday Safaris
9 Days Kenya Ultimate Safari Odyssey with Kibera Holiday Safaris
 
Call Girls Service !! Indirapuram!! @9999965857 Delhi 🫦 No Advance VVVIP 🍎 S...
Call Girls Service !! Indirapuram!! @9999965857 Delhi 🫦 No Advance  VVVIP 🍎 S...Call Girls Service !! Indirapuram!! @9999965857 Delhi 🫦 No Advance  VVVIP 🍎 S...
Call Girls Service !! Indirapuram!! @9999965857 Delhi 🫦 No Advance VVVIP 🍎 S...
 
Top 10 Traditional Indian Handicrafts.pptx
Top 10 Traditional Indian Handicrafts.pptxTop 10 Traditional Indian Handicrafts.pptx
Top 10 Traditional Indian Handicrafts.pptx
 
Call Girls Service !! New Friends Colony!! @9999965857 Delhi 🫦 No Advance VV...
Call Girls Service !! New Friends Colony!! @9999965857 Delhi 🫦 No Advance  VV...Call Girls Service !! New Friends Colony!! @9999965857 Delhi 🫦 No Advance  VV...
Call Girls Service !! New Friends Colony!! @9999965857 Delhi 🫦 No Advance VV...
 
Night 7k Call Girls Noida Sector 93 Escorts Call Me: 8448380779
Night 7k Call Girls Noida Sector 93 Escorts Call Me: 8448380779Night 7k Call Girls Noida Sector 93 Escorts Call Me: 8448380779
Night 7k Call Girls Noida Sector 93 Escorts Call Me: 8448380779
 
Call Girls 🫤 Connaught Place ➡️ 9999965857 ➡️ Delhi 🫦 Russian Escorts FULL ...
Call Girls 🫤 Connaught Place ➡️ 9999965857  ➡️ Delhi 🫦  Russian Escorts FULL ...Call Girls 🫤 Connaught Place ➡️ 9999965857  ➡️ Delhi 🫦  Russian Escorts FULL ...
Call Girls 🫤 Connaught Place ➡️ 9999965857 ➡️ Delhi 🫦 Russian Escorts FULL ...
 
Hire 💕 8617697112 Champawat Call Girls Service Call Girls Agency
Hire 💕 8617697112 Champawat Call Girls Service Call Girls AgencyHire 💕 8617697112 Champawat Call Girls Service Call Girls Agency
Hire 💕 8617697112 Champawat Call Girls Service Call Girls Agency
 
08448380779 Call Girls In Chhattarpur Women Seeking Men
08448380779 Call Girls In Chhattarpur Women Seeking Men08448380779 Call Girls In Chhattarpur Women Seeking Men
08448380779 Call Girls In Chhattarpur Women Seeking Men
 
visa consultant | 📞📞 03094429236 || Best Study Visa Consultant
visa consultant | 📞📞 03094429236 || Best Study Visa Consultantvisa consultant | 📞📞 03094429236 || Best Study Visa Consultant
visa consultant | 📞📞 03094429236 || Best Study Visa Consultant
 
best weekend places near delhi where you should visit.pdf
best weekend places near delhi where you should visit.pdfbest weekend places near delhi where you should visit.pdf
best weekend places near delhi where you should visit.pdf
 
08448380779 Call Girls In Bhikaji Cama Palace Women Seeking Men
08448380779 Call Girls In Bhikaji Cama Palace Women Seeking Men08448380779 Call Girls In Bhikaji Cama Palace Women Seeking Men
08448380779 Call Girls In Bhikaji Cama Palace Women Seeking Men
 
Visa Consultant in Lahore || 📞03094429236
Visa Consultant in Lahore || 📞03094429236Visa Consultant in Lahore || 📞03094429236
Visa Consultant in Lahore || 📞03094429236
 
🔥HOT🔥📲9602870969🔥Prostitute Service in Udaipur Call Girls in City Palace Lake...
🔥HOT🔥📲9602870969🔥Prostitute Service in Udaipur Call Girls in City Palace Lake...🔥HOT🔥📲9602870969🔥Prostitute Service in Udaipur Call Girls in City Palace Lake...
🔥HOT🔥📲9602870969🔥Prostitute Service in Udaipur Call Girls in City Palace Lake...
 
DARK TRAVEL AGENCY presented by Khuda Bux
DARK TRAVEL AGENCY presented by Khuda BuxDARK TRAVEL AGENCY presented by Khuda Bux
DARK TRAVEL AGENCY presented by Khuda Bux
 
💕📲09602870969💓Girl Escort Services Udaipur Call Girls in Chittorgarh Haldighati
💕📲09602870969💓Girl Escort Services Udaipur Call Girls in Chittorgarh Haldighati💕📲09602870969💓Girl Escort Services Udaipur Call Girls in Chittorgarh Haldighati
💕📲09602870969💓Girl Escort Services Udaipur Call Girls in Chittorgarh Haldighati
 
08448380779 Call Girls In Chirag Enclave Women Seeking Men
08448380779 Call Girls In Chirag Enclave Women Seeking Men08448380779 Call Girls In Chirag Enclave Women Seeking Men
08448380779 Call Girls In Chirag Enclave Women Seeking Men
 

Montana's Trading Relationship Through the Ports-to-Plains Region -- 2004-2010

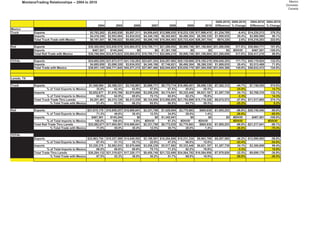
  • 1. MontanaTrading Relationships -- 2004 to 2010 Mexico Domestic Canada 2009-2010 2009-2010 2004-2010 2004-2010 2004 2005 2006 2007 2008 2009 2010 Difference % Change Difference % Change Mexico Truck Exports $3,763,202 $3,842,938 $5,857,311 $4,956,643 $12,998,930 $19,233,120 $17,998,415 -$1,234,705 -6.4% $14,235,213 378.3% Imports $4,418,349 $2,953,084 $3,834,932 $4,340,106 $6,365,663 $6,490,304 $8,399,339 $1,909,035 29.4% $3,980,990 90.1% Total Truck Trade with Mexico $8,181,551 $6,796,022 $9,692,243 $9,296,749 $19,364,593 $25,723,424 $26,397,754 $674,330 2.6% $18,216,203 222.6% #DIV/0! Rail Exports $30,302,093 $33,830,579 $35,884,972 $18,700,711 $21,299,052 $9,906,746 $61,186,804 $51,280,058 517.6% $30,884,711 101.9% Imports $467,501 $145,244 $0 $0 $1,381,158 $0 $0 $0 #DIV/0! -$467,501 -100.0% Total Rail Trade with Mexico $30,769,594 $33,975,823 $35,884,972 $18,700,711 $22,680,210 $9,906,746 $61,186,804 $51,280,058 517.6% $30,417,210 98.9% #DIV/0! TOTAL Exports $34,065,295 $37,673,517 $41,742,283 $23,657,354 $34,297,982 $29,139,866 $79,185,219 $50,045,353 171.7% $45,119,924 132.5% Imports $4,885,850 $3,098,328 $3,834,932 $4,340,106 $7,746,821 $6,490,304 $8,399,339 $1,909,035 29.4% $3,513,489 71.9% Total Trade with Mexico $38,951,145 $40,771,845 $45,577,215 $27,997,460 $42,044,803 $35,630,170 $87,584,558 $51,954,388 145.8% $48,633,413 124.9% Laredo, TX Truck Exports $1,348,584 $2,398,331 $3,742,861 $2,866,711 $8,775,714 $16,460,451 $9,098,139 -$7,362,312 -44.7% $7,749,555 574.6% % of Total Exports to Mexico 35.8% 62.4% 63.9% 57.8% 67.5% 85.6% 50.5% -35.0% 14.7% Imports $2,852,877 $1,916,789 $2,670,669 $3,258,239 $4,174,941 $5,333,448 $6,621,187 $1,287,739 24.1% $3,768,310 132.1% % of Total Imports to Mexico 64.6% 64.9% 69.6% 75.1% 65.6% 82.2% 78.8% -3.3% 14.3% Total Truck Trade Thru Laredo $4,201,461 $4,315,120 $6,413,530 $6,124,950 $12,950,655 $21,793,899 $15,719,326 -$6,074,573 -27.9% $11,517,865 274.1% % Total Trade with Mexico 51.4% 63.5% 66.2% 65.9% 66.9% 84.7% 59.5% -25.2% 8.2% Rail Exports $21,615,170 $16,859,257 $10,906,641 $2,331,790 $7,429,094 $2,770,883 $865,630 -$1,905,253 -68.8% -$20,749,540 -96.0% % of Total Exports to Mexico 71.3% 49.8% 30.4% 12.5% 34.9% 28.0% 1.4% -26.6% -69.9% Imports $467,501 $145,244 $0 $0 $1,342,941 $0 $0 $0 #DIV/0! -$467,501 -100.0% % of Total Imports to Mexico 100.0% 100.0% 0.0% #DIV/0! 97.2% #DIV/0! #DIV/0! #DIV/0! #DIV/0! Total Rail Trade Thru Laredo $22,082,671 $17,004,501 $10,906,641 $2,331,790 $8,772,035 $2,770,883 $865,630 -$1,905,253 -68.8% -$21,217,041 -96.1% % Total Trade with Mexico 71.8% 50.0% 30.4% 12.5% 38.7% 28.0% 1.4% -26.6% -70.4% TOTAL Exports $22,963,754 $19,257,588 $14,649,502 $5,198,501 $16,204,808 $19,231,334 $9,963,769 -$9,267,565 -48.2% -$12,999,985 -56.6% % of Total Exports to Mexico 67.4% 51.1% 35.1% 22.0% 47.2% 66.0% 12.6% -53.4% -54.8% Imports $3,320,378 $2,062,033 $2,670,669 $3,258,239 $5,517,882 $5,333,448 $6,621,187 $1,287,739 24.1% $3,300,809 99.4% % of Total Imports to Mexico 68.0% 66.6% 69.6% 75.1% 71.2% 82.2% 78.8% -3.3% 10.9% Total Trade Thru Laredo $26,284,132 $21,319,621 $17,320,171 $8,456,740 $21,722,690 $24,564,782 $16,584,956 -$7,979,826 -32.5% -$9,699,176 -36.9% % Total Trade with Mexico 67.5% 52.3% 38.0% 30.2% 51.7% 68.9% 18.9% -50.0% -48.5%
  • 2. MontanaTrading Relationships -- 2004 to 2010 Mexico Domestic Canada 2009-2010 2009-2010 2004-2010 2004-2010 2004 2005 2006 2007 2008 2009 2010 Difference % Change Difference % Change Eagle Pass, TX Truck Exports $93,372 $307,043 $466,573 $717,614 $1,043,850 $223,878 $701,474 $477,596 213.3% $608,102 651.3% % of Total Exports to Mexico 2.5% 8.0% 8.0% 14.5% 8.0% 1.2% 3.9% 2.7% 1.4% Imports $42,270 $0 $8,266 $8,790 $12,130 $32,000 $13,241 -$18,759 -58.6% -$29,029 -68.7% % of Total Imports to Mexico 1.0% 0.0% 0.2% 0.2% 0.2% 0.5% 0.2% -0.3% -0.8% Total Truck Trade Thru Eagle Pass $135,642 $307,043 $474,839 $726,404 $1,055,980 $255,878 $714,715 $458,837 179.3% $579,073 426.9% % Total Trade with Mexico 1.7% 4.5% 4.9% 7.8% 5.5% 1.0% 2.7% 1.7% 1.0% Rail Exports $1,515,214 $7,079,081 $14,325,730 $13,064,713 $9,570,243 $3,229,867 $17,070,741 $13,840,874 428.5% $15,555,527 1026.6% % of Total Exports to Mexico 5.0% 20.9% 39.9% 69.9% 44.9% 32.6% 27.9% -4.7% 22.9% Imports $0 $0 $0 $0 $0 $0 $0 $0 #DIV/0! $0 #DIV/0! % of Total Imports to Mexico 0.0% 0.0% 0.0% #DIV/0! 0 #DIV/0! #DIV/0! #DIV/0! #DIV/0! Total Rail Trade Thru Eagle Pass $1,515,214 $7,079,081 $14,325,730 $13,064,713 $9,570,243 $3,229,867 $17,070,741 $13,840,874 428.5% $15,555,527 1026.6% % Total Trade with Mexico 4.9% 20.8% 39.9% 69.9% 42.2% 32.6% 27.9% -4.7% 23.0% TOTAL Exports $1,608,586 $7,386,124 $14,792,303 $13,782,327 $10,614,093 $3,453,745 $17,772,215 $14,318,470 414.6% $16,163,629 1004.8% % of Total Exports to Mexico 4.7% 19.6% 35.4% 58.3% 30.9% 11.9% 22.4% 10.6% 17.7% Imports $42,270 $0 $8,266 $8,790 $12,130 $32,000 $13,241 -$18,759 -58.6% -$29,029 -68.7% % of Total Imports to Mexico 0.9% 0.0% 0.2% 0.2% 0.2% 0.5% 0.2% -0.3% -0.7% Total Trade Thru Eagle Pass $1,650,856 $7,386,124 $14,800,569 $13,791,117 $10,626,223 $3,485,745 $17,785,456 $14,299,711 410.2% $16,134,600 977.3% % Total Trade with Mexico 4.2% 18.1% 32.5% 49.3% 25.3% 9.8% 20.3% 10.5% 16.1% Del Rio, TX Truck Exports $0 $0 $0 $0 $3,000 $0 $0 $0 #DIV/0! $0 #DIV/0! % of Total Exports to Mexico 0.0% 0.0% 0.0% 0.0% 0.0% 0.0% 0.0% 0.0% 0.0% Imports $0 $0 $0 $0 $0 $845 $0 -$845 -100.0% $0 #DIV/0! % of Total Imports to Mexico 0.0% 0.0% 0.0% 0.0% 0.0% 0.0% 0.0% 0.0% 0.0% Total Truck Trade Thru Del Rio $0 $0 $0 $0 $3,000 $845 $0 -$845 -100.0% $0 #DIV/0! % Total Trade with Mexico 0.0% 0.0% 0.0% 0.0% 0.0% 0.0% 0.0% 0.0% 0.0% Rail Exports $0 $0 $0 #DIV/0! $0 #DIV/0! % of Total Exports to Mexico 0.0% 0.0% #DIV/0! #DIV/0! #DIV/0! #DIV/0! #DIV/0! #DIV/0! Imports $0 $0 $0 #DIV/0! $0 #DIV/0! % of Total Imports to Mexico 0.0% 0.0% #DIV/0! #DIV/0! #DIV/0! #DIV/0! #DIV/0! #DIV/0! Total Rail Trade Thru Del Rio $0 $0 $0 $0 $0 #DIV/0! $0 #DIV/0! % Total Trade with Mexico 0.0% 0.0% 0.0% 0.0% 0.0% 0.0% 0.0% 0.0% TOTAL Exports $0 $0 $0 $0 $3,000 $0 $0 $0 #DIV/0! $0 #DIV/0! % of Total Exports to Mexico 0.0% 0.0% 0.0% 0.0% 0.1% 0.0% 0.0% 0.0% 0.0% Imports $0 $0 $0 $0 $0 $845 $0 -$845 -100.0% $0 #DIV/0! % of Total Imports to Mexico 0.0% 0.0% 0.0% 0.0% 0.0% 0.0% 0.0% 0.0% 0.0% Total Trade Thru Del Rio $0 $0 $0 $0 $3,000 $845 $0 -$845 -100.0% $0 #DIV/0! % Total Trade with Mexico 0.0% 0.0% 0.0% 0.0% 0.0% 0.0% 0.0% 0.0% 0.0%
  • 3. MontanaTrading Relationships -- 2004 to 2010 Mexico Domestic Canada 2009-2010 2009-2010 2004-2010 2004-2010 2004 2005 2006 2007 2008 2009 2010 Difference % Change Difference % Change GPITC Truck Exports $1,441,956 $2,705,374 $4,209,434 $3,584,325 $9,822,564 $16,684,329 $9,799,613 -$6,884,716 -41.3% $8,357,657 579.6% % of Total Exports to Mexico 38.3% 70.4% 71.9% 72.3% 75.6% 86.7% 54.4% -32.3% 16.1% Imports $2,895,147 $1,916,789 $2,678,935 $3,267,029 $4,187,071 $5,366,293 $6,634,428 $1,268,135 23.6% $3,739,281 129.2% % of Total Imports to Mexico 65.5% 64.9% 69.9% 75.3% 65.8% 82.7% 79.0% -3.7% 13.5% Total Truck Trade Thru GPITC $4,337,103 $4,622,163 $6,888,369 $6,851,354 $14,009,635 $22,050,622 $16,434,041 -$5,616,581 -25.5% $12,096,938 278.9% % Total Trade with Mexico 53.0% 68.0% 71.1% 73.7% 72.3% 85.7% 62.3% -23.5% 9.2% Rail Exports $23,130,384 $23,938,338 $25,232,371 $15,396,503 $16,999,337 $6,000,750 $17,936,371 $11,935,621 198.9% -$5,194,013 -22.5% % of Total Exports to Mexico 76.3% 70.8% 70.3% 82.3% 79.8% 60.6% 29.3% -31.3% -47.0% Imports $467,501 $145,244 $0 $0 $1,342,941 $0 $0 $0 #DIV/0! -$467,501 -100.0% % of Total Imports to Mexico 0.0% 100.0% 0.0% #DIV/0! 97.2% #DIV/0! #DIV/0! #DIV/0! #DIV/0! Total Rail Trade Thru GPITC $23,597,885 $24,083,582 $25,232,371 $15,396,503 $18,342,278 $6,000,750 $17,936,371 $11,935,621 198.9% -$5,661,514 -24.0% % Total Trade with Mexico 76.7% 70.9% 70.3% 82.3% 80.9% 60.6% 29.3% -31.3% -47.4% TOTAL Exports $24,572,340 $26,643,712 $29,441,805 $18,980,828 $26,821,901 $22,685,079 $27,735,984 $5,050,905 22.3% $3,163,644 12.9% % of Total Exports to Mexico 72.1% 70.7% 70.5% 80.2% 78.2% 77.8% 35.0% -42.8% -37.1% Imports $3,362,648 $2,062,033 $2,678,935 $3,267,029 $5,530,012 $5,366,293 $6,634,428 $1,268,135 23.6% $3,271,780 97.3% % of Total Imports to Mexico 68.8% 66.6% 69.9% 75.3% 71.4% 82.7% 79.0% -3.7% 10.2% Total Trade Thru GPITC $27,934,988 $28,705,745 $32,120,740 $22,247,857 $32,351,913 $28,051,372 $34,370,412 $6,319,040 22.5% $6,435,424 23.0% % Total Trade with Mexico 71.7% 70.4% 70.5% 79.5% 76.9% 78.7% 39.2% -39.5% -32.5%
  • 4. MontanaTrading Relationships -- 2004 to 2010 Mexico Domestic Canada Leading Exports from Montana to Mexico (Surface Transportation) 2010 Leading Exports from Montana to Mexico (Surface Transportation) 2010 2010 2010 Rank Export Rank Coahuila Export 1 26 Ores; Slag and Ash $30,754,218 1 10 Cereals $9,403,599 2 10 Cereals $22,332,448 2 27 Mineral Fuels; Oils and Waxes $336,600 3 84 Computer-Related Machinery and Parts $7,690,758 3 84 Computer-Related Machinery and Parts $106,539 4 27 Mineral Fuels; Oils and Waxes $5,055,155 4 25 Salt; Sulfur; Plaster and Cement $91,026 5 44 Wood and Articles $2,494,340 5 86 Locomotives and Traffic Signals $89,450 6 85 Electrical Machinery; Equipment and Parts $1,685,264 6 73 Articles of Iron and Steel $63,000 7 47 Pulp of Wood and Paperboard $1,245,049 7 98 Special Classification Provisions $10,428 8 86 Locomotives and Traffic Signals $1,231,298 8 85 Electrical Machinery; Equipment and Parts $4,515 9 87 Vehicles Other than Railway $1,087,863 9 10 25 Salt; Sulfur; Plaster and Cement $1,043,418 10 2010 Leading Imports to Montana from Mexico (Surface Transportation) 2010 2010 Leading Exports from Montana to Mexico (Surface Transportation) 2010 Rank Import Rank Nuevo Leon Export 1 87 Vehicles Other than Railway $4,883,736 1 44 Wood and Articles $1,724,288 2 85 Electrical Machinery; Equipment and Parts $1,239,605 2 10 Cereals $1,083,637 3 62 Not Knitted or Crocheted Apparel $478,091 3 73 Articles of Iron and Steel $151,341 4 24 Tobacco and Manufactured Tobacco $421,040 4 25 Salt; Sulfur; Plaster and Cement $130,912 5 84 Computer-Related Machinery and Parts $419,102 5 39 Plastics and Articles $64,950 6 98 Special Classification Provisions $254,744 6 4 Dairy Products $60,947 7 94 Furniture; Lamps and Prefabricated Buildings $155,401 7 17 Sugars and Sugar Confectionery $58,141 8 83 Miscellaneous Articles of Base Metals $150,990 8 86 Locomotives and Traffic Signals $55,300 9 73 Articles of Iron and Steel $100,247 9 84 Computer-Related Machinery and Parts $33,165 10 64 Footwear $77,450 10 15 Animal or Vegetable Fats and Oils $31,588 2010 Leading Exports from Montana to Mexico (Surface Transportation) 2010 Rank Tamaulipas Export 1 59 Impregnated Fabrics $66,440 2 84 Computer-Related Machinery and Parts $14,768 3 95 Toys; Games and Sport Equipment $10,800 4 73 Articles of Iron and Steel $8,623 5 87 Vehicles Other than Railway $3,305 6 7 8 9 10
  • 5. MontanaTrading Relationships -- 2004 to 2010 Mexico Domestic Canada Rail Truck Domestic -- Rail Truck Domestic -- 2002 Domestic -- 2007 Change Change 2015 Change Change Exports Rail Truck Exports Rail Truck Exports Rail Truck Colorado 0 46 5% Colorado 0 80 5% 0% 74% Colorado 48 103 6% #DIV/0! 124% Montana Montana Montana Nebraska 11 17 3% Nebraska 14 27 3% 27% 59% Nebraska 11 21 1% -4% 25% New Mexico 0 11 1% New Mexico 67 4% #DIV/0! -100% New Mexico 60 15 3% #DIV/0! 37% North Dakota 0 50 5% North Dakota 73 195 16% #DIV/0! 290% North Dakota 83 247 13% #DIV/0! 395% Oklahoma 15 4 2% Oklahoma 0 0 0% -100% -100% Oklahoma 32 10 2% 115% 142% South Dakota 40 146 18% South Dakota 4 114 7% -90% -22% South Dakota 2 164 7% -94% 12% Texas 206 0 20% Texas 456 44 31% 121% #DIV/0! Texas 377 64 18% 83% #DIV/0! Wyoming 0 460 46% Wyoming 907 55% #DIV/0! 97% Wyoming 15 1,253 51% #DIV/0! 172% Total ($m) 272 734 Total ($m) 614 1,367 126% 86% Total ($m) 630 1,877 100% 131% 156% 1,006 1,981 97% 2,507 149% Imports Rail Truck Imports Rail Truck Imports Rail Truck Colorado 76 462 26% Colorado 0 747 36% -100% 62% Colorado 13 780 30% -83% 69% Montana Montana Montana 170 0.07 Nebraska 0 195 9% Nebraska 0 513 24% #DIV/0! 163% Nebraska 0 98 4% #DIV/0! -50% New Mexico 0 19 1% New Mexico 0 0 0% #DIV/0! -100% New Mexico - 3 0% #DIV/0! -84% North Dakota 0 201 10% North Dakota 0 398 19% #DIV/0! 98% North Dakota 43 411 17% #DIV/0! 105% Oklahoma 0 270 13% Oklahoma 0 513 24% #DIV/0! 90% Oklahoma 6 192 8% #DIV/0! -29% South Dakota 0 108 5% South Dakota 0 191 9% #DIV/0! 77% South Dakota 21 177 8% #DIV/0! 64% Texas 43 677 34% Texas 1,367 65% -100% 102% Texas 19 275 11% -56% -59% Wyoming 0 53 3% Wyoming 91 283 18% #DIV/0! 434% Wyoming 33 362 15% #DIV/0! 583% Total ($m) 119 1,985 Total ($m) 91 4,012 -24% 102% Total ($m) 304 2,299 100% 156% 16% 2,104 4,103 95% 2,603 24% TOTALS Rail Truck TOTALS Rail Truck TOTALS Rail Truck Colorado 76 508 19% Colorado 0 827 27% -100% 63% Colorado 61 883 19% -19% 74% Montana Montana Montana 0 Nebraska 11 212 7% Nebraska 14 540 18% 27% 155% Montana 11 120 3% -3% -44% New Mexico 0 30 1% New Mexico 67 0 2% #DIV/0! -100% Nebraska 60 18 2% #DIV/0! -39% North Dakota 0 251 8% North Dakota 73 593 21% #DIV/0! 136% New Mexico 126 658 16% #DIV/0! 162% Oklahoma 15 274 9% Oklahoma 0 513 16% -100% 87% North Dakota 38 202 5% 155% -26% South Dakota 40 254 9% South Dakota 4 305 10% -90% 20% Oklahoma 23 341 7% -42% 34% Texas 249 677 30% Texas 456 1,411 60% 83% 108% South Dakota 397 339 15% 59% -50% Wyoming 0 513 16% Wyoming 91 1,190 41% #DIV/0! 132% Texas 48 1,615 34% #DIV/0! 215% Total ($m) 391 2,719 Total ($m) 705 5,379 80% 98% Total ($m) 764 4,176 100% #DIV/0! 54% 3,110 6,084 96% 4,940 59%
  • 6. MontanaTrading Relationships -- 2004 to 2010 Mexico Domestic Canada 2009-2010 2009-2010 2004-2010 2004-2010 2004 2005 2006 2007 2008 2009 2010 Difference % Change Difference % Change Canada Truck Exports $165,589,904 $180,877,118 $260,106,701 $318,953,478 $369,833,474 $245,164,585 $297,595,726 $52,431,141 21.4% $132,005,822 79.7% Imports $655,587,959 $643,908,657 $602,009,113 $805,317,832 $839,483,442 $410,307,062 $461,339,622 $51,032,560 12.4% -$194,248,337 -29.6% Total Truck Trade with Canada $821,177,863 $824,785,775 $862,115,814 $1,124,271,310 $1,209,316,916 $655,471,647 $758,935,348 $103,463,701 15.8% -$62,242,515 -7.6% #DIV/0! Rail Exports $125,214,933 $179,005,514 $158,371,199 $251,818,404 $307,198,966 $177,456,112 $162,772,777 -$14,683,335 -8.3% $37,557,844 30.0% Imports $196,484,712 $203,705,262 $186,531,850 $190,313,837 $228,720,769 $104,972,893 $110,824,018 $5,851,125 5.6% -$85,660,694 -43.6% Total Rail Trade with Canada $321,699,645 $382,710,776 $344,903,049 $442,132,241 $535,919,735 $282,429,005 $273,596,795 -$8,832,210 -3.1% -$48,102,850 -15.0% #DIV/0! TOTAL Exports $290,804,837 $359,882,632 $418,477,900 $570,771,882 $677,032,440 $422,620,697 $460,368,503 $37,747,806 8.9% $169,563,666 58.3% Imports $852,072,671 $847,613,919 $788,540,963 $995,631,669 $1,068,204,211 $515,279,955 $572,163,640 $56,883,685 11.0% -$279,909,031 -32.9% Total Trade with Canada $1,142,877,508 $1,207,496,551 $1,207,018,863 $1,566,403,551 $1,745,236,651 $937,900,652 $1,032,532,143 $94,631,491 10.1% -$110,345,365 -9.7% Raymond, MT Truck Exports $17,419,032 $15,729,177 $16,266,332 $15,460,548 $20,835,730 $12,948,504 $15,889,528 $2,941,024 22.7% -$1,529,504 -8.8% % of Total Exports to Canada 10.5% 8.7% 6.3% 4.8% 5.6% 5.3% 5.3% 0.1% -5.2% Imports $88,010,680 $77,981,295 $74,946,233 $66,847,217 $72,245,962 $32,361,277 $39,682,066 $7,320,789 22.6% -$48,328,614 -54.9% % of Total Imports to Canada 13.4% 12.1% 12.4% 8.3% 8.6% 7.9% 8.6% 0.7% -4.8% Total Truck Trade Thru Raymond $105,429,712 $93,710,472 $91,212,565 $82,307,765 $93,081,692 $45,309,781 $55,571,594 $10,261,813 22.6% -$49,858,118 -47.3% % Total Trade with Canada 12.8% 11.4% 10.6% 7.3% 7.7% 6.9% 7.3% 0.4% -5.5% Rail Exports $0 $0 $0 #DIV/0! $0 #DIV/0! % of Total Exports to Canada 0.0% 0.0% 0.0% 0.0% 0.0% 0.0% 0.0% 0.0% 0.0% Imports $0 $0 $0 #DIV/0! $0 #DIV/0! % of Total Imports to Canada 0.0% 0.0% 0.0% 0.0% 0.0% 0.0% 0.0% 0.0% 0.0% Total Truck Trade Thru Raymond $0 $0 $0 $0 $0 $0 $0 #DIV/0! $0 #DIV/0! % Total Trade with Canada 0.0% 0.0% 0.0% 0.0% 0.0% 0.0% 0.0% 0.0% 0.0% TOTAL Exports $17,419,032 $15,729,177 $16,266,332 $15,460,548 $20,835,730 $12,948,504 $15,889,528 $2,941,024 22.7% -$1,529,504 -8.8% % of Total Exports to Canada 6.0% 4.4% 3.9% 2.7% 3.1% 3.1% 3.5% 0.4% -2.5% Imports $88,010,680 $77,981,295 $74,946,233 $66,847,217 $72,245,962 $32,361,277 $39,682,066 $7,320,789 22.6% -$48,328,614 -54.9% % of Total Imports to Canada 10.3% 9.2% 9.5% 6.7% 6.8% 6.3% 6.9% 0.7% -3.4% Total Trade Thru Raymond $105,429,712 $93,710,472 $91,212,565 $82,307,765 $93,081,692 $45,309,781 $55,571,594 $10,261,813 22.6% -$49,858,118 -47.3% % Total Trade with Canada 9.2% 7.8% 7.6% 5.3% 5.3% 4.8% 5.4% 0.6% -3.8%
  • 7. MontanaTrading Relationships -- 2004 to 2010 Mexico Domestic Canada 2009-2010 2009-2010 2004-2010 2004-2010 2004 2005 2006 2007 2008 2009 2010 Difference % Change Difference % Change Sweet Grass, MT Truck Exports $73,604,550 $90,339,751 $139,893,709 $187,682,890 $239,263,950 $135,052,880 $184,930,742 $49,877,862 36.9% $111,326,192 151.2% % of Total Exports to Canada 44.4% 49.9% 53.8% 58.8% 64.7% 55.1% 62.1% 7.1% 17.7% Imports $245,974,813 $271,403,781 $256,431,167 $472,093,151 $440,902,777 $197,393,020 $213,828,200 $16,435,180 8.3% -$32,146,613 -13.1% % of Total Exports to Canada 37.5% 42.1% 42.6% 58.6% 52.5% 48.1% 46.3% -1.8% 8.8% Total Truck Trade Thru Sweetgrass 319,579,363 $361,743,532 $396,324,876 $659,776,041 $680,166,727 $332,445,900 $398,758,942 $66,313,042 19.9% $79,179,579 24.8% % Total Trade with Canada 38.9% 43.9% 46.0% 58.7% 56.2% 50.7% 52.5% 1.8% 13.6% Rail Exports $54,028,154 $57,004,860 $35,683,132 $82,247,290 $146,069,980 $83,706,311 $95,683,332 $11,977,021 14.3% $41,655,178 77.1% % of Total Exports to Canada 43.1% 31.8% 22.5% 32.7% 47.5% 47.2% 58.8% 11.6% 15.6% Imports $149,096,740 $150,464,210 $120,539,726 $131,840,975 $174,647,026 $74,402,611 $71,035,928 -$3,366,683 -4.5% -$78,060,812 -52.4% % of Total Exports to Canada 46.3% 73.9% 64.6% 69.3% 76.4% 70.9% 64.1% -6.8% 17.8% Total Rail Trade Thru Sweet Grass $203,124,894 $207,469,070 $156,222,858 $214,088,265 $320,717,006 $158,108,922 $166,719,260 $8,610,338 5.4% -$36,405,634 -17.9% % Total Trade with Canada 63.1% 54.2% 45.3% 48.4% 59.8% 56.0% 60.9% 5.0% -2.2% TOTAL Exports $127,632,704 $147,344,611 $175,576,841 $269,930,180 $385,333,930 $218,759,191 $280,614,074 $61,854,883 28.3% $152,981,370 119.9% % of Total Exports to Canada 43.9% 40.9% 42.0% 47.3% 56.9% 51.8% 61.0% 9.2% 17.1% Imports $395,071,553 $421,867,991 $376,970,893 $603,934,126 $615,549,803 $271,795,631 $284,864,128 $13,068,497 4.8% -$110,207,425 -27.9% % of Total Imports to Canada 46.4% 49.8% 47.8% 60.7% 57.6% 52.7% 49.8% -3.0% 3.4% Total Trade Thru Sweet Grass $522,704,257 $569,212,602 $552,547,734 $873,864,306 $1,000,883,733 $490,554,822 $565,478,202 $74,923,380 15.3% $42,773,945 8.2% % Total Trade with Canada 45.7% 47.1% 45.8% 55.8% 57.3% 52.3% 54.8% 2.5% 9.0% Portal, ND Truck Exports $17,180,365 $12,990,619 $27,894,913 $24,275,042 $18,675,432 $21,280,029 $22,924,763 $1,644,734 7.7% $5,744,398 33.4% % of Total Exports to Canada 10.4% 7.2% 10.7% 7.6% 5.0% 8.7% 7.7% -1.0% -2.7% Imports $10,959,252 $9,474,699 $10,848,134 $7,771,147 $9,217,533 $10,432,657 $12,862,007 $2,429,350 23.3% $1,902,755 17.4% % of Total Imports to Canada 1.7% 1.5% 0.0% 1.0% 1.1% 2.5% 2.8% 0.2% 1.1% Total Truck Trade Thru Portal $28,139,617 $22,465,318 $38,743,047 $32,046,189 $27,892,965 $31,712,686 $35,786,770 $4,074,084 12.8% $7,647,153 27.2% % Total Trade with Canada 3.4% 2.7% 4.5% 2.9% 2.3% 4.8% 4.7% -0.1% 1.3% Rail Exports $933,241 $981,205 $1,482,302 $2,718,560 $1,181,140 $9,351,440 $13,291,183 $11,808,881 42.1% $12,357,942 1324.2% % of Total Exports to Canada 0.7% 0.5% 0.9% 1.1% 0.4% 5.3% 8.2% 2.9% 7.4% Imports $496,273 $228,896 $153,155 $332,533 $765,475 $347,985 $102,813 -$50,342 -70.5% -$393,460 -79.3% % of Total Imports to Canada 0.3% 0.1% 0.1% 0.2% 0.3% 0.3% 0.1% -0.2% -0.2% Total Rail Trade Thru Portal $1,429,514 $1,210,101 $1,635,457 $3,051,093 $1,946,615 $9,699,425 $13,393,996 $11,758,539 38.1% $11,964,482 837.0% % Total Trade with Canada 0.4% 0.3% 0.5% 0.7% 0.4% 3.4% 4.9% 1.5% 4.5% TOTAL Exports $18,113,606 $13,971,824 $27,894,913 $24,275,042 $18,675,432 $21,280,029 $22,924,763 $1,644,734 7.7% $18,102,340 26.6% % of Total Exports to Canada 6.2% 3.9% 6.7% 4.3% 2.8% 5.0% 5.0% -0.1% -1.2% Imports $11,455,525 $9,703,595 $11,001,289 $8,103,680 $9,983,008 $10,780,642 $12,964,820 $2,184,178 20.3% $1,509,295 13.2% % of Total Imports to Canada 1.3% 1.1% 1.4% 0.5% 0.6% 2.1% 2.3% 0.2% 0.9% Total Trade Thru Portal $29,569,131 $23,675,419 $38,896,202 $32,378,722 $28,658,440 $32,060,671 $35,889,583 $3,828,912 11.9% $19,611,635 21.4% % Total Trade with Canada 2.6% 2.0% 3.2% 2.1% 1.6% 3.4% 3.5% 0.1% 0.9%
  • 8. MontanaTrading Relationships -- 2004 to 2010 Mexico Domestic Canada 2009-2010 2009-2010 2004-2010 2004-2010 2004 2005 2006 2007 2008 2009 2010 Difference % Change Difference % Change Wild Horse 0 Truck Exports $0 $0 $0 $0 $0 $0 $0 $0 #DIV/0! $0 #DIV/0! % of Total Exports to Canada 0.0% 0.0% 0.0% 19.4% 0.0% 0.0% 0.0% 0.0% 0.0% Imports $14,344,808 $48,908,056 $23,835,553 $24,189,788 $59,432,153 $19,691,493 $23,445,137 $3,753,644 19.1% $9,100,329 63.4% % of Total Imports to Canada -7.4% 7.6% 4.0% 19.0% 7.1% 4.8% 5.1% 0.3% 12.5% Total Truck Trade Thru GPITC $14,344,808 $48,908,056 $23,835,553 $24,189,788 $59,432,153 $19,691,493 $23,445,137 $3,753,644 19.1% $9,100,329 63.4% % Total Trade with Canada -23.0% 5.9% 2.8% 19.3% 4.9% 3.0% 3.1% 0.1% 26.1% Rail Exports $0 $0 $0 $0 $0 $0 $0 $0 #DIV/0! $0 #DIV/0! % of Total Exports to Canada 0.0% 0.0% 0.0% 11.0% 0.0% 0.0% 0.0% 0.0% 0.0% Imports $0 $0 $0 $0 $0 $0 $0 $0 #DIV/0! $0 #DIV/0! % of Total Imports to Canada 0.0% 0.0% 0.0% 22.4% 0.0% 0.0% 0.0% 0.0% 0.0% Total Rail Trade Thru GPITC $0 $0 $0 $0 $0 $0 $0 $0 #DIV/0! $0 #DIV/0! % Total Trade with Canada 0.0% 0.0% 0.0% 17.7% 0.0% 0.0% 0.0% 0.0% 0.0% TOTAL Exports $0 $0 $0 $0 $0 $0 $0 $0 #DIV/0! $0 #DIV/0! % of Total Exports to Canada 0.0% 0.0% 0.0% 0.0% 0.0% 0.0% 0.0% 0.0% 0.0% Imports $14,344,808 $48,908,056 $23,835,553 $24,189,788 $59,432,153 $19,691,493 $23,445,137 $3,753,644 19.1% $9,100,329 63.4% % of Total Imports to Canada -5.1% 5.8% 3.0% 2.4% 5.6% 3.8% 4.1% 0.3% 9.2% Total Trade Thru GPITC $14,344,808 $48,908,056 $23,835,553 $24,189,788 $59,432,153 $19,691,493 $23,445,137 $3,753,644 19.1% $9,100,329 63.4% % Total Trade with Canada -13.0% 4.1% 2.0% 1.5% 3.4% 2.1% 2.3% 0.2% 15.3%
  • 9. MontanaTrading Relationships -- 2004 to 2010 Mexico Domestic Canada 2009-2010 2009-2010 2004-2010 2004-2010 2004 2005 2006 2007 2008 2009 2010 Difference % Change Difference % Change GPITC #DIV/0! Truck Exports $108,203,947 $119,059,547 $184,054,954 $227,418,480 $278,775,112 $169,281,413 $223,745,033 $54,463,620 32.2% $115,541,086 106.8% % of Total Exports to Canada 65.3% 65.8% 70.8% 71.3% 75.4% 69.0% 75.2% 6.1% 9.8% Imports $288,697,905 $345,515,713 $307,381,186 $519,514,634 $530,388,193 $240,465,674 $266,024,872 $25,559,198 10.6% -$22,673,033 -7.9% % of Total Imports to Canada 44.0% 53.7% 51.1% 64.5% 63.2% 58.6% 57.7% -0.9% 13.6% Total Truck Trade Thru GPITC $396,901,852 $464,575,260 $491,436,140 $746,933,114 $809,163,305 $409,747,087 $489,769,905 $80,022,818 19.5% $92,868,053 23.4% % Total Trade with Canada 48.3% 56.3% 57.0% 66.4% 66.9% 62.5% 64.5% 2.0% 16.2% Rail Exports $54,961,395 $57,986,065 $37,165,434 $84,965,850 $147,251,120 $93,057,751 $108,974,515 $15,916,764 17.1% $54,013,120 98.3% % of Total Exports to Canada 33.2% 32.1% 14.3% 26.6% 39.8% 38.0% 36.6% -1.3% 3.4% Imports $149,593,013 $150,693,106 $120,692,881 $132,173,508 $175,412,501 $74,750,596 $71,138,741 -$3,611,855 -4.8% -$78,454,272 -52.4% % of Total Imports to Canada 22.8% 23.4% 20.0% 16.4% 20.9% 18.2% 15.4% -2.8% -7.4% Total Rail Trade Thru GPITC $204,554,408 $208,679,171 $157,858,315 $217,139,358 $322,663,621 $167,808,347 $180,113,256 $12,304,909 7.3% -$24,441,152 -11.9% % Total Trade with Canada 24.9% 25.3% 18.3% 19.3% 26.7% 25.6% 23.7% -1.9% -1.2% TOTAL Exports $163,165,342 $177,045,612 $221,220,388 $312,384,330 $426,026,232 $262,339,164 $332,719,548 $70,380,384 26.8% $169,554,206 103.9% % of Total Exports to Canada 56.1% 49.2% 52.9% 54.7% 62.9% 62.1% 72.3% 10.2% 16.2% Imports $438,290,918 $496,208,819 $428,074,067 $651,688,142 $705,800,694 $315,216,270 $337,163,613 $21,947,343 7.0% -$101,127,305 -23.1% % of Total Imports to Canada 51.4% 58.5% 54.3% 65.5% 66.1% 61.2% 58.9% -2.2% 7.5% Total Trade Thru GPITC $601,456,260 $673,254,431 $649,294,455 $964,072,472 $1,131,826,926 $577,555,434 $669,883,161 $92,327,727 16.0% $68,426,901 11.4% % Total Trade with Canada 52.6% 55.8% 53.8% 61.5% 64.9% 61.6% 64.9% 3.3% 12.3%
  • 10. MontanaTrading Relationships -- 2004 to 2010 Mexico Domestic Canada Leading Exports from Montana to Canada (Surface Transportation) 2010 Leading Exports from Montana to Canada (Surface Transportation) 2010 2010 2010 Rank Export Export Alberta Export 1 27 Mineral Fuels; Oils and Waxes $96,375,033 1 87 Vehicles Other than Railway $74,663,972 2 87 Vehicles Other than Railway $89,654,951 2 27 Mineral Fuels; Oils and Waxes $55,768,755 3 88 Aircraft; Spacecraft and Parts $54,030,874 3 25 Salt; Sulfur; Plaster and Cement $37,264,279 4 29 Organic Chemicals $52,178,833 4 29 Organic Chemicals $32,129,156 5 25 Salt; Sulfur; Plaster and Cement $42,308,877 5 84 Computer-Related Machinery and Parts $23,713,149 6 84 Computer-Related Machinery and Parts $42,215,717 6 23 Food Residues and Waste $10,241,699 7 44 Wood and Articles $22,742,241 7 1 Live Animals $9,230,240 8 38 Miscellaneous Chemical Products $14,228,555 8 12 Oil Seeds and Oleaginous Fruits $4,293,333 9 26 Ores; Slag and Ash $10,982,068 9 73 Articles of Iron and Steel $3,971,337 10 23 Food Residues and Waste $10,481,580 10 85 Electrical Machinery; Equipment and Parts $3,344,922 2010 Leading Imports to Montana from Canada (Surface Transportation) 2010 2010 Leading Exports from Montana to Canada (Surface Transportation) 2010 Rank Import Export British Colombia Export 1 27 Mineral Fuels; Oils and Waxes $3,773,944,557 1 44 Wood and Articles $16,024,075 2 31 Fertilizers $127,742,168 2 84 Computer-Related Machinery and Parts $3,318,958 3 44 Wood and Articles $68,557,863 3 87 Vehicles Other than Railway $2,831,822 4 84 Computer-Related Machinery and Parts $61,129,063 4 27 Mineral Fuels; Oils and Waxes $2,516,751 5 73 Articles of Iron and Steel $39,610,755 5 19 Preparations of Cereals and Flour $1,915,114 6 98 Special Classification Provisions $30,838,325 6 68 Stone; Plaster; Cement and Asbestos $1,890,770 7 23 Food Residues and Waste $17,533,756 7 25 Salt; Sulfur; Plaster and Cement $1,421,268 8 12 Oil Seeds and Oleaginous Fruits $14,259,731 8 8 Edible Fruit and Nuts $1,276,167 9 28 Inorganic Chemicals $13,887,582 9 90 Measuring and Testing Instruments $699,664 10 39 Plastics and Articles $12,787,268 10 21 Miscellaneous Edible Preparations $660,866 2010 Leading Exports from Montana to Canada (Surface Transportation) 2010 Export Saskatchewan Export 1 27 Mineral Fuels; Oils and Waxes $28,444,501 2 38 Miscellaneous Chemical Products $9,444,276 3 84 Computer-Related Machinery and Parts $8,353,204 4 29 Organic Chemicals $6,494,946 5 87 Vehicles Other than Railway $5,127,907 6 7 Edible Vegetables and Roots $3,116,217 7 72 Iron and Steel $1,842,316 8 12 Oil Seeds and Oleaginous Fruits $768,694 9 98 Special Classification Provisions $683,655 10 95 Toys; Games and Sport Equipment $666,245