Enjoy Night ≽ 8448380779 ≼ Call Girls In Palam Vihar (Gurgaon)
Vietnam: Market Profile
1. Emerging Markets > Asia > Vietnam
Vietnam: Market Profile
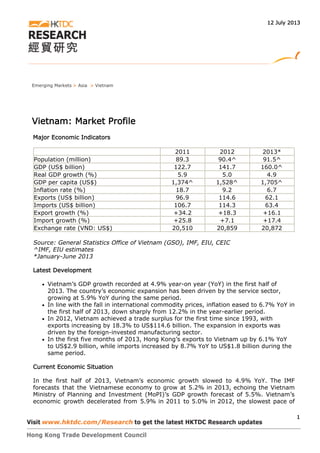
Major Economic Indicators
2011 2012 2013*
Population (million) 89.3 90.4^ 91.5^
GDP (US$ billion) 122.7 141.7 160.0^
Real GDP growth (%) 5.9 5.0 4.9
GDP per capita (US$) 1,374^ 1,528^ 1,705^
Inflation rate (%) 18.7 9.2 6.7
Exports (US$ billion) 96.9 114.6 62.1
Imports (US$ billion) 106.7 114.3 63.4
Export growth (%) +34.2 +18.3 +16.1
Import growth (%) +25.8 +7.1 +17.4
Exchange rate (VND: US$) 20,510 20,859 20,872
Source: General Statistics Office of Vietnam (GSO), IMF, EIU, CEIC
^IMF, EIU estimates
*January-June 2013
Latest Development
Vietnam’s GDP growth recorded at 4.9% year-on year (YoY) in the first half of
2013. The country’s economic expansion has been driven by the service sector,
growing at 5.9% YoY during the same period.
In line with the fall in international commodity prices, inflation eased to 6.7% YoY in
the first half of 2013, down sharply from 12.2% in the year-earlier period.
In 2012, Vietnam achieved a trade surplus for the first time since 1993, with
exports increasing by 18.3% to US$114.6 billion. The expansion in exports was
driven by the foreign-invested manufacturing sector.
In the first five months of 2013, Hong Kong’s exports to Vietnam up by 6.1% YoY
to US$2.9 billion, while imports increased by 8.7% YoY to US$1.8 billion during the
same period.
Current Economic Situation
In the first half of 2013, Vietnam’s economic growth slowed to 4.9% YoY. The IMF
forecasts that the Vietnamese economy to grow at 5.2% in 2013, echoing the Vietnam
Ministry of Planning and Investment (MoPI)’s GDP growth forecast of 5.5%. Vietnam’s
economic growth decelerated from 5.9% in 2011 to 5.0% in 2012, the slowest pace of
12 July 2013
1
2. expansion since 1999. The country’s economic growth in recent years has been mostly
driven by the service sector. In 2012, the agriculture, industry and services sectors
registered respective growth rates of 2.7%, 4.5% and 6.4%.
Vietnam’s inflation rate moderated to 9.2% in 2012, down sharply from 18.7% in 2011.
Inflation further decelerated to 6.7% in June 2013, with annual inflation averaged 6.7%
in the first half of the year. The lower inflation in 2013 reflected the impact of the
government’s effort in credit tightening. Following the subdued GDP growth data and
slower inflation in early 2013, Vietnam is seen as pursuing a slightly more
accommodative monetary policy to support economic growth. The State Bank of Vietnam
(SBV) lowered its benchmark interest rate in May 2013, the second rate cut in 2013 and
the eighth since March 2012.
In February 2013, the master plan on economic restructure 2013-2020 was approved.
The plan focuses on the restructuring of public investment, banks, and state-owned
enterprises (SOEs). Through full or partial privatisation, it is hoped to reduce the number
of SOEs by about half to 690 by 2015, and then to 200 by 2020.
External Trade
There was a prominent change in Vietnam’s external trade in 2012. The country’s
exports surged by 18.3% to US$114.6 billion, while imports grew slower at 7.1%,
leading to a trade surplus of US$ 284 million in 2012, the first since 1993. The growth in
exports continued in the first half of 2013, with exports up 16% YoY.
Exports of electronic items accounted for 18% of total merchandise exports in 2012,
increasing from the 12% share in 2011. In particular, the exports of phones and
components went up by 98%, driven by the foreign-invested manufacturing sector.
Vietnam’s top export markets in 2012 were the US, China, Japan and South Korea.
Major imported items in 2012 consisted of machinery, equipment and parts, electronics
and accessories. A large part of its imported capital goods is related to assembling goods
for export. China is the largest source of Vietnam’s imports, followed by South Korea,
Japan and Singapore.
Foreign Direct Investment (FDI)
Vietnam’s impressive growth of exports was largely driven by FDI. According to the
Ministry of Industry and Trade, the FDI sector accounted for 100% of Vietnam’s exports
of cameras, 98 % of mobile phones and parts, and 97% of computer and parts.
Vietnam attracted 1,110 licensed FDI projects in 2012 with a total registered investment
capital of US$7.85 billion. Japan was Vietnam’s largest FDI source in 2012, with a
registered investment capital of US$4 billion, followed by South Korea, Hong Kong and
Singapore. In the first half of 2013, Vietnam attracted 554 new FDI projects with
registered capital of US$5.8 billion.
Major sources of FDI
2012 Jan-Jun 2013
Country/Region
Registered
capital (US$ Share Country/Region
Registered
capital (US$ mn) Share
Vietnam: Market Profile
2
3. mn)
Japan 4007.4 51% Singapore 2323.0 40%
South Korea 757.1 10% Russia 1015.2 18%
Hong Kong 549.5 7% Japan 956.0 16%
Singapore 488.4 6.2% South Korea 466.8 8%
Others 2051.7 25.8% Others 1051.1 18%
Total 7854.1 100% Total 5812.1 100%
Source: General Statistics Office of Vietnam (GSO)
WTO Accession
Vietnam became a World Trade Organisation (WTO) member in January 2007. While
facing fewer restrictions and lower tariffs in export markets, Vietnamese manufacturers
also benefit from the improving access to imports of cheaper raw materials and semi-
processed inputs as Vietnam's import tariffs drop.
Upon its WTO accession in January 2007, Vietnam was committed to bound tariff rates
on most products ranging from zero to 35%, although tariffs on cars and motorbikes
remain high, with certain sensitive products (such as eggs, tobacco, sugar and salt)
subject to tariff quotas (higher duties for quantities exceeding the quotas).
Among other benefits, WTO accession allows Vietnam to take advantage of the phase-
out of the Agreement on Textiles and Clothing, which eliminated quotas on textiles and
clothing for WTO partners on 1 January 2005.
In January 2009, Vietnam allowed foreign investors to operate 100% foreign-owned
retail business as per its WTO commitments. Previously, foreign companies had to form
joint ventures with local companies if they wanted to enter the retail market.
CAFTA Membership
The China-ASEAN Free Trade Area (CAFTA), formally established in January 2010, is the
world’s largest free trade area by population (1.9 billion), with a combined GDP of more
than US$7.7 trillion and total trade of US$4.8 trillion. Under CAFTA, Vietnam will
eliminate 90% of its tariff lines for goods traded with China by 2015, with the remaining
10%, which cover items on the sensitive list such as textiles, seeing their import tariffs
lowered more slowly.
In 2012, bilateral trade between Vietnam and China reach US$50.5 billion, up 26%
compared with 2011, also significantly higher than US$30.1 billion in 2010.
Hong Kong's Trade with Vietnam
In the first five months of 2013, Vietnam was the 9th largest export market for Hong
Kong. Hong Kong’s total exports to Vietnam grew by 6.1% YoY to US$2.9 billion. Major
export items included telecom equipment & parts (12.3% share), other meat & edible
meat offal (fresh, chilled or frozen) (7.4%), crustaceans, molluscs & aquatic
invertebrates (7.1%).
Hong Kong’s imports from Vietnam gained 8.7% YoY to US$1.8 billion in the same
period. Major import items included telecom equipment & parts (62.9% share), rotating
Vietnam: Market Profile
3