SlideShare une entreprise Scribd logo
1  sur  16
Télécharger pour lire hors ligne
August 2016 Monthly Snapshot
One-Year Change in One-Year Change in
Median Sales Price
Single Family
Median Sales Price
Condo/TIC/Coop
2
3
4
5
6
7
8
9
10
11
12
13
14
15
16
Current as of September 11, 2016. All data from the San Francisco MLS. Report © 2016 ShowingTime.
Condo/TIC/Coop Activity Overview
Inventory of Active Listings
% of Properties Sold Over List Price
% of List Price Received
Housing Affordability Ratio
All Properties Activity Overview
New Listings
Pending Sales
Sold Listings
Median Sales Price
Average Sales Price
Days on Market Until Sale
Activity by District
Monthly Indicators
+ 2.6% + 1.4% - 0.4%
One-Year Change inClosed sales began to cool for much of the country last month, and
conventional wisdom indicates that year-over-year declines are going to be
present for the remainder of the year, given the low inventory situation in most
markets. Demand is certainly present and has created competitive situations
that have kept prices up. Rental prices are also up, which may lure more toward
homeownership.
New Listings were down 26.5 percent for single family homes and 21.7 percent
for Condo/TIC/Coop properties. Pending Sales decreased 6.3 percent for single
family homes and 1.7 percent for Condo/TIC/Coop properties.
The Median Sales Price was up 2.6 percent to $1,257,500 for single family
homes and 1.4 percent to $1,060,000 for Condo/TIC/Coop properties. Months
Supply of Inventory decreased 10.0 percent for single family units but was up
21.1 percent for Condo/TIC/Coop units.
As inventory continues to drop, the contradictions of today's market are
evident. Sellers should feel confident enough to list homes at fair prices and
receive meaningful offers in a healthy residential real estate and overall
economic environment. However, there may be lingering worry over the
availability of move-in ready homes to replace what was sold. On a brighter
note, building permits are trending upward. That news should be weighed
against the fact that the highest level of activity is in multifamily rentals.
Median Sales Price
All Property Types
Residential real estate activity in San Francisco County (Districts 1-10),
comprised of single-family properties, townhomes and condominiums.
Percent changes are calculated using rounded figures.
Single Family Activity Overview
Months Supply of Inventory
Single Family Activity Overview
Key metrics by report month and for year-to-date (YTD) starting from the first of the year.
Key Metrics Historical Sparkbars 8-2015 8-2016 Percent Change YTD 2015 YTD 2016 Percent Change
- 5.6%1,834
1,401 - 6.9%
$1,325,000 + 6.0%
+ 1.2%
Pending Sales 205 192 - 6.3% - 4.8%1,548 1,474
New Listings 234 172 - 26.5% 1,942
Sold Listings 198 186 - 6.1% 1,505
Median Sales Price $1,225,444 $1,257,500 + 2.6% $1,250,000
30 + 11.1%
$1,689,420
-- --
Days on Market 28 33 + 17.9% 27
Avg. Sales Price $1,505,629 $1,546,587 + 2.7% $1,669,439
Active Listings 387 345 - 10.9% --
% of Properties Sold Over List Price 89.4% 76.3% - 14.7% 82.5%
39
76.7% - 7.0%
- 2.9%
40 + 2.6%
112.6%% of List Price Received 117.3% 111.8% - 4.7% 116.0%
Current as of September 11, 2016. All data from the San Francisco MLS. Report © 2016 ShowingTime. | 2
Months Supply 2.0 1.8 - 10.0% -- -- --
Affordability Ratio 39 42 + 7.7%
8-2013 8-2014 8-2015 8-2016
8-2013 8-2014 8-2015 8-2016
8-2013 8-2014 8-2015 8-2016
8-2013 8-2014 8-2015 8-2016
8-2013 8-2014 8-2015 8-2016
8-2013 8-2014 8-2015 8-2016
8-2013 8-2014 8-2015 8-2016
8-2013 8-2014 8-2015 8-2016
8-2013 8-2014 8-2015 8-2016
8-2013 8-2014 8-2015 8-2016
8-2013 8-2014 8-2015 8-2016
Condo/TIC/Coop Activity Overview
Key metrics by report month and for year-to-date (YTD) starting from the first of the year.
Key Metrics Historical Sparkbars 8-2015 8-2016 Percent Change YTD 2015 YTD 2016 Percent Change
+ 5.6%
Pending Sales 231 227 - 1.7% 2,004 1,882 - 6.1%
New Listings 286 224 - 21.7% 2,476 2,615
Sold Listings 229 250 + 9.2% 1,949 1,812 - 7.0%
Median Sales Price $1,045,000 $1,060,000 + 1.4% $1,075,000 $1,099,500 + 2.3%
- 1.0%
37 + 23.3%
$1,240,877
-- --
Days on Market 29 46 + 58.6% 30
Avg. Sales Price $1,159,211 $1,203,455 + 3.8% $1,253,781
Active Listings 484 537 + 11.0% --
% of Properties Sold Over List Price 72.1% 50.0% - 30.7% 71.1%
52
60.3% - 15.2%
- 3.8%
57 + 9.6%
105.1%% of List Price Received 108.7% 103.0% - 5.2% 109.3%
Current as of September 11, 2016. All data from the San Francisco MLS. Report © 2016 ShowingTime. | 3
Months Supply 1.9 2.3 + 21.1% -- -- --
Affordability Ratio 53 59 + 11.3%
8-2013 8-2014 8-2015 8-2016
8-2013 8-2014 8-2015 8-2016
8-2013 8-2014 8-2015 8-2016
8-2013 8-2014 8-2015 8-2016
8-2013 8-2014 8-2015 8-2016
8-2013 8-2014 8-2015 8-2016
8-2013 8-2014 8-2015 8-2016
8-2013 8-2014 8-2015 8-2016
8-2013 8-2014 8-2015 8-2016
8-2013 8-2014 8-2015 8-2016
8-2013 8-2014 8-2015 8-2016
New Listings
New Listings
Single
Family
Year-Over-Year
Change
Condo/TIC/
Coop
Year-Over-Year
Change
Sep-2015 325 -7.1% 438 +12.6%
Oct-2015 263 +5.2% 321 -4.2%
Nov-2015 143 +11.7% 195 +16.8%
Dec-2015 67 -14.1% 120 +9.1%
Jan-2016 180 -9.5% 293 +9.7%
Feb-2016 225 -5.5% 333 +12.5%
Mar-2016 272 +8.4% 377 +13.6%
Apr-2016 281 +12.0% 370 +4.5%
May-2016 253 -2.7% 365 +9.0%
Jun-2016 233 -7.9% 397 +27.2%
Jul-2016 218 -14.8% 256 -12.9%
Aug-2016 172 -26.5% 224 -21.7%
12-Month Avg 219 -4.2% 307 +6.1%
Historical New Listings by Month
Current as of September 11, 2016. All data from the San Francisco MLS. Report © 2016 ShowingTime. | 4
A count of the properties that have been newly listed on the market in a given month.
226
273
234
286
172
224
Single Family Condo/TIC/Coop
August
0
100
200
300
400
500
600
700
1-2005 1-2006 1-2007 1-2008 1-2009 1-2010 1-2011 1-2012 1-2013 1-2014 1-2015 1-2016
Single Family Condo/TIC/Coop
1,918
2,652
1,942
2,476
1,834
2,615
Single Family Condo/TIC/Coop
Year to Date
2014 2015 2016
- 21.7%+ 4.8%- 26.5%+ 3.5% - 6.6%- 5.6%+ 1.3% + 5.6%
2014 2015 2016 2014 2015 2016 2014 2015 2016
- 16.9% - 9.9% - 5.5%- 19.7%
Pending Sales
Pending Sales
Single
Family
Year-Over-Year
Change
Condo/TIC/
Coop
Year-Over-Year
Change
Sep-2015 199 -6.6% 216 -19.4%
Oct-2015 266 -0.4% 283 -6.0%
Nov-2015 175 -16.7% 239 +9.6%
Dec-2015 131 -3.7% 175 -15.9%
Jan-2016 100 -8.3% 143 -4.0%
Feb-2016 124 -10.1% 228 +7.0%
Mar-2016 195 -15.9% 228 -21.6%
Apr-2016 214 -5.3% 245 -12.5%
May-2016 250 +19.6% 285 -2.1%
Jun-2016 230 +4.5% 265 -9.9%
Jul-2016 169 -19.1% 261 +2.4%
Aug-2016 192 -6.3% 227 -1.7%
12-Month Avg 187 -5.4% 233 -6.8%
Historical Pending Sales by Month
Current as of September 11, 2016. All data from the San Francisco MLS. Report © 2016 ShowingTime. | 5
A count of the properties on which offers have been accepted in a given month.
204
266
205
231
192
227
Single Family Condo/TIC/Coop
August
0
100
200
300
400
1-2005 1-2006 1-2007 1-2008 1-2009 1-2010 1-2011 1-2012 1-2013 1-2014 1-2015 1-2016
Single Family Condo/TIC/Coop
1,566
2,165
1,548
2,004
1,474
1,882
Single Family Condo/TIC/Coop
Year to Date
2014 2015 2016
- 1.7%- 13.2%- 6.3%+ 0.5% - 7.4%- 4.8%- 1.1% - 6.1%
2014 2015 2016 2014 2015 2016 2014 2015 2016
- 10.9% - 11.9% - 5.3%- 11.9%
Sold Listings
Sold Listings
Single
Family
Year-Over-Year
Change
Condo/TIC/
Coop
Year-Over-Year
Change
Sep-2015 164 -16.8% 181 -27.0%
Oct-2015 244 -12.2% 266 -16.6%
Nov-2015 188 -6.5% 207 -4.2%
Dec-2015 208 +6.1% 283 +24.7%
Jan-2016 105 -4.5% 149 -5.7%
Feb-2016 102 -20.9% 166 +3.1%
Mar-2016 158 -16.4% 251 -4.9%
Apr-2016 209 -4.6% 221 -23.3%
May-2016 198 -3.4% 258 -9.8%
Jun-2016 245 +11.9% 268 -7.9%
Jul-2016 198 -16.1% 249 -8.5%
Aug-2016 186 -6.1% 250 +9.2%
12-Month Avg 184 -7.2% 229 -7.1%
Historical Sold Listings by Month
Current as of September 11, 2016. All data from the San Francisco MLS. Report © 2016 ShowingTime. | 6
A count of the actual sales that closed in a given month.
211
287
198
229
186
250
Single Family Condo/TIC/Coop
August
0
100
200
300
400
1-2005 1-2006 1-2007 1-2008 1-2009 1-2010 1-2011 1-2012 1-2013 1-2014 1-2015 1-2016
Single Family Condo/TIC/Coop
1,534
2,139
1,505
1,949
1,401
1,812
Single Family Condo/TIC/Coop
Year to Date
2014 2015 2016
+ 9.2%- 20.2%- 6.1%- 6.2% - 8.9%- 6.9%- 1.9% - 7.0%
2014 2015 2016 2014 2015 2016 2014 2015 2016
- 11.3% - 12.8% - 4.4%- 5.3%
Median Sales Price
Median Sales Price
Single
Family
Year-Over-Year
Change
Condo/TIC/
Coop
Year-Over-Year
Change
Sep-2015 $1,155,000 +11.6% $1,040,000 +13.7%
Oct-2015 $1,267,500 +6.5% $1,100,000 +15.2%
Nov-2015 $1,262,500 +12.1% $1,125,000 +10.3%
Dec-2015 $1,201,500 +12.1% $1,098,000 +18.7%
Jan-2016 $1,175,000 +20.5% $1,060,000 +17.8%
Feb-2016 $1,390,000 +24.7% $1,097,500 -0.2%
Mar-2016 $1,352,500 +8.2% $1,095,000 -0.5%
Apr-2016 $1,380,000 +6.2% $1,150,000 +6.7%
May-2016 $1,355,000 -3.2% $1,082,500 -2.7%
Jun-2016 $1,325,000 +1.9% $1,175,000 +6.3%
Jul-2016 $1,335,000 +4.3% $1,045,000 +1.1%
Aug-2016 $1,257,500 +2.6% $1,060,000 +1.4%
12-Month Avg* $1,300,000 +8.3% $1,100,000 +7.7%
Historical Median Sales Price by Month
* Median Sales Price for all properties from September 2015 through August 2016. This is not the
average of the individual figures above.
Current as of September 11, 2016. All data from the San Francisco MLS. Report © 2016 ShowingTime. | 7
Point at which half of the sales sold for more and half sold for less, not accounting for seller concessions, in a given month.
$968,000
$930,000
$1,225,444
$1,045,000
$1,257,500
$1,060,000
Single Family Condo/TIC/Coop
August
$400,000
$600,000
$800,000
$1,000,000
$1,200,000
$1,400,000
$1,600,000
1-2005 1-2006 1-2007 1-2008 1-2009 1-2010 1-2011 1-2012 1-2013 1-2014 1-2015 1-2016
Single Family Condo/TIC/Coop
$1,050,000
$936,500
$1,250,000
$1,075,000
$1,325,000
$1,099,500
Single Family Condo/TIC/Coop
Year to Date
2014 2015 2016
+ 1.4%+ 12.4%+ 2.6%+ 26.6% + 14.8%+ 6.0%+ 19.0% + 2.3%
2014 2015 2016 2014 2015 2016 2014 2015 2016
+ 3.6% + 16.7% + 14.5%+ 14.8%
Average Sales Price
Avg. Sales Price
Single
Family
Year-Over-Year
Change
Condo/TIC/
Coop
Year-Over-Year
Change
Sep-2015 $1,390,736 +5.6% $1,166,494 +14.9%
Oct-2015 $1,624,546 -2.7% $1,184,400 +11.0%
Nov-2015 $1,700,437 +16.4% $1,259,473 +12.3%
Dec-2015 $1,497,221 +11.8% $1,249,856 +9.2%
Jan-2016 $1,573,224 +23.0% $1,169,189 +6.8%
Feb-2016 $1,611,354 +3.9% $1,209,909 +0.5%
Mar-2016 $1,783,317 +2.0% $1,255,510 -3.4%
Apr-2016 $1,767,919 +0.4% $1,371,042 +4.1%
May-2016 $1,643,626 -10.7% $1,269,432 -4.5%
Jun-2016 $1,752,261 -1.4% $1,218,386 -6.3%
Jul-2016 $1,735,682 +4.7% $1,206,330 -0.7%
Aug-2016 $1,546,587 +2.7% $1,203,455 +3.8%
12-Month Avg* $1,642,835 +3.0% $1,232,839 +3.1%
Historical Average Sales Price by Month
* Avg. Sales Price for all properties from September 2015 through August 2016. This is not the
average of the individual figures above.
Current as of September 11, 2016. All data from the San Francisco MLS. Report © 2016 ShowingTime. | 8
Average sales price for all closed sales, not accounting for seller concessions, in a given month.
$1,326,578
$1,092,040
$1,505,629
$1,159,211
$1,546,587
$1,203,455
Single Family Condo/TIC/Coop
August
$600,000
$800,000
$1,000,000
$1,200,000
$1,400,000
$1,600,000
$1,800,000
$2,000,000
1-2005 1-2006 1-2007 1-2008 1-2009 1-2010 1-2011 1-2012 1-2013 1-2014 1-2015 1-2016
Single Family Condo/TIC/Coop
$1,431,035
$1,101,972
$1,669,439
$1,253,781
$1,689,420
$1,240,877
Single Family Condo/TIC/Coop
Year to Date
2014 2015 2016
+ 3.8%+ 6.2%+ 2.7%+ 13.5% + 13.8%+ 1.2%+ 16.7% - 1.0%
2014 2015 2016 2014 2015 2016 2014 2015 2016
+ 1.9% + 12.1% + 16.1%+ 17.5%
Days on Market Until Sale
Days on Market
Single
Family
Year-Over-Year
Change
Condo/TIC/
Coop
Year-Over-Year
Change
Sep-2015 27 +3.8% 34 -8.1%
Oct-2015 27 -10.0% 26 -29.7%
Nov-2015 28 -9.7% 34 -10.5%
Dec-2015 33 -15.4% 43 -8.5%
Jan-2016 40 -7.0% 44 -10.2%
Feb-2016 31 +10.7% 35 +20.7%
Mar-2016 25 +4.2% 30 +7.1%
Apr-2016 32 +39.1% 38 +22.6%
May-2016 24 +4.3% 33 +17.9%
Jun-2016 29 +3.6% 35 +34.6%
Jul-2016 32 +28.0% 39 +34.5%
Aug-2016 33 +17.9% 46 +58.6%
12-Month Avg* 30 +4.5% 36 +9.3%
Historical Days on Market Until Sale by Month
* Days on Market for all properties from September 2015 through August 2016. This is not the
average of the individual figures above.
Current as of September 11, 2016. All data from the San Francisco MLS. Report © 2016 ShowingTime. | 9
Average number of days between when a property is listed and when an offer is accepted in a given month.
27
33
28 29
33
46
Single Family Condo/TIC/Coop
August
20
40
60
80
100
120
1-2005 1-2006 1-2007 1-2008 1-2009 1-2010 1-2011 1-2012 1-2013 1-2014 1-2015 1-2016
Single Family Condo/TIC/Coop
31
34
27
3030
37
Single Family Condo/TIC/Coop
Year to Date
2014 2015 2016
+ 58.6%- 12.1%+ 17.9%+ 3.7% - 11.8%+ 11.1%- 12.9% + 23.3%
2014 2015 2016 2014 2015 2016 2014 2015 2016
- 27.0% - 13.9% - 15.0%- 13.2%
Inventory of Active Listings
Active Listings
Single
Family
Year-Over-Year
Change
Condo/TIC/
Coop
Year-Over-Year
Change
Sep-2015 477 -3.4% 669 +14.4%
Oct-2015 439 +2.1% 648 +14.7%
Nov-2015 361 +12.8% 533 +15.4%
Dec-2015 228 +8.6% 365 +31.8%
Jan-2016 294 +4.3% 485 +28.3%
Feb-2016 378 +4.4% 538 +23.1%
Mar-2016 438 +21.3% 635 +40.5%
Apr-2016 474 +32.0% 699 +41.2%
May-2016 451 +16.2% 711 +41.6%
Jun-2016 417 +6.1% 753 +57.5%
Jul-2016 421 +4.2% 640 +33.3%
Aug-2016 345 -10.9% 537 +11.0%
12-Month Avg* 394 +7.6% 601 +28.9%
Historical Inventory of Active Listings by Month
* Active Listings for all properties from September 2015 through August 2016. This is not the
average of the individual figures above.
Current as of September 11, 2016. All data from the San Francisco MLS. Report © 2016 ShowingTime. | 10
The number of properties available for sale in active status at the end of a given month.
398
522
387
484
345
537
Single Family Condo/TIC/Coop
August
200
400
600
800
1,000
1,200
1,400
1,600
1-2005 1-2006 1-2007 1-2008 1-2009 1-2010 1-2011 1-2012 1-2013 1-2014 1-2015 1-2016
Single Family Condo/TIC/Coop
2014 2015 2016
+ 11.0%- 7.3%- 10.9%- 2.8%
2014 2015 2016
- 14.6% - 11.2%
% of Properties Sold Over List Price
% of Properties
Sold Over List Price
Single
Family
Year-Over-Year
Change
Condo/TIC/
Coop
Year-Over-Year
Change
Sep-2015 88.4% +14.5% 71.8% +8.0%
Oct-2015 83.2% +1.0% 76.3% +10.1%
Nov-2015 77.7% -2.9% 69.6% +3.7%
Dec-2015 79.3% +7.2% 59.4% +7.0%
Jan-2016 76.2% +18.1% 53.0% -8.9%
Feb-2016 77.5% -5.7% 58.4% -11.2%
Mar-2016 82.3% +7.3% 67.7% -1.3%
Apr-2016 75.6% -9.6% 60.6% -14.9%
May-2016 79.8% -4.3% 67.4% -12.0%
Jun-2016 71.8% -16.8% 62.3% -16.5%
Jul-2016 76.8% -8.9% 59.0% -20.2%
Aug-2016 76.3% -14.7% 50.0% -30.7%
12-Month Avg 78.6% -3.0% 63.2% -8.4%
Historical % of Properties Sold Over List Price by Month
* % of Properties Sold Over List Price for all properties from September 2015 through August
2016. This is not the average of the individual figures above.
Current as of September 11, 2016. All data from the San Francisco MLS. Report © 2016 ShowingTime. | 11
Percentage found when dividing the number of properties sold by properties sold over its original list price, not accounting for seller
concessions.
80.6%
69.3%
89.4%
72.1%
76.3%
50.0%
Single Family Condo/TIC/Coop
August
0.0%
20.0%
40.0%
60.0%
80.0%
100.0%
1-2005 1-2006 1-2007 1-2008 1-2009 1-2010 1-2011 1-2012 1-2013 1-2014 1-2015 1-2016
Single Family Condo/TIC/Coop
80.8%
68.8%
82.5%
71.1%
76.7%
60.3%
Single Family Condo/TIC/Coop
Year to Date
2014 2015 2016
- 30.7%+ 4.0%- 14.7%+ 10.9% + 3.3%- 7.0%+ 2.1% - 15.2%
2014 2015 2016 2014 2015 2016 2014 2015 2016
+ 7.2% + 6.2% + 5.7%+ 5.0%
% of List Price Received
% of List Price
Received
Single
Family
Year-Over-Year
Change
Condo/TIC/
Coop
Year-Over-Year
Change
Sep-2015 117.7% +5.5% 108.7% +3.3%
Oct-2015 114.5% +1.3% 109.3% +2.2%
Nov-2015 112.4% +1.0% 107.5% +1.0%
Dec-2015 112.3% +3.0% 104.3% +0.8%
Jan-2016 110.9% +2.8% 103.8% -1.0%
Feb-2016 112.6% -1.7% 106.0% -1.9%
Mar-2016 114.7% +0.9% 106.3% -3.0%
Apr-2016 113.3% -3.0% 105.2% -3.8%
May-2016 115.4% -2.5% 106.1% -5.0%
Jun-2016 110.3% -5.8% 105.3% -4.4%
Jul-2016 112.0% -4.9% 104.9% -3.9%
Aug-2016 111.8% -4.7% 103.0% -5.2%
12-Month Avg* 113.1% -1.0% 105.9% -2.0%
Historical % of List Price Received by Month
* % of List Price Received for all properties from September 2015 through August 2016. This is
not the average of the individual figures above.
Current as of September 11, 2016. All data from the San Francisco MLS. Report © 2016 ShowingTime. | 12
Percentage found when dividing a property’s sales price by its most recent list price, then taking the average for all properties sold in a given
month, not accounting for seller concessions.
111.2%
106.4%
117.3%
108.7%111.8%
103.0%
Single Family Condo/TIC/Coop
August
112.8%
107.5%
116.0%
109.3%112.6%
105.1%
Single Family Condo/TIC/Coop
Year to Date
95.0%
100.0%
105.0%
110.0%
115.0%
120.0%
1-2005 1-2006 1-2007 1-2008 1-2009 1-2010 1-2011 1-2012 1-2013 1-2014 1-2015 1-2016
Single Family Condo/TIC/Coop
2014 2015 2016
- 5.2%+ 2.2%- 4.7%+ 5.5%
2014 2015 2016
+ 1.0% + 0.9%
2014 2015 2016
- 3.8%+ 1.7%- 2.9%+ 2.8%
2014 2015 2016
+ 2.4% + 1.9%
Housing Affordability Ratio
Affordability Ratio
Single
Family
Year-Over-Year
Change
Condo/TIC/
Coop
Year-Over-Year
Change
Sep-2015 42 -4.5% 54 -5.3%
Oct-2015 38 -2.6% 51 -7.3%
Nov-2015 38 -7.3% 50 -3.8%
Dec-2015 40 -7.0% 51 -12.1%
Jan-2016 43 -15.7% 56 -11.1%
Feb-2016 38 -13.6% 56 +7.7%
Mar-2016 39 0.0% 56 +7.7%
Apr-2016 38 0.0% 53 0.0%
May-2016 39 +11.4% 56 +7.7%
Jun-2016 40 +8.1% 53 +3.9%
Jul-2016 40 +8.1% 59 +9.3%
Aug-2016 42 +7.7% 59 +11.3%
12-Month Avg* 40 +3.4% 41 +8.5%
Historical Housing Affordability Ratio by Month
* Affordability Ratio for all properties from September 2015 through August 2016. This is not the
average of the individual figures above.
Current as of September 11, 2016. All data from the San Francisco MLS. Report © 2016 ShowingTime. | 13
This index measures housing affordability for the region. For example, an index of 120 means the median household income is 120% of what is
necessary to qualify for the median-priced home under prevailing interest rates. A higher number means greater affordability.
47
56
39
53
42
59
Single Family Condo/TIC/Coop
August
30
40
50
60
70
80
90
100
1-2005 1-2006 1-2007 1-2008 1-2009 1-2010 1-2011 1-2012 1-2013 1-2014 1-2015 1-2016
Single Family Condo/TIC/Coop
2014 2015 2016
+ 11.3%- 5.4%+ 7.7%- 17.0%
2014 2015 2016
- 2.1% - 11.1%
43
56
39
52
40
57
Single Family Condo/TIC/Coop
Year to Date
2014 2015 2016
+ 9.6%- 7.1%+ 2.6%- 9.3%
2014 2015 2016
- 14.0% - 11.1%
Months Supply of Inventory
Months Supply
Single
Family
Year-Over-Year
Change
Condo/TIC/
Coop
Year-Over-Year
Change
Sep-2015 2.4 -4.0% 2.7 +22.7%
Oct-2015 2.2 +4.8% 2.7 +28.6%
Nov-2015 1.9 +18.8% 2.2 +22.2%
Dec-2015 1.2 +9.1% 1.5 +36.4%
Jan-2016 1.5 +7.1% 2.0 +33.3%
Feb-2016 2.0 +5.3% 2.2 +29.4%
Mar-2016 2.3 +27.8% 2.7 +50.0%
Apr-2016 2.5 +38.9% 3.0 +57.9%
May-2016 2.4 +20.0% 3.0 +50.0%
Jun-2016 2.2 +10.0% 3.2 +68.4%
Jul-2016 2.2 +10.0% 2.7 +42.1%
Aug-2016 1.8 -10.0% 2.3 +21.1%
12-Month Avg* 2.1 +11.8% 2.5 +39.7%
Historical Months Supply of Inventory by Month
* Months Supply for all properties from September 2015 through August 2016. This is not the
average of the individual figures above.
Current as of September 11, 2016. All data from the San Francisco MLS. Report © 2016 ShowingTime. | 14
The inventory of homes for sale at the end of a given month, divided by the average monthly pending sales from the last 12 months.
2.0 1.92.0 1.91.8
2.3
Single Family Condo/TIC/Coop
August
0.0
2.0
4.0
6.0
8.0
10.0
1-2005 1-2006 1-2007 1-2008 1-2009 1-2010 1-2011 1-2012 1-2013 1-2014 1-2015 1-2016
Single Family Condo/TIC/Coop
2014 2015 2016
+ 21.1%0.0%- 10.0%0.0%
2014 2015 2016
- 4.8% - 13.6%
All Properties Activity Overview
Key metrics by report month and for year-to-date (YTD) starting from the first of the year.
Key Metrics Historical Sparkbars 8-2015 8-2016 Percent Change YTD 2015 YTD 2016 Percent Change
+ 0.7%
Pending Sales 436 419 - 3.9% 3,552 3,356 - 5.5%
New Listings 520 396 - 23.8% 4,418 4,449
Sold Listings 427 436 + 2.1% 3,454 3,213 - 7.0%
Median Sales Price $1,155,000 $1,150,000 - 0.4% $1,150,000 $1,200,000 + 4.3%
+ 0.1%
34 + 17.2%
$1,436,460
-- --
Days on Market 28 41 + 46.4% 29
Avg. Sales Price $1,319,845 $1,349,837 + 2.3% $1,434,895
Active Listings 871 882 + 1.3% --
% of Properties Sold Over List Price 80.1% 61.2% - 23.6% 76.1%
39
67.5% - 11.3%
- 3.4%
44 + 12.8%
108.4%% of List Price Received 112.7% 106.8% - 5.2% 112.2%
Current as of September 11, 2016. All data from the San Francisco MLS. Report © 2016 ShowingTime. | 15
Months Supply 1.9 2.1 + 10.5% -- -- --
Affordability Ratio 43 47 + 9.3%
8-2013 8-2014 8-2015 8-2016
8-2013 8-2014 8-2015 8-2016
8-2013 8-2014 8-2015 8-2016
8-2013 8-2014 8-2015 8-2016
8-2013 8-2014 8-2015 8-2016
8-2013 8-2014 8-2015 8-2016
8-2013 8-2014 8-2015 8-2016
8-2013 8-2014 8-2015 8-2016
8-2013 8-2014 8-2015 8-2016
8-2013 8-2014 8-2015 8-2016
8-2013 8-2014 8-2015 8-2016
Activity by District
SF District 1: Northwest (Sea Cliff, Lake, Jordan Park / Laurel Heights, Outer Richmond, Central Richmond, Inner Richmond, Lone Mountain)
SF District 2: Central West (Outer Sunset, Central Sunset, Inner Sunset, Outer Parkside, Parkside, Inner Parkside, Golden Gate Heights)
SF District 3: Southwest (Pine Lake Park, Lake Shore, Merced Manor, Stonestown, Lakeside, Merced Heights, Ingleside, Ingleside Heights, Oceanview)
SF District 4: Twin Peaks W (Forest Hill (& Ext), W Portal, St Francis Wd, Balboa Terr, Mt Dav Manor, Ingleside Terr, Monterey Hts, Wstwd Pk & H'lnds, Shrwd Fst, Miraloma Pk, Dmnd Hts, Mdtwn Terr)
SF District 5: Central (Haight Ashbury, Cole Vly / Prnssus Hts, Clarndn Hts, Corona Hts, Twin Pks, Glen Pk, Noe Vly, Eureka Vly / Dolores Hts, Mission Dolores, Duboce Trngl, Buena Vista / Ashbury Hts)
SF District 6: Central North (Lower Pacific Heights, Anza Vista, Western Addition, North Panhandle, Alamo Square, Hayes Valley)
SF District 7: North (Marina, Cow Hollow, Presidio Heights, Pacific Heights)
SF District 8: Northeast (North Waterfront, North Beach, Russian Hill, Telegraph Hill, Nob Hill, Financial District / Barbary Coast, Downtown, Van Ness / Civic Center, Tenderloin)
SF District 9: Central East (Yerba Buena, South Beach, South of Market, Mission Bay, Inner Mission, Potrero Hill, Central Waterfront / Dogpatch, Bernal Heights)
SF District 10: Southeast (Outer Mission, Mission Terr, Excelsior, Portola, Bayview, Silver Terr, Hunters Pt, Candlestick Pt, Bayview Hts, Little Hollywood, Visitation Vly, Crocker Amazon)
8-2015 8-2016 + / – 8-2015 8-2016 + / – 8-2015 8-2016 + / – 8-2015 8-2016 + / – 8-2015 8-2016 + / –
Single Family
1 SF District 1 26 29 +11.5% 14 14 0.0% $1,637,800 $1,794,000 +9.5% 24 35 +45.8% 1.4 2.0 +42.9%
2 SF District 2 61 34 -44.3% 36 27 -25.0% $1,200,000 $1,250,000 +4.2% 19 21 +10.5% 1.7 1.0 -41.2%
3 SF District 3 30 22 -26.7% 13 16 +23.1% $755,000 $840,000 +11.3% 42 32 -23.8% 2.5 1.3 -48.0%
4 SF District 4 43 47 +9.3% 29 28 -3.4% $1,441,000 $1,439,500 -0.1% 23 26 +13.0% 1.6 1.7 +6.3%
5 SF District 5 37 39 +5.4% 20 23 +15.0% $2,077,500 $2,175,000 +4.7% 25 38 +52.0% 1.4 1.6 +14.3%
6 SF District 6 7 5 -28.6% 6 6 0.0% $3,125,000 $2,425,000 -22.4% 13 51 +292.3% 1.9 1.7 -10.5%
7 SF District 7 22 27 +22.7% 2 7 +250.0% $3,275,000 $3,091,000 -5.6% 6 55 +816.7% 2.6 3.3 +26.9%
8 SF District 8 5 17 +240.0% 4 1 -75.0% $6,425,000 $9,750,000 +51.8% 142 21 -85.2% 2.4 7.9 +229.2%
9 SF District 9 38 32 -15.8% 25 23 -8.0% $1,300,000 $1,430,000 +10.0% 20 33 +65.0% 1.8 1.5 -16.7%
10 SF District 10 118 93 -21.2% 49 41 -16.3% $800,000 $833,000 +4.1% 33 35 +6.1% 2.8 2.5 -10.7%
Condo/TIC/Coop
1 SF District 1 30 19 -36.7% 16 14 -12.5% $879,000 $1,147,500 +30.5% 20 37 +85.0% 2.3 1.5 -34.8%
2 SF District 2 10 12 +20.0% 2 2 0.0% $477,000 $990,000 +107.5% 23 92 +300.0% 2.6 2.9 +11.5%
3 SF District 3 8 6 -25.0% 8 7 -12.5% $666,500 $1,098,236 +64.8% 20 48 +140.0% 1.5 1.5 0.0%
4 SF District 4 2 7 +250.0% 13 1 -92.3% $730,000 $680,000 -6.8% 29 39 +34.5% 0.4 2.9 +625.0%
5 SF District 5 62 62 0.0% 27 42 +55.6% $1,250,000 $1,203,500 -3.7% 34 34 0.0% 1.6 1.8 +12.5%
6 SF District 6 39 61 +56.4% 22 23 +4.5% $1,196,000 $950,500 -20.5% 30 35 +16.7% 1.4 2.4 +71.4%
7 SF District 7 32 32 0.0% 16 31 +93.8% $1,575,000 $1,475,000 -6.3% 31 43 +38.7% 1.3 1.4 +7.7%
8 SF District 8 83 83 0.0% 40 44 +10.0% $1,225,000 $899,000 -26.6% 25 48 +92.0% 2.1 2.1 0.0%
9 SF District 9 192 231 +20.3% 78 81 +3.8% $1,099,500 $975,000 -11.3% 30 54 +80.0% 2.1 2.8 +33.3%
10 SF District 10 26 24 -7.7% 7 5 -28.6% $730,000 $620,000 -15.1% 28 98 +250.0% 4.7 4.0 -14.9%
Key metrics by report month for the districts of San Fransisco.
Current as of September 11, 2016. All data from the San Francisco MLS. Report © 2016 ShowingTime. | 16
Active Listings Sold Listings Median Sales Price Days on Market Months Supply

Contenu connexe

Tendances

San Francisco Market Focus February 2016
San Francisco Market Focus February 2016San Francisco Market Focus February 2016
San Francisco Market Focus February 2016Ronny Budiutama
 
San Francisco Market Focus December 2015
San Francisco Market Focus December 2015San Francisco Market Focus December 2015
San Francisco Market Focus December 2015Ronny Budiutama
 
San Francisco Market Focus March 2015
San Francisco Market Focus March 2015San Francisco Market Focus March 2015
San Francisco Market Focus March 2015Ronny Budiutama
 
San Francisco Market Focus January 2016
San Francisco Market Focus January 2016San Francisco Market Focus January 2016
San Francisco Market Focus January 2016Ronny Budiutama
 
San Francisco Market Focus April 2015
San Francisco Market Focus April 2015San Francisco Market Focus April 2015
San Francisco Market Focus April 2015Ronny Budiutama
 
San Francisco Market Focus May 2015
San Francisco Market Focus May 2015San Francisco Market Focus May 2015
San Francisco Market Focus May 2015Ronny Budiutama
 
San Francisco Market Focus September 2015
San Francisco Market Focus September 2015San Francisco Market Focus September 2015
San Francisco Market Focus September 2015Ronny Budiutama
 
San Francisco Market Focus July 2015
San Francisco Market Focus July 2015San Francisco Market Focus July 2015
San Francisco Market Focus July 2015Ronny Budiutama
 
San Francisco Market Focus August 2015
San Francisco Market Focus August 2015San Francisco Market Focus August 2015
San Francisco Market Focus August 2015Ronny Budiutama
 
San Francisco Market Focus February 2015
San Francisco Market Focus February 2015San Francisco Market Focus February 2015
San Francisco Market Focus February 2015Ronny Budiutama
 
San Francisco Market Focus November 2016
San Francisco Market Focus November 2016San Francisco Market Focus November 2016
San Francisco Market Focus November 2016Ronny Budiutama
 
San Francisco Real Estate Housing Market December 2016
San Francisco Real Estate Housing Market December 2016San Francisco Real Estate Housing Market December 2016
San Francisco Real Estate Housing Market December 2016Ronny Budiutama
 
San Francisco Market Focus August 2017
San Francisco Market Focus August 2017San Francisco Market Focus August 2017
San Francisco Market Focus August 2017Ronny Budiutama
 
San Francisco Market Focus January 2015
San Francisco Market Focus January 2015San Francisco Market Focus January 2015
San Francisco Market Focus January 2015Ronny Budiutama
 
San Francisco Market Focus October 2015
San Francisco Market Focus October 2015San Francisco Market Focus October 2015
San Francisco Market Focus October 2015Ronny Budiutama
 
San Francisco Market Focus Sept 2017
San Francisco Market Focus Sept 2017San Francisco Market Focus Sept 2017
San Francisco Market Focus Sept 2017Ronny Budiutama
 
San Francisco Market Focus April 2017
San Francisco Market Focus April 2017San Francisco Market Focus April 2017
San Francisco Market Focus April 2017Ronny Budiutama
 
San Francisco Market Focus June 2017
San Francisco Market Focus June 2017San Francisco Market Focus June 2017
San Francisco Market Focus June 2017Ronny Budiutama
 
San Francisco Market Focus May 2017
San Francisco Market Focus May 2017San Francisco Market Focus May 2017
San Francisco Market Focus May 2017Ronny Budiutama
 
San Francisco Real Estate Housing Market January 2017
San Francisco Real Estate Housing Market January 2017San Francisco Real Estate Housing Market January 2017
San Francisco Real Estate Housing Market January 2017Ronny Budiutama
 

Tendances (20)

San Francisco Market Focus February 2016
San Francisco Market Focus February 2016San Francisco Market Focus February 2016
San Francisco Market Focus February 2016
 
San Francisco Market Focus December 2015
San Francisco Market Focus December 2015San Francisco Market Focus December 2015
San Francisco Market Focus December 2015
 
San Francisco Market Focus March 2015
San Francisco Market Focus March 2015San Francisco Market Focus March 2015
San Francisco Market Focus March 2015
 
San Francisco Market Focus January 2016
San Francisco Market Focus January 2016San Francisco Market Focus January 2016
San Francisco Market Focus January 2016
 
San Francisco Market Focus April 2015
San Francisco Market Focus April 2015San Francisco Market Focus April 2015
San Francisco Market Focus April 2015
 
San Francisco Market Focus May 2015
San Francisco Market Focus May 2015San Francisco Market Focus May 2015
San Francisco Market Focus May 2015
 
San Francisco Market Focus September 2015
San Francisco Market Focus September 2015San Francisco Market Focus September 2015
San Francisco Market Focus September 2015
 
San Francisco Market Focus July 2015
San Francisco Market Focus July 2015San Francisco Market Focus July 2015
San Francisco Market Focus July 2015
 
San Francisco Market Focus August 2015
San Francisco Market Focus August 2015San Francisco Market Focus August 2015
San Francisco Market Focus August 2015
 
San Francisco Market Focus February 2015
San Francisco Market Focus February 2015San Francisco Market Focus February 2015
San Francisco Market Focus February 2015
 
San Francisco Market Focus November 2016
San Francisco Market Focus November 2016San Francisco Market Focus November 2016
San Francisco Market Focus November 2016
 
San Francisco Real Estate Housing Market December 2016
San Francisco Real Estate Housing Market December 2016San Francisco Real Estate Housing Market December 2016
San Francisco Real Estate Housing Market December 2016
 
San Francisco Market Focus August 2017
San Francisco Market Focus August 2017San Francisco Market Focus August 2017
San Francisco Market Focus August 2017
 
San Francisco Market Focus January 2015
San Francisco Market Focus January 2015San Francisco Market Focus January 2015
San Francisco Market Focus January 2015
 
San Francisco Market Focus October 2015
San Francisco Market Focus October 2015San Francisco Market Focus October 2015
San Francisco Market Focus October 2015
 
San Francisco Market Focus Sept 2017
San Francisco Market Focus Sept 2017San Francisco Market Focus Sept 2017
San Francisco Market Focus Sept 2017
 
San Francisco Market Focus April 2017
San Francisco Market Focus April 2017San Francisco Market Focus April 2017
San Francisco Market Focus April 2017
 
San Francisco Market Focus June 2017
San Francisco Market Focus June 2017San Francisco Market Focus June 2017
San Francisco Market Focus June 2017
 
San Francisco Market Focus May 2017
San Francisco Market Focus May 2017San Francisco Market Focus May 2017
San Francisco Market Focus May 2017
 
San Francisco Real Estate Housing Market January 2017
San Francisco Real Estate Housing Market January 2017San Francisco Real Estate Housing Market January 2017
San Francisco Real Estate Housing Market January 2017
 

En vedette (10)

Historia de las tic en mexico
Historia de las tic en mexicoHistoria de las tic en mexico
Historia de las tic en mexico
 
diet 3
diet 3diet 3
diet 3
 
Mass inceration within the nation (poli-sci final paper) #2
Mass inceration within the nation (poli-sci final paper) #2Mass inceration within the nation (poli-sci final paper) #2
Mass inceration within the nation (poli-sci final paper) #2
 
Thesis Presentation
Thesis PresentationThesis Presentation
Thesis Presentation
 
Batlagdsan tusuv1
Batlagdsan tusuv1Batlagdsan tusuv1
Batlagdsan tusuv1
 
Sariin medee 19 4 sar
Sariin medee 19 4 sarSariin medee 19 4 sar
Sariin medee 19 4 sar
 
Resume
ResumeResume
Resume
 
16.10.2014, Global CEO Survey 2014, Matthew Pottle
16.10.2014, Global CEO Survey 2014,  Matthew Pottle16.10.2014, Global CEO Survey 2014,  Matthew Pottle
16.10.2014, Global CEO Survey 2014, Matthew Pottle
 
Los tics
Los ticsLos tics
Los tics
 
TapSnapOverview
TapSnapOverviewTapSnapOverview
TapSnapOverview
 

Similaire à San Francisco Market Focus August 2016

San Francisco Market Focus February 2017
San Francisco Market Focus February 2017San Francisco Market Focus February 2017
San Francisco Market Focus February 2017Ronny Budiutama
 
San Francisco Market Focus August 2017
San Francisco Market Focus August 2017San Francisco Market Focus August 2017
San Francisco Market Focus August 2017Ronny Budiutama
 
San Francisco Market Focus July 2017
San Francisco Market Focus July 2017San Francisco Market Focus July 2017
San Francisco Market Focus July 2017Ronny Budiutama
 
San Francisco Market Focus Report July
San Francisco Market Focus Report JulySan Francisco Market Focus Report July
San Francisco Market Focus Report JulyRonny Budiutama
 
San Francisco Market Focus March 2014
San Francisco Market Focus March 2014San Francisco Market Focus March 2014
San Francisco Market Focus March 2014Ronny Budiutama
 
San Francisco Market Focus October 2014
San Francisco Market Focus October 2014San Francisco Market Focus October 2014
San Francisco Market Focus October 2014Ronny Budiutama
 
San Francisco Market Focus Report September 2018
San Francisco Market Focus Report September 2018San Francisco Market Focus Report September 2018
San Francisco Market Focus Report September 2018Ronny Budiutama
 
San Francisco Market Focus March 2018
San Francisco Market Focus March 2018San Francisco Market Focus March 2018
San Francisco Market Focus March 2018Ronny Budiutama
 
San Francisco Market Focus Report May 2019
San Francisco Market Focus Report May 2019San Francisco Market Focus Report May 2019
San Francisco Market Focus Report May 2019Ronny Budiutama
 
San Francisco Market Focus Report May
San Francisco Market Focus Report MaySan Francisco Market Focus Report May
San Francisco Market Focus Report MayRonny Budiutama
 
San Francisco Market Focus October 2017
San Francisco Market Focus October 2017San Francisco Market Focus October 2017
San Francisco Market Focus October 2017Ronny Budiutama
 
San Francisco Market Focus November 2015
San Francisco Market Focus November 2015San Francisco Market Focus November 2015
San Francisco Market Focus November 2015Ronny Budiutama
 
San Francisco market report September 2020
San Francisco market report September 2020San Francisco market report September 2020
San Francisco market report September 2020Ronny Budiutama
 

Similaire à San Francisco Market Focus August 2016 (13)

San Francisco Market Focus February 2017
San Francisco Market Focus February 2017San Francisco Market Focus February 2017
San Francisco Market Focus February 2017
 
San Francisco Market Focus August 2017
San Francisco Market Focus August 2017San Francisco Market Focus August 2017
San Francisco Market Focus August 2017
 
San Francisco Market Focus July 2017
San Francisco Market Focus July 2017San Francisco Market Focus July 2017
San Francisco Market Focus July 2017
 
San Francisco Market Focus Report July
San Francisco Market Focus Report JulySan Francisco Market Focus Report July
San Francisco Market Focus Report July
 
San Francisco Market Focus March 2014
San Francisco Market Focus March 2014San Francisco Market Focus March 2014
San Francisco Market Focus March 2014
 
San Francisco Market Focus October 2014
San Francisco Market Focus October 2014San Francisco Market Focus October 2014
San Francisco Market Focus October 2014
 
San Francisco Market Focus Report September 2018
San Francisco Market Focus Report September 2018San Francisco Market Focus Report September 2018
San Francisco Market Focus Report September 2018
 
San Francisco Market Focus March 2018
San Francisco Market Focus March 2018San Francisco Market Focus March 2018
San Francisco Market Focus March 2018
 
San Francisco Market Focus Report May 2019
San Francisco Market Focus Report May 2019San Francisco Market Focus Report May 2019
San Francisco Market Focus Report May 2019
 
San Francisco Market Focus Report May
San Francisco Market Focus Report MaySan Francisco Market Focus Report May
San Francisco Market Focus Report May
 
San Francisco Market Focus October 2017
San Francisco Market Focus October 2017San Francisco Market Focus October 2017
San Francisco Market Focus October 2017
 
San Francisco Market Focus November 2015
San Francisco Market Focus November 2015San Francisco Market Focus November 2015
San Francisco Market Focus November 2015
 
San Francisco market report September 2020
San Francisco market report September 2020San Francisco market report September 2020
San Francisco market report September 2020
 

Plus de Ronny Budiutama

San Francisco Market Update -February 2024
San Francisco Market Update -February 2024San Francisco Market Update -February 2024
San Francisco Market Update -February 2024Ronny Budiutama
 
San Francisco Market Update - March 2024
San Francisco Market Update - March 2024San Francisco Market Update - March 2024
San Francisco Market Update - March 2024Ronny Budiutama
 
San Francisco January 2024 Market Report
San Francisco January 2024 Market ReportSan Francisco January 2024 Market Report
San Francisco January 2024 Market ReportRonny Budiutama
 
San Francisco December 2023 Market Report
San Francisco December 2023 Market ReportSan Francisco December 2023 Market Report
San Francisco December 2023 Market ReportRonny Budiutama
 
San Francisco November 2023 Market Report
San Francisco November 2023 Market ReportSan Francisco November 2023 Market Report
San Francisco November 2023 Market ReportRonny Budiutama
 
2023 Annual San Francisco Housing Market
2023 Annual San Francisco Housing Market2023 Annual San Francisco Housing Market
2023 Annual San Francisco Housing MarketRonny Budiutama
 
October 2023 Report: San Francisco Real Estate Market Insights
October 2023 Report: San Francisco Real Estate Market InsightsOctober 2023 Report: San Francisco Real Estate Market Insights
October 2023 Report: San Francisco Real Estate Market InsightsRonny Budiutama
 
CA Weekly MLS Market Data Report - August 2023
CA Weekly MLS Market Data Report - August 2023CA Weekly MLS Market Data Report - August 2023
CA Weekly MLS Market Data Report - August 2023Ronny Budiutama
 
San Francisco Market Report July 2023.pdf
San Francisco Market Report July 2023.pdfSan Francisco Market Report July 2023.pdf
San Francisco Market Report July 2023.pdfRonny Budiutama
 
San Francisco May 2023 Market Report.pdf
San Francisco May 2023 Market Report.pdfSan Francisco May 2023 Market Report.pdf
San Francisco May 2023 Market Report.pdfRonny Budiutama
 
San Francisco June 2023 Market Report.pdf
San Francisco June 2023 Market Report.pdfSan Francisco June 2023 Market Report.pdf
San Francisco June 2023 Market Report.pdfRonny Budiutama
 
San Francisco Market Report March 2023.pdf
San Francisco Market Report March 2023.pdfSan Francisco Market Report March 2023.pdf
San Francisco Market Report March 2023.pdfRonny Budiutama
 
San Francisco Market Report February 2023
San Francisco Market Report February 2023San Francisco Market Report February 2023
San Francisco Market Report February 2023Ronny Budiutama
 
San Francisco Market Report January 2023.pdf
San Francisco Market Report January 2023.pdfSan Francisco Market Report January 2023.pdf
San Francisco Market Report January 2023.pdfRonny Budiutama
 
Annual Report on the San Francisco County Housing Market.pdf
Annual Report on the San Francisco County Housing Market.pdfAnnual Report on the San Francisco County Housing Market.pdf
Annual Report on the San Francisco County Housing Market.pdfRonny Budiutama
 
San Francisco Market Report December 2022.pdf
San Francisco Market Report December 2022.pdfSan Francisco Market Report December 2022.pdf
San Francisco Market Report December 2022.pdfRonny Budiutama
 
San Francisco Market Report November 2022.pdf
San Francisco Market Report November 2022.pdfSan Francisco Market Report November 2022.pdf
San Francisco Market Report November 2022.pdfRonny Budiutama
 
San Francisco Market Report October 2022.pdf
San Francisco Market Report October 2022.pdfSan Francisco Market Report October 2022.pdf
San Francisco Market Report October 2022.pdfRonny Budiutama
 
San Francisco Market Report September 2022.pdf
San Francisco Market Report September 2022.pdfSan Francisco Market Report September 2022.pdf
San Francisco Market Report September 2022.pdfRonny Budiutama
 
San Francisco Market Report August 2022.pdf
San Francisco Market Report August 2022.pdfSan Francisco Market Report August 2022.pdf
San Francisco Market Report August 2022.pdfRonny Budiutama
 

Plus de Ronny Budiutama (20)

San Francisco Market Update -February 2024
San Francisco Market Update -February 2024San Francisco Market Update -February 2024
San Francisco Market Update -February 2024
 
San Francisco Market Update - March 2024
San Francisco Market Update - March 2024San Francisco Market Update - March 2024
San Francisco Market Update - March 2024
 
San Francisco January 2024 Market Report
San Francisco January 2024 Market ReportSan Francisco January 2024 Market Report
San Francisco January 2024 Market Report
 
San Francisco December 2023 Market Report
San Francisco December 2023 Market ReportSan Francisco December 2023 Market Report
San Francisco December 2023 Market Report
 
San Francisco November 2023 Market Report
San Francisco November 2023 Market ReportSan Francisco November 2023 Market Report
San Francisco November 2023 Market Report
 
2023 Annual San Francisco Housing Market
2023 Annual San Francisco Housing Market2023 Annual San Francisco Housing Market
2023 Annual San Francisco Housing Market
 
October 2023 Report: San Francisco Real Estate Market Insights
October 2023 Report: San Francisco Real Estate Market InsightsOctober 2023 Report: San Francisco Real Estate Market Insights
October 2023 Report: San Francisco Real Estate Market Insights
 
CA Weekly MLS Market Data Report - August 2023
CA Weekly MLS Market Data Report - August 2023CA Weekly MLS Market Data Report - August 2023
CA Weekly MLS Market Data Report - August 2023
 
San Francisco Market Report July 2023.pdf
San Francisco Market Report July 2023.pdfSan Francisco Market Report July 2023.pdf
San Francisco Market Report July 2023.pdf
 
San Francisco May 2023 Market Report.pdf
San Francisco May 2023 Market Report.pdfSan Francisco May 2023 Market Report.pdf
San Francisco May 2023 Market Report.pdf
 
San Francisco June 2023 Market Report.pdf
San Francisco June 2023 Market Report.pdfSan Francisco June 2023 Market Report.pdf
San Francisco June 2023 Market Report.pdf
 
San Francisco Market Report March 2023.pdf
San Francisco Market Report March 2023.pdfSan Francisco Market Report March 2023.pdf
San Francisco Market Report March 2023.pdf
 
San Francisco Market Report February 2023
San Francisco Market Report February 2023San Francisco Market Report February 2023
San Francisco Market Report February 2023
 
San Francisco Market Report January 2023.pdf
San Francisco Market Report January 2023.pdfSan Francisco Market Report January 2023.pdf
San Francisco Market Report January 2023.pdf
 
Annual Report on the San Francisco County Housing Market.pdf
Annual Report on the San Francisco County Housing Market.pdfAnnual Report on the San Francisco County Housing Market.pdf
Annual Report on the San Francisco County Housing Market.pdf
 
San Francisco Market Report December 2022.pdf
San Francisco Market Report December 2022.pdfSan Francisco Market Report December 2022.pdf
San Francisco Market Report December 2022.pdf
 
San Francisco Market Report November 2022.pdf
San Francisco Market Report November 2022.pdfSan Francisco Market Report November 2022.pdf
San Francisco Market Report November 2022.pdf
 
San Francisco Market Report October 2022.pdf
San Francisco Market Report October 2022.pdfSan Francisco Market Report October 2022.pdf
San Francisco Market Report October 2022.pdf
 
San Francisco Market Report September 2022.pdf
San Francisco Market Report September 2022.pdfSan Francisco Market Report September 2022.pdf
San Francisco Market Report September 2022.pdf
 
San Francisco Market Report August 2022.pdf
San Francisco Market Report August 2022.pdfSan Francisco Market Report August 2022.pdf
San Francisco Market Report August 2022.pdf
 

Dernier

Kohinoor Courtyard One Wakad Pune | Elegant Living Spaces
Kohinoor Courtyard One Wakad Pune | Elegant Living SpacesKohinoor Courtyard One Wakad Pune | Elegant Living Spaces
Kohinoor Courtyard One Wakad Pune | Elegant Living Spacesaidasheikh47
 
Cheap Rate ✨➥9582086666▻✨Call Girls In Gurgaon Sector 1 (Gurgaon)
Cheap Rate ✨➥9582086666▻✨Call Girls In Gurgaon Sector 1 (Gurgaon)Cheap Rate ✨➥9582086666▻✨Call Girls In Gurgaon Sector 1 (Gurgaon)
Cheap Rate ✨➥9582086666▻✨Call Girls In Gurgaon Sector 1 (Gurgaon)delhi24hrs1
 
Rohan Harita Tathawade Pune Brochure.pdf
Rohan Harita Tathawade Pune Brochure.pdfRohan Harita Tathawade Pune Brochure.pdf
Rohan Harita Tathawade Pune Brochure.pdfabbu831446
 
Madhugiri Boucher Managed Farmland (knx)
Madhugiri Boucher Managed Farmland (knx)Madhugiri Boucher Managed Farmland (knx)
Madhugiri Boucher Managed Farmland (knx)knoxdigital1
 
Jaipur Escorts 🥰 8617370543 Call Girls Offer VIP Hot Girls
Jaipur Escorts 🥰 8617370543 Call Girls Offer VIP Hot GirlsJaipur Escorts 🥰 8617370543 Call Girls Offer VIP Hot Girls
Jaipur Escorts 🥰 8617370543 Call Girls Offer VIP Hot GirlsDeepika Singh
 
MEQ Mainstreet Equity Corp Q2 2024 Investor Presentation
MEQ Mainstreet Equity Corp Q2 2024 Investor PresentationMEQ Mainstreet Equity Corp Q2 2024 Investor Presentation
MEQ Mainstreet Equity Corp Q2 2024 Investor PresentationMEQ - Mainstreet Equity Corp.
 
Call Girls in Maurice Nagar (Delhi) ꧁8447779280꧂ Female Escorts Service in De...
Call Girls in Maurice Nagar (Delhi) ꧁8447779280꧂ Female Escorts Service in De...Call Girls in Maurice Nagar (Delhi) ꧁8447779280꧂ Female Escorts Service in De...
Call Girls in Maurice Nagar (Delhi) ꧁8447779280꧂ Female Escorts Service in De...asmaqueen5
 
Retail Space for Lease - 1221 W. Main St., Sun Prairie, WI
Retail Space for Lease - 1221 W. Main St., Sun Prairie, WIRetail Space for Lease - 1221 W. Main St., Sun Prairie, WI
Retail Space for Lease - 1221 W. Main St., Sun Prairie, WILee & Associates of Madison, WI
 
Eldeco Dwarka Project In Delhi-brochure.pdf.pdf
Eldeco Dwarka Project In Delhi-brochure.pdf.pdfEldeco Dwarka Project In Delhi-brochure.pdf.pdf
Eldeco Dwarka Project In Delhi-brochure.pdf.pdfkratirudram
 
Low rate ↬Call girls in Sabzi Mandi Delhi | 8447779280}Escort Service In All ...
Low rate ↬Call girls in Sabzi Mandi Delhi | 8447779280}Escort Service In All ...Low rate ↬Call girls in Sabzi Mandi Delhi | 8447779280}Escort Service In All ...
Low rate ↬Call girls in Sabzi Mandi Delhi | 8447779280}Escort Service In All ...asmaqueen5
 
Acibadem Konaklari Uskudar - Listin Turkey
Acibadem Konaklari Uskudar - Listin TurkeyAcibadem Konaklari Uskudar - Listin Turkey
Acibadem Konaklari Uskudar - Listin TurkeyListing Turkey
 
Yashwin Enchante Uppar Kharadi Pune E-Brochue.pdf
Yashwin Enchante Uppar Kharadi Pune  E-Brochue.pdfYashwin Enchante Uppar Kharadi Pune  E-Brochue.pdf
Yashwin Enchante Uppar Kharadi Pune E-Brochue.pdfManishSaxena95
 
ACE Terra Yamuna Expressway | 8929888700
ACE Terra Yamuna Expressway | 8929888700ACE Terra Yamuna Expressway | 8929888700
ACE Terra Yamuna Expressway | 8929888700Truhomes
 
Parksville 96 Surrey Floor Plans May 2024
Parksville 96 Surrey Floor Plans May 2024Parksville 96 Surrey Floor Plans May 2024
Parksville 96 Surrey Floor Plans May 2024VickyAulakh1
 
Bridge & Elliot Ladner Floor Plans May 2024.pdf
Bridge & Elliot Ladner Floor Plans May 2024.pdfBridge & Elliot Ladner Floor Plans May 2024.pdf
Bridge & Elliot Ladner Floor Plans May 2024.pdfVickyAulakh1
 
SVN Live 5.6.24 Weekly Property Broadcast
SVN Live 5.6.24 Weekly Property BroadcastSVN Live 5.6.24 Weekly Property Broadcast
SVN Live 5.6.24 Weekly Property BroadcastSVN International Corp.
 
Top tourism places in Dubai - Inch & Brick Realty
Top tourism places in Dubai - Inch & Brick RealtyTop tourism places in Dubai - Inch & Brick Realty
Top tourism places in Dubai - Inch & Brick Realtypunitranainchbrick02
 
Best Interior Design Services in Haldwani
Best Interior Design Services in HaldwaniBest Interior Design Services in Haldwani
Best Interior Design Services in HaldwaniGeomatrix
 
BPTP THE AMAARIO Luxury Project Invest Like Royalty in Sector 37D Gurgaon Dwa...
BPTP THE AMAARIO Luxury Project Invest Like Royalty in Sector 37D Gurgaon Dwa...BPTP THE AMAARIO Luxury Project Invest Like Royalty in Sector 37D Gurgaon Dwa...
BPTP THE AMAARIO Luxury Project Invest Like Royalty in Sector 37D Gurgaon Dwa...ApartmentWala1
 
Bptp The Amaario Launch Luxury Project Sector 37D Gurgaon Dwarka Expressway...
Bptp The Amaario Launch  Luxury Project  Sector 37D Gurgaon Dwarka Expressway...Bptp The Amaario Launch  Luxury Project  Sector 37D Gurgaon Dwarka Expressway...
Bptp The Amaario Launch Luxury Project Sector 37D Gurgaon Dwarka Expressway...ApartmentWala1
 

Dernier (20)

Kohinoor Courtyard One Wakad Pune | Elegant Living Spaces
Kohinoor Courtyard One Wakad Pune | Elegant Living SpacesKohinoor Courtyard One Wakad Pune | Elegant Living Spaces
Kohinoor Courtyard One Wakad Pune | Elegant Living Spaces
 
Cheap Rate ✨➥9582086666▻✨Call Girls In Gurgaon Sector 1 (Gurgaon)
Cheap Rate ✨➥9582086666▻✨Call Girls In Gurgaon Sector 1 (Gurgaon)Cheap Rate ✨➥9582086666▻✨Call Girls In Gurgaon Sector 1 (Gurgaon)
Cheap Rate ✨➥9582086666▻✨Call Girls In Gurgaon Sector 1 (Gurgaon)
 
Rohan Harita Tathawade Pune Brochure.pdf
Rohan Harita Tathawade Pune Brochure.pdfRohan Harita Tathawade Pune Brochure.pdf
Rohan Harita Tathawade Pune Brochure.pdf
 
Madhugiri Boucher Managed Farmland (knx)
Madhugiri Boucher Managed Farmland (knx)Madhugiri Boucher Managed Farmland (knx)
Madhugiri Boucher Managed Farmland (knx)
 
Jaipur Escorts 🥰 8617370543 Call Girls Offer VIP Hot Girls
Jaipur Escorts 🥰 8617370543 Call Girls Offer VIP Hot GirlsJaipur Escorts 🥰 8617370543 Call Girls Offer VIP Hot Girls
Jaipur Escorts 🥰 8617370543 Call Girls Offer VIP Hot Girls
 
MEQ Mainstreet Equity Corp Q2 2024 Investor Presentation
MEQ Mainstreet Equity Corp Q2 2024 Investor PresentationMEQ Mainstreet Equity Corp Q2 2024 Investor Presentation
MEQ Mainstreet Equity Corp Q2 2024 Investor Presentation
 
Call Girls in Maurice Nagar (Delhi) ꧁8447779280꧂ Female Escorts Service in De...
Call Girls in Maurice Nagar (Delhi) ꧁8447779280꧂ Female Escorts Service in De...Call Girls in Maurice Nagar (Delhi) ꧁8447779280꧂ Female Escorts Service in De...
Call Girls in Maurice Nagar (Delhi) ꧁8447779280꧂ Female Escorts Service in De...
 
Retail Space for Lease - 1221 W. Main St., Sun Prairie, WI
Retail Space for Lease - 1221 W. Main St., Sun Prairie, WIRetail Space for Lease - 1221 W. Main St., Sun Prairie, WI
Retail Space for Lease - 1221 W. Main St., Sun Prairie, WI
 
Eldeco Dwarka Project In Delhi-brochure.pdf.pdf
Eldeco Dwarka Project In Delhi-brochure.pdf.pdfEldeco Dwarka Project In Delhi-brochure.pdf.pdf
Eldeco Dwarka Project In Delhi-brochure.pdf.pdf
 
Low rate ↬Call girls in Sabzi Mandi Delhi | 8447779280}Escort Service In All ...
Low rate ↬Call girls in Sabzi Mandi Delhi | 8447779280}Escort Service In All ...Low rate ↬Call girls in Sabzi Mandi Delhi | 8447779280}Escort Service In All ...
Low rate ↬Call girls in Sabzi Mandi Delhi | 8447779280}Escort Service In All ...
 
Acibadem Konaklari Uskudar - Listin Turkey
Acibadem Konaklari Uskudar - Listin TurkeyAcibadem Konaklari Uskudar - Listin Turkey
Acibadem Konaklari Uskudar - Listin Turkey
 
Yashwin Enchante Uppar Kharadi Pune E-Brochue.pdf
Yashwin Enchante Uppar Kharadi Pune  E-Brochue.pdfYashwin Enchante Uppar Kharadi Pune  E-Brochue.pdf
Yashwin Enchante Uppar Kharadi Pune E-Brochue.pdf
 
ACE Terra Yamuna Expressway | 8929888700
ACE Terra Yamuna Expressway | 8929888700ACE Terra Yamuna Expressway | 8929888700
ACE Terra Yamuna Expressway | 8929888700
 
Parksville 96 Surrey Floor Plans May 2024
Parksville 96 Surrey Floor Plans May 2024Parksville 96 Surrey Floor Plans May 2024
Parksville 96 Surrey Floor Plans May 2024
 
Bridge & Elliot Ladner Floor Plans May 2024.pdf
Bridge & Elliot Ladner Floor Plans May 2024.pdfBridge & Elliot Ladner Floor Plans May 2024.pdf
Bridge & Elliot Ladner Floor Plans May 2024.pdf
 
SVN Live 5.6.24 Weekly Property Broadcast
SVN Live 5.6.24 Weekly Property BroadcastSVN Live 5.6.24 Weekly Property Broadcast
SVN Live 5.6.24 Weekly Property Broadcast
 
Top tourism places in Dubai - Inch & Brick Realty
Top tourism places in Dubai - Inch & Brick RealtyTop tourism places in Dubai - Inch & Brick Realty
Top tourism places in Dubai - Inch & Brick Realty
 
Best Interior Design Services in Haldwani
Best Interior Design Services in HaldwaniBest Interior Design Services in Haldwani
Best Interior Design Services in Haldwani
 
BPTP THE AMAARIO Luxury Project Invest Like Royalty in Sector 37D Gurgaon Dwa...
BPTP THE AMAARIO Luxury Project Invest Like Royalty in Sector 37D Gurgaon Dwa...BPTP THE AMAARIO Luxury Project Invest Like Royalty in Sector 37D Gurgaon Dwa...
BPTP THE AMAARIO Luxury Project Invest Like Royalty in Sector 37D Gurgaon Dwa...
 
Bptp The Amaario Launch Luxury Project Sector 37D Gurgaon Dwarka Expressway...
Bptp The Amaario Launch  Luxury Project  Sector 37D Gurgaon Dwarka Expressway...Bptp The Amaario Launch  Luxury Project  Sector 37D Gurgaon Dwarka Expressway...
Bptp The Amaario Launch Luxury Project Sector 37D Gurgaon Dwarka Expressway...
 

San Francisco Market Focus August 2016

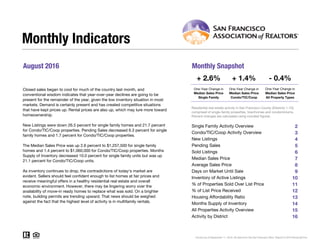
  • 1. August 2016 Monthly Snapshot One-Year Change in One-Year Change in Median Sales Price Single Family Median Sales Price Condo/TIC/Coop 2 3 4 5 6 7 8 9 10 11 12 13 14 15 16 Current as of September 11, 2016. All data from the San Francisco MLS. Report © 2016 ShowingTime. Condo/TIC/Coop Activity Overview Inventory of Active Listings % of Properties Sold Over List Price % of List Price Received Housing Affordability Ratio All Properties Activity Overview New Listings Pending Sales Sold Listings Median Sales Price Average Sales Price Days on Market Until Sale Activity by District Monthly Indicators + 2.6% + 1.4% - 0.4% One-Year Change inClosed sales began to cool for much of the country last month, and conventional wisdom indicates that year-over-year declines are going to be present for the remainder of the year, given the low inventory situation in most markets. Demand is certainly present and has created competitive situations that have kept prices up. Rental prices are also up, which may lure more toward homeownership. New Listings were down 26.5 percent for single family homes and 21.7 percent for Condo/TIC/Coop properties. Pending Sales decreased 6.3 percent for single family homes and 1.7 percent for Condo/TIC/Coop properties. The Median Sales Price was up 2.6 percent to $1,257,500 for single family homes and 1.4 percent to $1,060,000 for Condo/TIC/Coop properties. Months Supply of Inventory decreased 10.0 percent for single family units but was up 21.1 percent for Condo/TIC/Coop units. As inventory continues to drop, the contradictions of today's market are evident. Sellers should feel confident enough to list homes at fair prices and receive meaningful offers in a healthy residential real estate and overall economic environment. However, there may be lingering worry over the availability of move-in ready homes to replace what was sold. On a brighter note, building permits are trending upward. That news should be weighed against the fact that the highest level of activity is in multifamily rentals. Median Sales Price All Property Types Residential real estate activity in San Francisco County (Districts 1-10), comprised of single-family properties, townhomes and condominiums. Percent changes are calculated using rounded figures. Single Family Activity Overview Months Supply of Inventory
  • 2. Single Family Activity Overview Key metrics by report month and for year-to-date (YTD) starting from the first of the year. Key Metrics Historical Sparkbars 8-2015 8-2016 Percent Change YTD 2015 YTD 2016 Percent Change - 5.6%1,834 1,401 - 6.9% $1,325,000 + 6.0% + 1.2% Pending Sales 205 192 - 6.3% - 4.8%1,548 1,474 New Listings 234 172 - 26.5% 1,942 Sold Listings 198 186 - 6.1% 1,505 Median Sales Price $1,225,444 $1,257,500 + 2.6% $1,250,000 30 + 11.1% $1,689,420 -- -- Days on Market 28 33 + 17.9% 27 Avg. Sales Price $1,505,629 $1,546,587 + 2.7% $1,669,439 Active Listings 387 345 - 10.9% -- % of Properties Sold Over List Price 89.4% 76.3% - 14.7% 82.5% 39 76.7% - 7.0% - 2.9% 40 + 2.6% 112.6%% of List Price Received 117.3% 111.8% - 4.7% 116.0% Current as of September 11, 2016. All data from the San Francisco MLS. Report © 2016 ShowingTime. | 2 Months Supply 2.0 1.8 - 10.0% -- -- -- Affordability Ratio 39 42 + 7.7% 8-2013 8-2014 8-2015 8-2016 8-2013 8-2014 8-2015 8-2016 8-2013 8-2014 8-2015 8-2016 8-2013 8-2014 8-2015 8-2016 8-2013 8-2014 8-2015 8-2016 8-2013 8-2014 8-2015 8-2016 8-2013 8-2014 8-2015 8-2016 8-2013 8-2014 8-2015 8-2016 8-2013 8-2014 8-2015 8-2016 8-2013 8-2014 8-2015 8-2016 8-2013 8-2014 8-2015 8-2016
  • 3. Condo/TIC/Coop Activity Overview Key metrics by report month and for year-to-date (YTD) starting from the first of the year. Key Metrics Historical Sparkbars 8-2015 8-2016 Percent Change YTD 2015 YTD 2016 Percent Change + 5.6% Pending Sales 231 227 - 1.7% 2,004 1,882 - 6.1% New Listings 286 224 - 21.7% 2,476 2,615 Sold Listings 229 250 + 9.2% 1,949 1,812 - 7.0% Median Sales Price $1,045,000 $1,060,000 + 1.4% $1,075,000 $1,099,500 + 2.3% - 1.0% 37 + 23.3% $1,240,877 -- -- Days on Market 29 46 + 58.6% 30 Avg. Sales Price $1,159,211 $1,203,455 + 3.8% $1,253,781 Active Listings 484 537 + 11.0% -- % of Properties Sold Over List Price 72.1% 50.0% - 30.7% 71.1% 52 60.3% - 15.2% - 3.8% 57 + 9.6% 105.1%% of List Price Received 108.7% 103.0% - 5.2% 109.3% Current as of September 11, 2016. All data from the San Francisco MLS. Report © 2016 ShowingTime. | 3 Months Supply 1.9 2.3 + 21.1% -- -- -- Affordability Ratio 53 59 + 11.3% 8-2013 8-2014 8-2015 8-2016 8-2013 8-2014 8-2015 8-2016 8-2013 8-2014 8-2015 8-2016 8-2013 8-2014 8-2015 8-2016 8-2013 8-2014 8-2015 8-2016 8-2013 8-2014 8-2015 8-2016 8-2013 8-2014 8-2015 8-2016 8-2013 8-2014 8-2015 8-2016 8-2013 8-2014 8-2015 8-2016 8-2013 8-2014 8-2015 8-2016 8-2013 8-2014 8-2015 8-2016
  • 4. New Listings New Listings Single Family Year-Over-Year Change Condo/TIC/ Coop Year-Over-Year Change Sep-2015 325 -7.1% 438 +12.6% Oct-2015 263 +5.2% 321 -4.2% Nov-2015 143 +11.7% 195 +16.8% Dec-2015 67 -14.1% 120 +9.1% Jan-2016 180 -9.5% 293 +9.7% Feb-2016 225 -5.5% 333 +12.5% Mar-2016 272 +8.4% 377 +13.6% Apr-2016 281 +12.0% 370 +4.5% May-2016 253 -2.7% 365 +9.0% Jun-2016 233 -7.9% 397 +27.2% Jul-2016 218 -14.8% 256 -12.9% Aug-2016 172 -26.5% 224 -21.7% 12-Month Avg 219 -4.2% 307 +6.1% Historical New Listings by Month Current as of September 11, 2016. All data from the San Francisco MLS. Report © 2016 ShowingTime. | 4 A count of the properties that have been newly listed on the market in a given month. 226 273 234 286 172 224 Single Family Condo/TIC/Coop August 0 100 200 300 400 500 600 700 1-2005 1-2006 1-2007 1-2008 1-2009 1-2010 1-2011 1-2012 1-2013 1-2014 1-2015 1-2016 Single Family Condo/TIC/Coop 1,918 2,652 1,942 2,476 1,834 2,615 Single Family Condo/TIC/Coop Year to Date 2014 2015 2016 - 21.7%+ 4.8%- 26.5%+ 3.5% - 6.6%- 5.6%+ 1.3% + 5.6% 2014 2015 2016 2014 2015 2016 2014 2015 2016 - 16.9% - 9.9% - 5.5%- 19.7%
  • 5. Pending Sales Pending Sales Single Family Year-Over-Year Change Condo/TIC/ Coop Year-Over-Year Change Sep-2015 199 -6.6% 216 -19.4% Oct-2015 266 -0.4% 283 -6.0% Nov-2015 175 -16.7% 239 +9.6% Dec-2015 131 -3.7% 175 -15.9% Jan-2016 100 -8.3% 143 -4.0% Feb-2016 124 -10.1% 228 +7.0% Mar-2016 195 -15.9% 228 -21.6% Apr-2016 214 -5.3% 245 -12.5% May-2016 250 +19.6% 285 -2.1% Jun-2016 230 +4.5% 265 -9.9% Jul-2016 169 -19.1% 261 +2.4% Aug-2016 192 -6.3% 227 -1.7% 12-Month Avg 187 -5.4% 233 -6.8% Historical Pending Sales by Month Current as of September 11, 2016. All data from the San Francisco MLS. Report © 2016 ShowingTime. | 5 A count of the properties on which offers have been accepted in a given month. 204 266 205 231 192 227 Single Family Condo/TIC/Coop August 0 100 200 300 400 1-2005 1-2006 1-2007 1-2008 1-2009 1-2010 1-2011 1-2012 1-2013 1-2014 1-2015 1-2016 Single Family Condo/TIC/Coop 1,566 2,165 1,548 2,004 1,474 1,882 Single Family Condo/TIC/Coop Year to Date 2014 2015 2016 - 1.7%- 13.2%- 6.3%+ 0.5% - 7.4%- 4.8%- 1.1% - 6.1% 2014 2015 2016 2014 2015 2016 2014 2015 2016 - 10.9% - 11.9% - 5.3%- 11.9%
  • 6. Sold Listings Sold Listings Single Family Year-Over-Year Change Condo/TIC/ Coop Year-Over-Year Change Sep-2015 164 -16.8% 181 -27.0% Oct-2015 244 -12.2% 266 -16.6% Nov-2015 188 -6.5% 207 -4.2% Dec-2015 208 +6.1% 283 +24.7% Jan-2016 105 -4.5% 149 -5.7% Feb-2016 102 -20.9% 166 +3.1% Mar-2016 158 -16.4% 251 -4.9% Apr-2016 209 -4.6% 221 -23.3% May-2016 198 -3.4% 258 -9.8% Jun-2016 245 +11.9% 268 -7.9% Jul-2016 198 -16.1% 249 -8.5% Aug-2016 186 -6.1% 250 +9.2% 12-Month Avg 184 -7.2% 229 -7.1% Historical Sold Listings by Month Current as of September 11, 2016. All data from the San Francisco MLS. Report © 2016 ShowingTime. | 6 A count of the actual sales that closed in a given month. 211 287 198 229 186 250 Single Family Condo/TIC/Coop August 0 100 200 300 400 1-2005 1-2006 1-2007 1-2008 1-2009 1-2010 1-2011 1-2012 1-2013 1-2014 1-2015 1-2016 Single Family Condo/TIC/Coop 1,534 2,139 1,505 1,949 1,401 1,812 Single Family Condo/TIC/Coop Year to Date 2014 2015 2016 + 9.2%- 20.2%- 6.1%- 6.2% - 8.9%- 6.9%- 1.9% - 7.0% 2014 2015 2016 2014 2015 2016 2014 2015 2016 - 11.3% - 12.8% - 4.4%- 5.3%
  • 7. Median Sales Price Median Sales Price Single Family Year-Over-Year Change Condo/TIC/ Coop Year-Over-Year Change Sep-2015 $1,155,000 +11.6% $1,040,000 +13.7% Oct-2015 $1,267,500 +6.5% $1,100,000 +15.2% Nov-2015 $1,262,500 +12.1% $1,125,000 +10.3% Dec-2015 $1,201,500 +12.1% $1,098,000 +18.7% Jan-2016 $1,175,000 +20.5% $1,060,000 +17.8% Feb-2016 $1,390,000 +24.7% $1,097,500 -0.2% Mar-2016 $1,352,500 +8.2% $1,095,000 -0.5% Apr-2016 $1,380,000 +6.2% $1,150,000 +6.7% May-2016 $1,355,000 -3.2% $1,082,500 -2.7% Jun-2016 $1,325,000 +1.9% $1,175,000 +6.3% Jul-2016 $1,335,000 +4.3% $1,045,000 +1.1% Aug-2016 $1,257,500 +2.6% $1,060,000 +1.4% 12-Month Avg* $1,300,000 +8.3% $1,100,000 +7.7% Historical Median Sales Price by Month * Median Sales Price for all properties from September 2015 through August 2016. This is not the average of the individual figures above. Current as of September 11, 2016. All data from the San Francisco MLS. Report © 2016 ShowingTime. | 7 Point at which half of the sales sold for more and half sold for less, not accounting for seller concessions, in a given month. $968,000 $930,000 $1,225,444 $1,045,000 $1,257,500 $1,060,000 Single Family Condo/TIC/Coop August $400,000 $600,000 $800,000 $1,000,000 $1,200,000 $1,400,000 $1,600,000 1-2005 1-2006 1-2007 1-2008 1-2009 1-2010 1-2011 1-2012 1-2013 1-2014 1-2015 1-2016 Single Family Condo/TIC/Coop $1,050,000 $936,500 $1,250,000 $1,075,000 $1,325,000 $1,099,500 Single Family Condo/TIC/Coop Year to Date 2014 2015 2016 + 1.4%+ 12.4%+ 2.6%+ 26.6% + 14.8%+ 6.0%+ 19.0% + 2.3% 2014 2015 2016 2014 2015 2016 2014 2015 2016 + 3.6% + 16.7% + 14.5%+ 14.8%
  • 8. Average Sales Price Avg. Sales Price Single Family Year-Over-Year Change Condo/TIC/ Coop Year-Over-Year Change Sep-2015 $1,390,736 +5.6% $1,166,494 +14.9% Oct-2015 $1,624,546 -2.7% $1,184,400 +11.0% Nov-2015 $1,700,437 +16.4% $1,259,473 +12.3% Dec-2015 $1,497,221 +11.8% $1,249,856 +9.2% Jan-2016 $1,573,224 +23.0% $1,169,189 +6.8% Feb-2016 $1,611,354 +3.9% $1,209,909 +0.5% Mar-2016 $1,783,317 +2.0% $1,255,510 -3.4% Apr-2016 $1,767,919 +0.4% $1,371,042 +4.1% May-2016 $1,643,626 -10.7% $1,269,432 -4.5% Jun-2016 $1,752,261 -1.4% $1,218,386 -6.3% Jul-2016 $1,735,682 +4.7% $1,206,330 -0.7% Aug-2016 $1,546,587 +2.7% $1,203,455 +3.8% 12-Month Avg* $1,642,835 +3.0% $1,232,839 +3.1% Historical Average Sales Price by Month * Avg. Sales Price for all properties from September 2015 through August 2016. This is not the average of the individual figures above. Current as of September 11, 2016. All data from the San Francisco MLS. Report © 2016 ShowingTime. | 8 Average sales price for all closed sales, not accounting for seller concessions, in a given month. $1,326,578 $1,092,040 $1,505,629 $1,159,211 $1,546,587 $1,203,455 Single Family Condo/TIC/Coop August $600,000 $800,000 $1,000,000 $1,200,000 $1,400,000 $1,600,000 $1,800,000 $2,000,000 1-2005 1-2006 1-2007 1-2008 1-2009 1-2010 1-2011 1-2012 1-2013 1-2014 1-2015 1-2016 Single Family Condo/TIC/Coop $1,431,035 $1,101,972 $1,669,439 $1,253,781 $1,689,420 $1,240,877 Single Family Condo/TIC/Coop Year to Date 2014 2015 2016 + 3.8%+ 6.2%+ 2.7%+ 13.5% + 13.8%+ 1.2%+ 16.7% - 1.0% 2014 2015 2016 2014 2015 2016 2014 2015 2016 + 1.9% + 12.1% + 16.1%+ 17.5%
  • 9. Days on Market Until Sale Days on Market Single Family Year-Over-Year Change Condo/TIC/ Coop Year-Over-Year Change Sep-2015 27 +3.8% 34 -8.1% Oct-2015 27 -10.0% 26 -29.7% Nov-2015 28 -9.7% 34 -10.5% Dec-2015 33 -15.4% 43 -8.5% Jan-2016 40 -7.0% 44 -10.2% Feb-2016 31 +10.7% 35 +20.7% Mar-2016 25 +4.2% 30 +7.1% Apr-2016 32 +39.1% 38 +22.6% May-2016 24 +4.3% 33 +17.9% Jun-2016 29 +3.6% 35 +34.6% Jul-2016 32 +28.0% 39 +34.5% Aug-2016 33 +17.9% 46 +58.6% 12-Month Avg* 30 +4.5% 36 +9.3% Historical Days on Market Until Sale by Month * Days on Market for all properties from September 2015 through August 2016. This is not the average of the individual figures above. Current as of September 11, 2016. All data from the San Francisco MLS. Report © 2016 ShowingTime. | 9 Average number of days between when a property is listed and when an offer is accepted in a given month. 27 33 28 29 33 46 Single Family Condo/TIC/Coop August 20 40 60 80 100 120 1-2005 1-2006 1-2007 1-2008 1-2009 1-2010 1-2011 1-2012 1-2013 1-2014 1-2015 1-2016 Single Family Condo/TIC/Coop 31 34 27 3030 37 Single Family Condo/TIC/Coop Year to Date 2014 2015 2016 + 58.6%- 12.1%+ 17.9%+ 3.7% - 11.8%+ 11.1%- 12.9% + 23.3% 2014 2015 2016 2014 2015 2016 2014 2015 2016 - 27.0% - 13.9% - 15.0%- 13.2%
  • 10. Inventory of Active Listings Active Listings Single Family Year-Over-Year Change Condo/TIC/ Coop Year-Over-Year Change Sep-2015 477 -3.4% 669 +14.4% Oct-2015 439 +2.1% 648 +14.7% Nov-2015 361 +12.8% 533 +15.4% Dec-2015 228 +8.6% 365 +31.8% Jan-2016 294 +4.3% 485 +28.3% Feb-2016 378 +4.4% 538 +23.1% Mar-2016 438 +21.3% 635 +40.5% Apr-2016 474 +32.0% 699 +41.2% May-2016 451 +16.2% 711 +41.6% Jun-2016 417 +6.1% 753 +57.5% Jul-2016 421 +4.2% 640 +33.3% Aug-2016 345 -10.9% 537 +11.0% 12-Month Avg* 394 +7.6% 601 +28.9% Historical Inventory of Active Listings by Month * Active Listings for all properties from September 2015 through August 2016. This is not the average of the individual figures above. Current as of September 11, 2016. All data from the San Francisco MLS. Report © 2016 ShowingTime. | 10 The number of properties available for sale in active status at the end of a given month. 398 522 387 484 345 537 Single Family Condo/TIC/Coop August 200 400 600 800 1,000 1,200 1,400 1,600 1-2005 1-2006 1-2007 1-2008 1-2009 1-2010 1-2011 1-2012 1-2013 1-2014 1-2015 1-2016 Single Family Condo/TIC/Coop 2014 2015 2016 + 11.0%- 7.3%- 10.9%- 2.8% 2014 2015 2016 - 14.6% - 11.2%
  • 11. % of Properties Sold Over List Price % of Properties Sold Over List Price Single Family Year-Over-Year Change Condo/TIC/ Coop Year-Over-Year Change Sep-2015 88.4% +14.5% 71.8% +8.0% Oct-2015 83.2% +1.0% 76.3% +10.1% Nov-2015 77.7% -2.9% 69.6% +3.7% Dec-2015 79.3% +7.2% 59.4% +7.0% Jan-2016 76.2% +18.1% 53.0% -8.9% Feb-2016 77.5% -5.7% 58.4% -11.2% Mar-2016 82.3% +7.3% 67.7% -1.3% Apr-2016 75.6% -9.6% 60.6% -14.9% May-2016 79.8% -4.3% 67.4% -12.0% Jun-2016 71.8% -16.8% 62.3% -16.5% Jul-2016 76.8% -8.9% 59.0% -20.2% Aug-2016 76.3% -14.7% 50.0% -30.7% 12-Month Avg 78.6% -3.0% 63.2% -8.4% Historical % of Properties Sold Over List Price by Month * % of Properties Sold Over List Price for all properties from September 2015 through August 2016. This is not the average of the individual figures above. Current as of September 11, 2016. All data from the San Francisco MLS. Report © 2016 ShowingTime. | 11 Percentage found when dividing the number of properties sold by properties sold over its original list price, not accounting for seller concessions. 80.6% 69.3% 89.4% 72.1% 76.3% 50.0% Single Family Condo/TIC/Coop August 0.0% 20.0% 40.0% 60.0% 80.0% 100.0% 1-2005 1-2006 1-2007 1-2008 1-2009 1-2010 1-2011 1-2012 1-2013 1-2014 1-2015 1-2016 Single Family Condo/TIC/Coop 80.8% 68.8% 82.5% 71.1% 76.7% 60.3% Single Family Condo/TIC/Coop Year to Date 2014 2015 2016 - 30.7%+ 4.0%- 14.7%+ 10.9% + 3.3%- 7.0%+ 2.1% - 15.2% 2014 2015 2016 2014 2015 2016 2014 2015 2016 + 7.2% + 6.2% + 5.7%+ 5.0%
  • 12. % of List Price Received % of List Price Received Single Family Year-Over-Year Change Condo/TIC/ Coop Year-Over-Year Change Sep-2015 117.7% +5.5% 108.7% +3.3% Oct-2015 114.5% +1.3% 109.3% +2.2% Nov-2015 112.4% +1.0% 107.5% +1.0% Dec-2015 112.3% +3.0% 104.3% +0.8% Jan-2016 110.9% +2.8% 103.8% -1.0% Feb-2016 112.6% -1.7% 106.0% -1.9% Mar-2016 114.7% +0.9% 106.3% -3.0% Apr-2016 113.3% -3.0% 105.2% -3.8% May-2016 115.4% -2.5% 106.1% -5.0% Jun-2016 110.3% -5.8% 105.3% -4.4% Jul-2016 112.0% -4.9% 104.9% -3.9% Aug-2016 111.8% -4.7% 103.0% -5.2% 12-Month Avg* 113.1% -1.0% 105.9% -2.0% Historical % of List Price Received by Month * % of List Price Received for all properties from September 2015 through August 2016. This is not the average of the individual figures above. Current as of September 11, 2016. All data from the San Francisco MLS. Report © 2016 ShowingTime. | 12 Percentage found when dividing a property’s sales price by its most recent list price, then taking the average for all properties sold in a given month, not accounting for seller concessions. 111.2% 106.4% 117.3% 108.7%111.8% 103.0% Single Family Condo/TIC/Coop August 112.8% 107.5% 116.0% 109.3%112.6% 105.1% Single Family Condo/TIC/Coop Year to Date 95.0% 100.0% 105.0% 110.0% 115.0% 120.0% 1-2005 1-2006 1-2007 1-2008 1-2009 1-2010 1-2011 1-2012 1-2013 1-2014 1-2015 1-2016 Single Family Condo/TIC/Coop 2014 2015 2016 - 5.2%+ 2.2%- 4.7%+ 5.5% 2014 2015 2016 + 1.0% + 0.9% 2014 2015 2016 - 3.8%+ 1.7%- 2.9%+ 2.8% 2014 2015 2016 + 2.4% + 1.9%
  • 13. Housing Affordability Ratio Affordability Ratio Single Family Year-Over-Year Change Condo/TIC/ Coop Year-Over-Year Change Sep-2015 42 -4.5% 54 -5.3% Oct-2015 38 -2.6% 51 -7.3% Nov-2015 38 -7.3% 50 -3.8% Dec-2015 40 -7.0% 51 -12.1% Jan-2016 43 -15.7% 56 -11.1% Feb-2016 38 -13.6% 56 +7.7% Mar-2016 39 0.0% 56 +7.7% Apr-2016 38 0.0% 53 0.0% May-2016 39 +11.4% 56 +7.7% Jun-2016 40 +8.1% 53 +3.9% Jul-2016 40 +8.1% 59 +9.3% Aug-2016 42 +7.7% 59 +11.3% 12-Month Avg* 40 +3.4% 41 +8.5% Historical Housing Affordability Ratio by Month * Affordability Ratio for all properties from September 2015 through August 2016. This is not the average of the individual figures above. Current as of September 11, 2016. All data from the San Francisco MLS. Report © 2016 ShowingTime. | 13 This index measures housing affordability for the region. For example, an index of 120 means the median household income is 120% of what is necessary to qualify for the median-priced home under prevailing interest rates. A higher number means greater affordability. 47 56 39 53 42 59 Single Family Condo/TIC/Coop August 30 40 50 60 70 80 90 100 1-2005 1-2006 1-2007 1-2008 1-2009 1-2010 1-2011 1-2012 1-2013 1-2014 1-2015 1-2016 Single Family Condo/TIC/Coop 2014 2015 2016 + 11.3%- 5.4%+ 7.7%- 17.0% 2014 2015 2016 - 2.1% - 11.1% 43 56 39 52 40 57 Single Family Condo/TIC/Coop Year to Date 2014 2015 2016 + 9.6%- 7.1%+ 2.6%- 9.3% 2014 2015 2016 - 14.0% - 11.1%
  • 14. Months Supply of Inventory Months Supply Single Family Year-Over-Year Change Condo/TIC/ Coop Year-Over-Year Change Sep-2015 2.4 -4.0% 2.7 +22.7% Oct-2015 2.2 +4.8% 2.7 +28.6% Nov-2015 1.9 +18.8% 2.2 +22.2% Dec-2015 1.2 +9.1% 1.5 +36.4% Jan-2016 1.5 +7.1% 2.0 +33.3% Feb-2016 2.0 +5.3% 2.2 +29.4% Mar-2016 2.3 +27.8% 2.7 +50.0% Apr-2016 2.5 +38.9% 3.0 +57.9% May-2016 2.4 +20.0% 3.0 +50.0% Jun-2016 2.2 +10.0% 3.2 +68.4% Jul-2016 2.2 +10.0% 2.7 +42.1% Aug-2016 1.8 -10.0% 2.3 +21.1% 12-Month Avg* 2.1 +11.8% 2.5 +39.7% Historical Months Supply of Inventory by Month * Months Supply for all properties from September 2015 through August 2016. This is not the average of the individual figures above. Current as of September 11, 2016. All data from the San Francisco MLS. Report © 2016 ShowingTime. | 14 The inventory of homes for sale at the end of a given month, divided by the average monthly pending sales from the last 12 months. 2.0 1.92.0 1.91.8 2.3 Single Family Condo/TIC/Coop August 0.0 2.0 4.0 6.0 8.0 10.0 1-2005 1-2006 1-2007 1-2008 1-2009 1-2010 1-2011 1-2012 1-2013 1-2014 1-2015 1-2016 Single Family Condo/TIC/Coop 2014 2015 2016 + 21.1%0.0%- 10.0%0.0% 2014 2015 2016 - 4.8% - 13.6%
  • 15. All Properties Activity Overview Key metrics by report month and for year-to-date (YTD) starting from the first of the year. Key Metrics Historical Sparkbars 8-2015 8-2016 Percent Change YTD 2015 YTD 2016 Percent Change + 0.7% Pending Sales 436 419 - 3.9% 3,552 3,356 - 5.5% New Listings 520 396 - 23.8% 4,418 4,449 Sold Listings 427 436 + 2.1% 3,454 3,213 - 7.0% Median Sales Price $1,155,000 $1,150,000 - 0.4% $1,150,000 $1,200,000 + 4.3% + 0.1% 34 + 17.2% $1,436,460 -- -- Days on Market 28 41 + 46.4% 29 Avg. Sales Price $1,319,845 $1,349,837 + 2.3% $1,434,895 Active Listings 871 882 + 1.3% -- % of Properties Sold Over List Price 80.1% 61.2% - 23.6% 76.1% 39 67.5% - 11.3% - 3.4% 44 + 12.8% 108.4%% of List Price Received 112.7% 106.8% - 5.2% 112.2% Current as of September 11, 2016. All data from the San Francisco MLS. Report © 2016 ShowingTime. | 15 Months Supply 1.9 2.1 + 10.5% -- -- -- Affordability Ratio 43 47 + 9.3% 8-2013 8-2014 8-2015 8-2016 8-2013 8-2014 8-2015 8-2016 8-2013 8-2014 8-2015 8-2016 8-2013 8-2014 8-2015 8-2016 8-2013 8-2014 8-2015 8-2016 8-2013 8-2014 8-2015 8-2016 8-2013 8-2014 8-2015 8-2016 8-2013 8-2014 8-2015 8-2016 8-2013 8-2014 8-2015 8-2016 8-2013 8-2014 8-2015 8-2016 8-2013 8-2014 8-2015 8-2016
  • 16. Activity by District SF District 1: Northwest (Sea Cliff, Lake, Jordan Park / Laurel Heights, Outer Richmond, Central Richmond, Inner Richmond, Lone Mountain) SF District 2: Central West (Outer Sunset, Central Sunset, Inner Sunset, Outer Parkside, Parkside, Inner Parkside, Golden Gate Heights) SF District 3: Southwest (Pine Lake Park, Lake Shore, Merced Manor, Stonestown, Lakeside, Merced Heights, Ingleside, Ingleside Heights, Oceanview) SF District 4: Twin Peaks W (Forest Hill (& Ext), W Portal, St Francis Wd, Balboa Terr, Mt Dav Manor, Ingleside Terr, Monterey Hts, Wstwd Pk & H'lnds, Shrwd Fst, Miraloma Pk, Dmnd Hts, Mdtwn Terr) SF District 5: Central (Haight Ashbury, Cole Vly / Prnssus Hts, Clarndn Hts, Corona Hts, Twin Pks, Glen Pk, Noe Vly, Eureka Vly / Dolores Hts, Mission Dolores, Duboce Trngl, Buena Vista / Ashbury Hts) SF District 6: Central North (Lower Pacific Heights, Anza Vista, Western Addition, North Panhandle, Alamo Square, Hayes Valley) SF District 7: North (Marina, Cow Hollow, Presidio Heights, Pacific Heights) SF District 8: Northeast (North Waterfront, North Beach, Russian Hill, Telegraph Hill, Nob Hill, Financial District / Barbary Coast, Downtown, Van Ness / Civic Center, Tenderloin) SF District 9: Central East (Yerba Buena, South Beach, South of Market, Mission Bay, Inner Mission, Potrero Hill, Central Waterfront / Dogpatch, Bernal Heights) SF District 10: Southeast (Outer Mission, Mission Terr, Excelsior, Portola, Bayview, Silver Terr, Hunters Pt, Candlestick Pt, Bayview Hts, Little Hollywood, Visitation Vly, Crocker Amazon) 8-2015 8-2016 + / – 8-2015 8-2016 + / – 8-2015 8-2016 + / – 8-2015 8-2016 + / – 8-2015 8-2016 + / – Single Family 1 SF District 1 26 29 +11.5% 14 14 0.0% $1,637,800 $1,794,000 +9.5% 24 35 +45.8% 1.4 2.0 +42.9% 2 SF District 2 61 34 -44.3% 36 27 -25.0% $1,200,000 $1,250,000 +4.2% 19 21 +10.5% 1.7 1.0 -41.2% 3 SF District 3 30 22 -26.7% 13 16 +23.1% $755,000 $840,000 +11.3% 42 32 -23.8% 2.5 1.3 -48.0% 4 SF District 4 43 47 +9.3% 29 28 -3.4% $1,441,000 $1,439,500 -0.1% 23 26 +13.0% 1.6 1.7 +6.3% 5 SF District 5 37 39 +5.4% 20 23 +15.0% $2,077,500 $2,175,000 +4.7% 25 38 +52.0% 1.4 1.6 +14.3% 6 SF District 6 7 5 -28.6% 6 6 0.0% $3,125,000 $2,425,000 -22.4% 13 51 +292.3% 1.9 1.7 -10.5% 7 SF District 7 22 27 +22.7% 2 7 +250.0% $3,275,000 $3,091,000 -5.6% 6 55 +816.7% 2.6 3.3 +26.9% 8 SF District 8 5 17 +240.0% 4 1 -75.0% $6,425,000 $9,750,000 +51.8% 142 21 -85.2% 2.4 7.9 +229.2% 9 SF District 9 38 32 -15.8% 25 23 -8.0% $1,300,000 $1,430,000 +10.0% 20 33 +65.0% 1.8 1.5 -16.7% 10 SF District 10 118 93 -21.2% 49 41 -16.3% $800,000 $833,000 +4.1% 33 35 +6.1% 2.8 2.5 -10.7% Condo/TIC/Coop 1 SF District 1 30 19 -36.7% 16 14 -12.5% $879,000 $1,147,500 +30.5% 20 37 +85.0% 2.3 1.5 -34.8% 2 SF District 2 10 12 +20.0% 2 2 0.0% $477,000 $990,000 +107.5% 23 92 +300.0% 2.6 2.9 +11.5% 3 SF District 3 8 6 -25.0% 8 7 -12.5% $666,500 $1,098,236 +64.8% 20 48 +140.0% 1.5 1.5 0.0% 4 SF District 4 2 7 +250.0% 13 1 -92.3% $730,000 $680,000 -6.8% 29 39 +34.5% 0.4 2.9 +625.0% 5 SF District 5 62 62 0.0% 27 42 +55.6% $1,250,000 $1,203,500 -3.7% 34 34 0.0% 1.6 1.8 +12.5% 6 SF District 6 39 61 +56.4% 22 23 +4.5% $1,196,000 $950,500 -20.5% 30 35 +16.7% 1.4 2.4 +71.4% 7 SF District 7 32 32 0.0% 16 31 +93.8% $1,575,000 $1,475,000 -6.3% 31 43 +38.7% 1.3 1.4 +7.7% 8 SF District 8 83 83 0.0% 40 44 +10.0% $1,225,000 $899,000 -26.6% 25 48 +92.0% 2.1 2.1 0.0% 9 SF District 9 192 231 +20.3% 78 81 +3.8% $1,099,500 $975,000 -11.3% 30 54 +80.0% 2.1 2.8 +33.3% 10 SF District 10 26 24 -7.7% 7 5 -28.6% $730,000 $620,000 -15.1% 28 98 +250.0% 4.7 4.0 -14.9% Key metrics by report month for the districts of San Fransisco. Current as of September 11, 2016. All data from the San Francisco MLS. Report © 2016 ShowingTime. | 16 Active Listings Sold Listings Median Sales Price Days on Market Months Supply