Contenu connexe Similaire à San Francisco South Beach april 2011 april 2013 Similaire à San Francisco South Beach april 2011 april 2013 (20) Plus de Ronny Budiutama (20) 1. Apr-2013
1,110,000
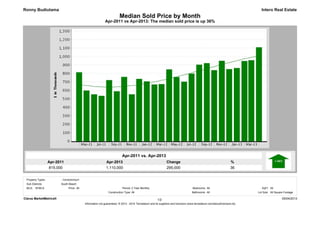
Apr-2011
815,000
%
36
Change
295,000
Apr-2011 vs Apr-2013: The median sold price is up 36%
Median Sold Price by Month
Intero Real Estate
Apr-2011 vs. Apr-2013
Ronny Budiutama
Clarus MarketMetrics® 05/04/2013
Information not guaranteed. © 2013 - 2014 Terradatum and its suppliers and licensors (www.terradatum.com/about/licensors.td).
1/2
MLS: SFMLS Bedrooms:
All
All
Construction Type:
All2 Year Monthly SqFt:
Bathrooms: Lot Size:All All Square Footage
Period:All
Sub Districts:
Property Types: : Condominium
South Beach
Price:
2. Median Sold Price by Month
Apr-2011 vs Apr-2013: The median sold price is up 36%
Intero Real EstateRonny Budiutama
Sold Median Price Units Avg DOMTime Period
Apr-13 1,110,000 30 32
Mar-13 957,500 27 45
Feb-13 947,500 22 50
Jan-13 865,000 20 52
Dec-12 852,000 24 75
Nov-12 950,000 37 35
Oct-12 840,000 25 45
Sep-12 922,500 24 39
Aug-12 905,000 33 39
Jul-12 799,000 27 71
Jun-12 704,000 36 52
May-12 759,000 33 54
Apr-12 849,000 31 57
Mar-12 675,000 31 43
Feb-12 671,000 16 91
Jan-12 707,000 11 62
Dec-11 736,450 16 70
Nov-11 555,000 19 83
Oct-11 760,000 25 61
Sep-11 590,500 24 65
Aug-11 722,500 28 70
Jul-11 536,500 18 67
Jun-11 554,500 24 109
May-11 599,000 17 73
Apr-11 815,000 31 105
Clarus MarketMetrics® 05/04/2013
Information not guaranteed. © 2013 - 2014 Terradatum and its suppliers and licensors (www.terradatum.com/about/licensors.td).
22/
3. Apr-2011 vs Apr-2013: The median price of for sale properties is up 32% and the median price of sold properties is up 36%
Intero Real Estate
Apr-2011 vs. Apr-2013
719,000 32
Ronny Budiutama
949,000
Apr-2013
Median For Sale vs Median Sold
ChangeApr-2011 %
230,000
Apr-2011 Apr-2013 %
815,000 36
Apr-2011 vs. Apr-2013
1,110,000
Change
295,000
Clarus MarketMetrics® 05/04/2013
Information not guaranteed. © 2013 - 2014 Terradatum and its suppliers and licensors (www.terradatum.com/about/licensors.td).
1/2
MLS: SFMLS Bedrooms:
All
All
Construction Type:
All2 Year Monthly SqFt:
Bathrooms: Lot Size:All All Square Footage
Period:All
Sub Districts:
Property Types: : Condominium
South Beach
Price:
4. Median For Sale vs Median Sold
Apr-2011 vs Apr-2013: The median price of for sale properties is up 32% and the median price of sold properties is up 36%
Intero Real EstateRonny Budiutama
For SaleMedian SoldMedian
For Sale # Properties # PropertiesSold Price Difference
Time Period
Apr-13 78 30949,000 1,110,000 161,000
Mar-13 67 271,198,000 957,500 -240,500
Feb-13 59 22998,000 947,500 -50,500
Jan-13 58 201,142,500 865,000 -277,500
Dec-12 59 24899,000 852,000 -47,000
Nov-12 81 37949,000 950,000 1,000
Oct-12 98 25859,500 840,000 -19,500
Sep-12 96 24860,000 922,500 62,500
Aug-12 88 33980,000 905,000 -75,000
Jul-12 88 271,049,500 799,000 -250,500
Jun-12 95 36899,000 704,000 -195,000
May-12 97 33865,000 759,000 -106,000
Apr-12 82 31894,500 849,000 -45,500
Mar-12 90 31839,000 675,000 -164,000
Feb-12 86 16827,000 671,000 -156,000
Jan-12 70 11744,000 707,000 -37,000
Dec-11 60 16739,000 736,450 -2,550
Nov-11 76 19744,000 555,000 -189,000
Oct-11 93 25749,000 760,000 11,000
Sep-11 100 24749,500 590,500 -159,000
Aug-11 117 28750,000 722,500 -27,500
Jul-11 113 18779,000 536,500 -242,500
Jun-11 127 24769,900 554,500 -215,400
May-11 119 17769,000 599,000 -170,000
Apr-11 112 31719,000 815,000 96,000
Clarus MarketMetrics®
Information not guaranteed. © 2013 - 2014 Terradatum and its suppliers and licensors (www.terradatum.com/about/licensors.td).
05/04/201322/
5. Apr-2013
30
Apr-2011
31
%
-3
Change
-1
Apr-2011 vs Apr-2013: The number of Sold properties is down -3%
Sold Properties by Month
Intero Real Estate
Apr-2011 vs. Apr-2013
Ronny Budiutama
Clarus MarketMetrics® 05/04/2013
Information not guaranteed. © 2013 - 2014 Terradatum and its suppliers and licensors (www.terradatum.com/about/licensors.td).
1/2
MLS: SFMLS Bedrooms:
All
All
Construction Type:
All2 Year Monthly SqFt:
Bathrooms: Lot Size:All All Square Footage
Period:All
Sub Districts:
Property Types: : Condominium
South Beach
Price:
6. Sold Properties by Month
Apr-2011 vs Apr-2013: The number of Sold properties is down -3%
Intero Real EstateRonny Budiutama
Time Period
Full Market
Units Median Price Avg DOM
Bank Properties
Units % Bank Median Price
Non-Bank Properties
Units % Non-Bank Median Price
Apr-13 1,110,00030 32 1 3.3 761,000 29 96.7 1,115,000
Mar-13 957,50027 45 0 0.0 27 100.0 957,500
Feb-13 947,50022 50 1 4.5 675,000 21 95.5 975,000
Jan-13 865,00020 52 1 5.0 925,000 19 95.0 855,000
Dec-12 852,00024 75 2 8.3 563,000 22 91.7 900,000
Nov-12 950,00037 35 1 2.7 569,000 36 97.3 975,000
Oct-12 840,00025 45 1 4.0 850,000 24 96.0 835,000
Sep-12 922,50024 39 2 8.3 490,000 22 91.7 1,010,000
Aug-12 905,00033 39 0 0.0 33 100.0 905,000
Jul-12 799,00027 71 2 7.4 317,500 25 92.6 825,000
Jun-12 704,00036 52 5 13.9 544,000 31 86.1 839,000
May-12 759,00033 54 5 15.2 420,100 28 84.8 848,500
Apr-12 849,00031 57 6 19.4 405,000 25 80.6 877,000
Mar-12 675,00031 43 6 19.4 450,000 25 80.6 799,999
Feb-12 671,00016 91 5 31.2 390,000 11 68.8 855,000
Jan-12 707,00011 62 3 27.3 605,000 8 72.7 840,000
Dec-11 736,45016 70 7 43.8 732,900 9 56.2 785,000
Nov-11 555,00019 83 9 47.4 450,000 10 52.6 815,000
Oct-11 760,00025 61 6 24.0 530,000 19 76.0 880,000
Sep-11 590,50024 65 9 37.5 380,000 15 62.5 760,500
Aug-11 722,50028 70 8 28.6 437,500 20 71.4 780,000
Jul-11 536,50018 67 9 50.0 500,000 9 50.0 662,500
Jun-11 554,50024 109 11 45.8 403,000 13 54.2 605,000
May-11 599,00017 73 7 41.2 490,000 10 58.8 734,750
Apr-11 815,00031 105 9 29.0 510,000 22 71.0 887,500
Clarus MarketMetrics® 05/04/2013
Information not guaranteed. © 2013 - 2014 Terradatum and its suppliers and licensors (www.terradatum.com/about/licensors.td).
22/
7. Apr-2013
34
Apr-2011
18
%
89
Change
16
Apr-2011 vs Apr-2013: The number of Under Contract properties is up 89%
Under Contract Properties by Month
Intero Real Estate
Apr-2011 vs. Apr-2013
Ronny Budiutama
Clarus MarketMetrics® 05/04/2013
Information not guaranteed. © 2013 - 2014 Terradatum and its suppliers and licensors (www.terradatum.com/about/licensors.td).
1/2
AllBathrooms: SqFt:
All
: Condominium
All Square FootageConstruction Type: Lot Size:SFMLS
South Beach
Period: 2 Year Monthly
Price:
MLS:
All AllAll
Property Types:
Bedrooms:
Sub Districts:
8. Under Contract Properties by Month
Apr-2011 vs Apr-2013: The number of Under Contract properties is up 89%
Intero Real EstateRonny Budiutama
Median Price UnitsUnits Median Price% Non-Bank
Full Market
% BankAvg DOMMedian Price
Bank Properties
Units
Non-Bank Properties
Time Period
Apr-13 902,00034 28 905,00097.133717,0002.91
Mar-13 1,199,50030 34 1,200,00096.7291,195,0003.31
Feb-13 849,50022 38 849,50090.920939,5009.12
Jan-13 995,00021 58 1,052,50095.220829,0004.81
Dec-12 818,50022 77 852,00090.920648,0009.12
Nov-12 1,049,00025 46 1,049,000100.0250.00
Oct-12 764,00034 44 789,00094.132524,0005.92
Sep-12 825,00024 33 825,000100.0240.00
Aug-12 882,00034 40 910,00094.132787,0005.92
Jul-12 962,50028 62 1,095,00089.325569,00010.73
Jun-12 799,00032 58 809,00093.830453,3006.22
May-12 877,50028 38 877,500100.0280.00
Apr-12 838,50030 46 867,00086.726548,85013.34
Mar-12 769,00033 57 849,00084.828319,00015.25
Feb-12 689,00027 46 849,00085.223471,45014.84
Jan-12 599,00017 80 759,00052.99494,50047.18
Dec-11 899,5008 67 950,00087.57349,00012.51
Nov-11 639,00017 73 798,00041.27498,95058.810
Oct-11 499,90024 83 799,50058.314387,00041.710
Sep-11 894,50022 82 899,00081.818525,95018.24
Aug-11 725,00029 53 754,00075.922588,00024.17
Jul-11 655,00019 57 849,92563.212392,44536.87
Jun-11 539,00019 85 679,00063.212358,00036.87
May-11 539,00019 57 749,00057.911394,00042.18
Apr-11 607,00018 72 615,00061.111546,00038.97
Clarus MarketMetrics® 05/04/2013
Information not guaranteed. © 2013 - 2014 Terradatum and its suppliers and licensors (www.terradatum.com/about/licensors.td).
22/
9. Apr-2013
43
Apr-2011
35
%
23
Change
8
Apr-2011 vs Apr-2013: The number of New properties is up 23%
New Properties by Month
Intero Real Estate
Apr-2011 vs. Apr-2013
Ronny Budiutama
Clarus MarketMetrics® 05/04/2013
Information not guaranteed. © 2013 - 2014 Terradatum and its suppliers and licensors (www.terradatum.com/about/licensors.td).
1/2
MLS: SFMLS Bedrooms:
All
All
Construction Type:
All2 Year Monthly SqFt:
Bathrooms: Lot Size:All All Square Footage
Period:All
Sub Districts:
Property Types: : Condominium
South Beach
Price:
10. New Properties by Month
Apr-2011 vs Apr-2013: The number of New properties is up 23%
Intero Real EstateRonny Budiutama
Median Price UnitsUnits Median Price% Non-Bank
Full Market
% BankMedian Price
Bank Properties
Units
Non-Bank Properties
Time Period
Apr-13 875,00043 0 0.0 43 100.0 875,000
Mar-13 974,50034 1 2.9 1,195,000 33 97.1 950,000
Feb-13 907,00026 1 3.8 717,000 25 96.2 915,000
Jan-13 1,187,00032 2 6.2 925,000 30 93.8 1,187,000
Dec-12 1,082,0008 1 12.5 364,900 7 87.5 1,095,000
Nov-12 998,50030 3 10.0 695,000 27 90.0 1,059,000
Oct-12 859,00038 2 5.3 539,500 36 94.7 874,000
Sep-12 829,50048 0 0.0 48 100.0 829,500
Aug-12 812,00036 0 0.0 36 100.0 812,000
Jul-12 975,00035 4 11.4 661,500 31 88.6 1,050,000
Jun-12 1,062,50034 4 11.8 484,000 30 88.2 1,112,500
May-12 799,00047 2 4.3 478,775 45 95.7 819,000
Apr-12 899,00027 1 3.7 1,099,900 26 96.3 894,500
Mar-12 838,50036 4 11.1 408,850 32 88.9 874,000
Feb-12 839,00040 6 15.0 463,500 34 85.0 859,500
Jan-12 749,90031 7 22.6 499,000 24 77.4 859,000
Dec-11 619,00010 4 40.0 502,400 6 60.0 812,000
Nov-11 704,45016 6 37.5 440,100 10 62.5 1,050,000
Oct-11 845,45022 9 40.9 449,900 13 59.1 1,199,000
Sep-11 799,00023 5 21.7 660,000 18 78.3 859,000
Aug-11 625,00035 12 34.3 600,000 23 65.7 629,000
Jul-11 629,00023 4 17.4 392,900 19 82.6 795,000
Jun-11 655,00039 16 41.0 447,000 23 59.0 975,000
May-11 799,00037 7 18.9 375,000 30 81.1 914,000
Apr-11 629,00035 12 34.3 484,000 23 65.7 729,000
Clarus MarketMetrics® 05/04/2013
Information not guaranteed. © 2013 - 2014 Terradatum and its suppliers and licensors (www.terradatum.com/about/licensors.td).
22/
11. Apr-2013
78
Apr-2011
112
%
-30
Change
-34
Apr-2011 vs Apr-2013: The number of For Sale properties is down -30%
For Sale Properties by Month
Intero Real Estate
Apr-2011 vs. Apr-2013
Ronny Budiutama
Clarus MarketMetrics® 05/04/2013
Information not guaranteed. © 2013 - 2014 Terradatum and its suppliers and licensors (www.terradatum.com/about/licensors.td).
1/2
MLS: SFMLS Bedrooms:
All
All
Construction Type:
All2 Year Monthly SqFt:
Bathrooms: Lot Size:All All Square Footage
Period:All
Sub Districts:
Property Types: : Condominium
South Beach
Price:
12. For Sale Properties by Month
Apr-2011 vs Apr-2013: The number of For Sale properties is down -30%
Intero Real EstateRonny Budiutama
Median Price UnitsUnits Median Price% Non-Bank
Full Market
% BankAvg DOMMedian Price
Bank Properties
Units
Non-Bank Properties
Time Period
Apr-13 949,00078 35 3 3.8 600,000 75 96.2 950,000
Mar-13 1,198,00067 41 4 6.0 658,500 63 94.0 1,200,000
Feb-13 998,00059 43 5 8.5 629,000 54 91.5 1,050,000
Jan-13 1,142,50058 55 6 10.3 714,500 52 89.7 1,198,500
Dec-12 899,00059 72 7 11.9 629,000 52 88.1 1,012,000
Nov-12 949,00081 57 6 7.4 662,000 75 92.6 999,000
Oct-12 859,50098 54 6 6.1 599,500 92 93.9 889,000
Sep-12 860,00096 50 7 7.3 599,000 89 92.7 899,000
Aug-12 980,00088 57 10 11.4 600,000 78 88.6 1,049,500
Jul-12 1,049,50088 66 14 15.9 598,500 74 84.1 1,110,000
Jun-12 899,00095 70 13 13.7 569,000 82 86.3 1,010,000
May-12 865,00097 64 10 10.3 553,300 87 89.7 899,000
Apr-12 894,50082 67 12 14.6 599,000 70 85.4 977,000
Mar-12 839,00090 63 16 17.8 498,850 74 82.2 899,000
Feb-12 827,00086 67 17 19.8 499,000 69 80.2 899,000
Jan-12 744,00070 86 19 27.1 499,000 51 72.9 890,000
Dec-11 739,00060 126 18 30.0 489,450 42 70.0 924,000
Nov-11 744,00076 114 26 34.2 489,450 50 65.8 912,000
Oct-11 749,00093 102 30 32.3 462,500 63 67.7 869,000
Sep-11 749,500100 100 27 27.0 465,000 73 73.0 849,000
Aug-11 750,000117 90 30 25.6 537,450 87 74.4 825,000
Jul-11 779,000113 93 27 23.9 486,500 86 76.1 899,000
Jun-11 769,900127 87 33 26.0 419,000 94 74.0 899,000
May-11 769,000119 86 27 22.7 399,000 92 77.3 844,500
Apr-11 719,000112 85 31 27.7 419,000 81 72.3 799,000
Clarus MarketMetrics® 05/04/2013
Information not guaranteed. © 2013 - 2014 Terradatum and its suppliers and licensors (www.terradatum.com/about/licensors.td).
22/
13. Apr-2013
6
Apr-2011
12
%
-50
Change
-6
Apr-2011 vs Apr-2013: The number of Expired properties is down -50%
Expired Properties by Month
Intero Real Estate
Apr-2011 vs. Apr-2013
Ronny Budiutama
05/04/2013Clarus MarketMetrics® 1/2
MLS: SFMLS Bedrooms:
All
All
Construction Type:
All2 Year Monthly SqFt:
Bathrooms: Lot Size:All All Square Footage
Period:All
Sub Districts:
Property Types: : Condominium
South Beach
Price:
14. Expired Properties by Month
Apr-2011 vs Apr-2013: The number of Expired properties is down -50%
Intero Real EstateRonny Budiutama
Median Price Units% BankAvg DOMUnits Median Price
Bank Properties
Units
Non-Bank Properties
% Non-Bank Median Price
Full Market
Apr-13 1,073,5006 93 1 16.7 330,000 5 83.3 1,198,000
Mar-13 857,0002 87 0 0.0 2 100.0 857,000
Feb-13 911,5004 49 0 0.0 4 100.0 911,500
Jan-13 1,877,4504 128 1 25.0 800,000 3 75.0 2,495,000
Dec-12 999,00011 56 1 9.1 364,900 10 90.9 1,049,000
Nov-12 995,0005 103 0 0.0 5 100.0 995,000
Oct-12 869,00013 77 1 7.7 449,950 12 92.3 927,000
Sep-12 1,372,94412 69 3 25.0 599,000 9 75.0 1,695,000
Aug-12 1,310,0006 105 1 16.7 280,000 5 83.3 1,425,000
Jul-12 1,137,5008 92 1 12.5 499,000 7 87.5 1,175,000
Jun-12 1,019,00010 63 1 10.0 660,000 9 90.0 1,099,000
May-12 1,204,5008 70 1 12.5 239,000 7 87.5 1,259,000
Apr-12 969,0002 41 0 0.0 2 100.0 969,000
Mar-12 924,0002 66 0 0.0 2 100.0 924,000
Feb-12 890,0005 218 1 20.0 448,000 4 80.0 919,500
Jan-12 749,0007 92 0 0.0 7 100.0 749,000
Dec-11 599,00013 189 5 38.5 489,900 8 61.5 984,000
Nov-11 879,0009 178 2 22.2 599,500 7 77.8 999,000
Oct-11 785,0009 136 0 0.0 9 100.0 785,000
Sep-11 749,0007 166 2 28.6 574,000 5 71.4 840,000
Aug-11 975,00011 114 1 9.1 1,149,000 10 90.9 962,000
Jul-11 924,00012 141 2 16.7 390,000 10 83.3 1,037,000
Jun-11 889,00018 103 3 16.7 459,000 15 83.3 949,000
May-11 734,00012 100 2 16.7 344,000 10 83.3 784,000
Apr-11 667,50012 106 4 33.3 472,000 8 66.7 714,500
Clarus MarketMetrics® 05/04/2013
Information not guaranteed. © 2013 - 2014 Terradatum and its suppliers and licensors (www.terradatum.com/about/licensors.td).
22/
15. Apr-2011 vs Apr-2013: The number of for sale properties is down -30% and the number of sold properties is down -3%
Intero Real Estate
Apr-2011 vs. Apr-2013
112 -30
Ronny Budiutama
78
Apr-2013
Supply & Demand by Month
ChangeApr-2011 %
-34
Apr-2011 Apr-2013 %
31 -3
Apr-2011 vs. Apr-2013
30
Change
-1
Clarus MarketMetrics® 05/04/2013
Information not guaranteed. © 2013 - 2014 Terradatum and its suppliers and licensors (www.terradatum.com/about/licensors.td).
1/2
MLS: SFMLS Bedrooms:
All
All
Construction Type:
All2 Year Monthly SqFt:
Bathrooms: Lot Size:All All Square Footage
Period:All
Sub Districts:
Property Types: : Condominium
South Beach
Price:
16. Supply & Demand by Month
Apr-2011 vs Apr-2013: The number of for sale properties is down -30% and the number of sold properties is down -3%
Ronny Budiutama Intero Real Estate
For Sale Sold
# Properties
Avg DOM Avg DOM
# Properties
Time Period
Apr-13 35 3278 30
Mar-13 41 4567 27
Feb-13 43 5059 22
Jan-13 55 5258 20
Dec-12 72 7559 24
Nov-12 57 3581 37
Oct-12 54 4598 25
Sep-12 50 3996 24
Aug-12 57 3988 33
Jul-12 66 7188 27
Jun-12 70 5295 36
May-12 64 5497 33
Apr-12 67 5782 31
Mar-12 63 4390 31
Feb-12 67 9186 16
Jan-12 86 6270 11
Dec-11 126 7060 16
Nov-11 114 8376 19
Oct-11 102 6193 25
Sep-11 100 65100 24
Aug-11 90 70117 28
Jul-11 93 67113 18
Jun-11 87 109127 24
May-11 86 73119 17
Apr-11 85 105112 31
Clarus MarketMetrics® 05/04/2013
Information not guaranteed. © 2013 - 2014 Terradatum and its suppliers and licensors (www.terradatum.com/about/licensors.td).
22/
17. Apr-2013
28
Apr-2011
72
%
-62
Change
-45
Apr-2011 vs Apr-2013: The average days on market is down -62%
The Average Days on Market by Month
Intero Real Estate
Apr-2011 vs. Apr-2013
Ronny Budiutama
South Beach
All 2 Year Monthly
Sub Districts:
Period:Price:
Property Types: : Condominium
05/04/20131/2Clarus MarketMetrics®
All Square Footage
Bedrooms: All AllSqFt:
All Lot Size:Bathrooms:AllConstruction Type:
MLS: SFMLS
18. The Average Days on Market by Month
Apr-2011 vs Apr-2013: The average days on market is down -62%
Intero Real EstateRonny Budiutama
# UC UnitsAvg DOMTime Period
Apr-13 3428
Mar-13 3034
Feb-13 2238
Jan-13 2158
Dec-12 2277
Nov-12 2546
Oct-12 3444
Sep-12 2433
Aug-12 3440
Jul-12 2862
Jun-12 3258
May-12 2838
Apr-12 3046
Mar-12 3357
Feb-12 2746
Jan-12 1780
Dec-11 867
Nov-11 1773
Oct-11 2483
Sep-11 2282
Aug-11 2953
Jul-11 1957
Jun-11 1985
May-11 1957
Apr-11 1872
Clarus MarketMetrics® 2/2 05/04/2013
Information not guaranteed. © 2013 - 2014 Terradatum and its suppliers and licensors (www.terradatum.com/about/licensors.td).
19. Apr-2011 vs Apr-2013: The average months supply of inventory is down -75%
Intero Real Estate
Apr-2011 vs. Apr-2013
4.6 -75
Ronny Budiutama
1.1
Apr-2013
Months Supply of Inventory
ChangeApr-2011 %
-3.4
Clarus MarketMetrics® 05/04/2013
Information not guaranteed. © 2013 - 2014 Terradatum and its suppliers and licensors (www.terradatum.com/about/licensors.td).
1/2
MLS: SFMLS Bedrooms:
All
All
Construction Type:
All2 Year Monthly SqFt:
Bathrooms: Lot Size:All All Square Footage
Period:All
Sub Districts:
Property Types: : Condominium
South Beach
Price:
20. Months Supply of Inventory
Apr-2011 vs Apr-2013: The average months supply of inventory is down -75%
Ronny Budiutama Intero Real Estate
During MonthLast Day of Month MSI
# Units For Sale # UC Units
UC Avg DOMTime Period
Apr-13 34 2838 1.1
Mar-13 30 3435 1.2
Feb-13 22 3833 1.5
Jan-13 21 5833 1.6
Dec-12 22 7726 1.2
Nov-12 25 4651 2.0
Oct-12 34 4451 1.5
Sep-12 24 3360 2.5
Aug-12 34 4048 1.4
Jul-12 28 6252 1.9
Jun-12 32 5853 1.7
May-12 28 3861 2.2
Apr-12 30 4650 1.7
Mar-12 33 5755 1.7
Feb-12 27 4654 2.0
Jan-12 17 8046 2.7
Dec-11 8 6739 4.9
Nov-11 17 7350 2.9
Oct-11 24 8360 2.5
Sep-11 22 8271 3.2
Aug-11 29 5377 2.7
Jul-11 19 5782 4.3
Jun-11 19 8590 4.7
May-11 19 5788 4.6
Apr-11 18 7282 4.6
Clarus MarketMetrics® 05/04/2013
Information not guaranteed. © 2013 - 2014 Terradatum and its suppliers and licensors (www.terradatum.com/about/licensors.td).
22/