Asea > April 2012 Human Performance Study: Questions and Answers
ASEA > Endurance Performance Study
1. Effects of ASEA beverage intake on endurance performance in mice
Amy M. Knab, David C. Nieman, R. Andrew Shanely, Jennifer J. Zwetsloot, Lynn Cialdella-Kam, Mary Pat Meaney.
Human Performance Laboratory, Appalachian State University, North Carolina Research Campus, Kannapolis, NC
Background
Results
► ASEA™ is a saline-based beverage that undergoes a proprietary process and contains reactive
redox-signaling molecules.
Table 1: Treadmill Endurance Protocol
CPT-1 Content
(arbitrary units)
31P
NMR spectrum of a mixture of DIPPMPO and ASEA beverage.
Green numbers are peak chemical shifts, red numbers are integral
values of corresponding peaks.
SE
A
A
Se
de
R
nt
ar
un
y
un
R
A
1.0
0.5
A
SE
A
R
un
y
nt
ar
Se
de
SE
A
de
nt
ar
y
Se
un
0.0
A
-HAD enzyme activity was measured
in muscle tissue. No significant
differences between sedentary groups
or run groups (p>0.05).
*#
*
R
un
1.5
Pl
ac
eb
o
Se
de
A
de
nt
ar
y
0
SE
A
Se
Pl
ac
eb
o
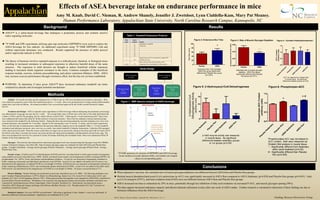
CPT-I as measured by Western Blot
in muscle tissue. No significant
differences between groups (p>0.05).
Figure 6: Phospho/pan-ACC
Phospho/pan-ACC Content
(arbitrary units)
5
Pl
ac
eb
o
de
nt
ar
y
ASEA
Estimated rate of muscle glycogen
depletion. ASEA Run group
significantly different than Placebo
Run group (p=0.017).
10
Se
0.5
R
ug/mg protein/run time (min)
Placebo
15
Pl
ac
eb
o
1.0
0.0
0.00
SE
A
Figure 1: NMR Spectra analysis of ASEA beverage
0.02
Figure 5: -Hydroxyacyl-CoA Dehydrogenase
un
Placebo Run
Group:
N=15
Treadmill
Placebo Sedentary
Group:
N=15
Sedentary (normal
cage activity only)
0.04
Pl
ac
eb
o
Placebo Treatment
(1-week)
1.5
*
Endurance Run Time (minutes)
ASEA Run group significantly
different than Placebo Run group
(p<0.001).
R
ASEA Run Group:
N=15
Treadmill
ASEA Sedentary
Group:
N=15
Sedentary (normal
cage activity only)
ASEA
Pl
ac
eb
o
ASEA Treatment
(1-week)
Glycogen: Post-exercise and end point liver and muscle glycogen levels were assayed using the Glycogen Assay Kit (700480,
Cayman Chemical Company, Ann Arbor MI). Rate of muscle glycogen usage was estimated for both ASEA Run and Placebo Run
groups. Example Calculation: Average muscle glycogen (Placebo Sedentary) – Average muscle glycogen (Placebo Run) / Average
Placebo Run Time.
Statistical Analyses: Two-way ANOVA was performed. Following a significant F-ratio, Student ‘s t-test were performed to
determine differences between treatments. Significance was established at P < 0.05
0
Study Design
Treatment and Design: ASEA or placebo (same ingredients as ASEA beverage without undergoing the proprietary processing)
was administered via gavage once per day for 1-week. The average body mass of all the mice at the start of the study determined the
volume of ASEA used for the gavaging, but the volume did not exceed 0.3mL. Following the 1-week treatment period (7 days) mice
were euthanized and tissues harvested for further analysis of outcome measures. Mice from the endurance testing treatment groups
were oriented to the treadmill in the following fashion: During the three day period preceding the maximal endurance test, mice were
oriented (trained) to the treadmill for 15 min/day. Speeds for the training days were 10 m/min, 15 m/min, and 18 m/min respectively.
Then, on the final day of treatment mice underwent the maximal endurance capacity test on the treadmill (Table 1). For the treadmill
orientation and endurance protocols, mice were run on a multi- lane rodent treadmill (Columbus Instruments, Columbus OH) equipped
with a shock grid at the back. When the mouse could either no longer run (as assessed by sitting on the shock grid with all 4 paws off of
the belt for more than 5 seconds), the mouse was removed from the shock grid immediately and placed back into the home cage. The
mice were monitored for recovery for a period of at least 20 minutes following the orientation bouts. Mice were euthanized within 30
minutes of the final endurance test.
Western Blotting: Western blotting was performed as previously described (Laye et al. 2009). The following antibodies were
used: Carnitine Palmitoyltransferase-1 (CPT1) (Santa Cruz Biotechnology, Santa Cruz, CA), Acetyl-CoA Carboxylase (ACC), and
phospho-ACC (Ser79) (Cell Signaling, Danvers, MA). Whole gastrocnemius homogenates were separated by SDS-PAGE, transferred to
polyvinylidene fluoride membranes. Membranes were exposed to the appropriate primary and secondary antibodies and bands were
visualized by chemiluminescence (Pierce SuperSignal, Fisher Scientific, Rockford, IL). Band density was determined using a
ChemiDoc XRTS Molecular Imager and Image Lab Software (BioRad, Hercules, CA). Phosphorylated-ACC (Ser79) protein was
normalized to total ACC protein.
20
Placebo
Animals: Six-month old male specific pathogen-free C57BL/6 mice (n =60) were purchased from Jackson Laboratory. Mice
were randomly assigned to each of the four treatment groups (n = 15 each). Mice were group housed (3-4/cage) and provided standard
rodent chow and water ad libitum. All animal procedures were reviewed and approved by the North Carolina Research Campus
IACUC.
Enzyme Assays: β-hydroxyacyl-CoA dehydrogenase (β-HAD) activities were determined in whole gastrocnemius homogenates
using methods previously described (Laye, 2009). Briefly, powdered frozen muscle was homogenized in buffer containing HEPES, Na
pyrophosphate, Na+, EDTA, Triton, and protease and phosphatase inhibitors. CS activity was measured in homogenate incubated in
buffer containing oxaloacetate and dithiobis(2-nitrobenzoic acid) (DTNB). Acetyl-CoA was added to the buffer and CS activity was
determined by the appearance of reduced DTNB at a wavelength of 405nm. β-HAD activity was measured in homogenate incubated in
buffer containing triethanolamine, EDTA, and nicotinamide adenine dinucleotide (NADH). Acetyl-CoA was added to the buffer and βHAD activity was determined by the disappearance of NADH at a wavelength of 340nm. All assays were performed at 37°C.
40
Figure 4: Carnitine Palmitoyltransferase I
0.06
SE
A
24
Mice will stay at this speed until they reach
exhaustion (sit on shock grid for 5 full seconds)
60
(arbitrary units)
Methods
22
Speeds between 20-24 correspond to roughly 80%
VO2max for mice
*
80
-Hydroxyacyl-CoA
Dehydrogenase Activity
► PURPOSE: To determine if mice given ASEA™ have increased endurance treadmill run times
compared to placebo and investigate potential mechanisms.
2- end
100
A
► The theory of hormesis involves repeated exposure to a mild physical, chemical, or biological stress
resulting in increased resistance to subsequent exposures to otherwise harmful doses of the same
stressors. The exposures to mild stressors are thought to induce beneficial cellular responses
leading to increased whole organism resistance to the stress. Common examples of this beneficial
response include, exercise, ischemic preconditioning, and caloric restriction (Mattson, 2008). ASEA
may increase exercise performance through a hormesis effect, but this has not yet been established.
Details
adjustment to treadmill
"warm up"
Figure 3: Rate of Muscle Glycogen Depletion
y
2
Figure 2: Endurance Run Time
nt
ar
► 31P NMR and EPR experiments utilizing spin trap molecules (DIPPMPO) were used to explore the
ASEA beverage for free radicals. An additional experiment using 31P NMR DIPPMPO with and
without superoxide dismutase was conducted. Results supported the presence of stable peroxyl
and/or superoxide radicals in ASEA.
Speed
(m/min)
0
10
12
14
16
18
20
Run Time (min)
Time
(min)
1
5
2
2
2
2
2
Phosphorylated ACC was normalized to
ACC content. Both were measured via
Western Blot analysis in muscle tissue.
* - Significantly different from Sedentary
within same treatment (p=0.02)
# - Significantly different than Placebo
Run (p=0.045)
Conclusions
► When adjusted to run time, the estimated rate of muscle glycogen depletion was different between ASEA Run and Placebo Run groups.
► Skeletal muscle phosphorylated acetyl-CoA carboxylase (p-ACC) was significantly increased in ASEA Run compared to ASEA Sedentary (p=0.020) and Placebo Run groups (p=0.045). Fatty
acyl CoA transport (CPT1), and beta-oxidation (beta-HAD) were not different between ASEA Run and Placebo Run groups.
► ASEA increased run time to exhaustion by 29% in mice, potentially through less inhibition of fatty acid oxidation via increased P-ACC, and muscle glycogen sparing (30%).
► The data support increased endurance capacity and altered substrate utilization in mice after one week of ASEA intake. Further research is warranted to determine if these findings are due to
hormesis influences from the ASEA beverage.
Mark P. Mattson. Hormesis Defined. Ageing Res Rev. 2008 January; 7(1): 1-7
Funding, Reoxcyn Discoveries Group