McDonald's Options are Trading Rich - Super Sized Volatility
•
1 j'aime•331 vues

Actionable trade ideas for stock market investors and traders seeking alpha by overlaying their portfolios with options, other derivatives, ETFs, and disciplined and applied Game Theory for hedge fund managers and other active fund managers worldwide. Ryan Renicker, CFA

Recommandé
Contenu connexe
Similaire à McDonald's Options are Trading Rich - Super Sized Volatility
Similaire à McDonald's Options are Trading Rich - Super Sized Volatility (20)
Plus de RYAN RENICKER
Plus de RYAN RENICKER (20)
Dernier
Dernier (20)
McDonald's Options are Trading Rich - Super Sized Volatility
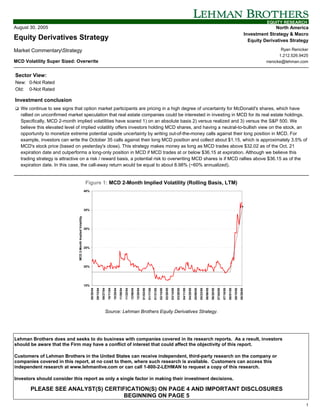
- 1. EQUITY RESEARCH August 30, 2005 North America Investment Strategy & Macro Equity Derivatives Strategy Equity Derivatives Strategy Market CommentaryStrategy Ryan Renicker 1.212.526.9425 MCD Volatility Super Sized: Overwrite rrenicke@lehman.com Sector View: New: 0-Not Rated Old: 0-Not Rated Investment conclusion ! We continue to see signs that option market participants are pricing in a high degree of uncertainty for McDonald's shares, which have rallied on unconfirmed market speculation that real estate companies could be interested in investing in MCD for its real estate holdings. Specifically, MCD 2-month implied volatilities have soared 1) on an absolute basis 2) versus realized and 3) versus the S&P 500. We believe this elevated level of implied volatility offers investors holding MCD shares, and having a neutral-to-bullish view on the stock, an opportunity to monetize extreme potential upside uncertainty by writing out-of-the-money calls against their long position in MCD. For example, investors can write the October 35 calls against their long MCD position and collect about $1.15, which is approximately 3.5% of MCD's stock price (based on yesterday's close). This strategy makes money as long as MCD trades above $32.02 as of the Oct. 21 expiration date and outperforms a long-only position in MCD if MCD trades at or below $36.15 at expiration. Although we believe this trading strategy is attractive on a risk / reward basis, a potential risk to overwriting MCD shares is if MCD rallies above $36.15 as of the expiration date. In this case, the call-away return would be equal to about 8.98% (~60% annualized). Figure 1: MCD 2-Month Implied Volatility (Rolling Basis, LTM) 40% 35% MCD 2-Month Implied Volatility 30% 25% 20% 15% 08/30/04 09/13/04 09/27/04 10/11/04 10/25/04 11/08/04 11/22/04 12/06/04 12/20/04 01/03/05 01/17/05 01/31/05 02/14/05 02/28/05 03/14/05 03/28/05 04/11/05 04/25/05 05/09/05 05/23/05 06/06/05 06/20/05 07/04/05 07/18/05 08/01/05 08/15/05 08/29/05 Source: Lehman Brothers Equity Derivatives Strategy. Lehman Brothers does and seeks to do business with companies covered in its research reports. As a result, investors should be aware that the Firm may have a conflict of interest that could affect the objectivity of this report. Customers of Lehman Brothers in the United States can receive independent, third-party research on the company or companies covered in this report, at no cost to them, where such research is available. Customers can access this independent research at www.lehmanlive.com or can call 1-800-2-LEHMAN to request a copy of this research. Investors should consider this report as only a single factor in making their investment decisions. PLEASE SEE ANALYST(S) CERTIFICATION(S) ON PAGE 4 AND IMPORTANT DISCLOSURES BEGINNING ON PAGE 5 1
- 2. EQUITY RESEARCH • We continue to see signs that option market participants are pricing in a high degree of uncertainty for McDonald’s (MCD) shares which, since early August, have rallied on speculation that real estate companies could be interested in investing in MCD for its real estate holdings. • Specifically, MCD 2-month implied volatilities have soared 1) on an absolute basis 2) versus realized and 3) versus the S&P 500 Index. Please see Figures 2 – 4 for each of these measures in a graphical context. Figure 2: MCD 2-Month Implied Volatility, Stock Price (LTM) 40% $35 MCD 2-Month Implied Volatility MCD Stock Price $34 35% $33 $32 Implied Volatility 30% $31 Stock Price $30 25% $29 $28 20% $27 $26 15% $25 08/30/04 09/14/04 09/28/04 10/12/04 10/26/04 11/09/04 11/23/04 12/08/04 12/22/04 01/06/05 01/21/05 02/04/05 02/18/05 03/07/05 03/21/05 04/05/05 04/19/05 05/03/05 05/17/05 06/01/05 06/15/05 06/29/05 07/14/05 07/28/05 08/11/05 08/25/05 Source: Lehman Brothers Equity Derivatives Strategy. Figure 3: MCD 2M – 44 Trading Day Realized Vol. Spread (LTM) 12% 10% MCD Implied - Realized Vol. Spread 8% 6% 4% 2% 0% -2% -4% 08/30/04 09/13/04 09/27/04 10/11/04 10/25/04 11/08/04 11/22/04 12/06/04 12/20/04 01/03/05 01/17/05 01/31/05 02/14/05 02/28/05 03/14/05 03/28/05 04/11/05 04/25/05 05/09/05 05/23/05 06/06/05 06/20/05 07/04/05 07/18/05 08/01/05 08/15/05 Source: Lehman Brothers Equity Derivatives Strategy. Figure 4: MCD vs. SPX 2M Implied Vol. Spread (LTM) 25% 20% MCD - S&P500 2M IVOL Spread 15% 10% 5% 0% 08/30/04 09/13/04 09/27/04 10/11/04 10/25/04 11/08/04 11/22/04 12/06/04 12/20/04 01/03/05 01/17/05 01/31/05 02/14/05 02/28/05 03/14/05 03/28/05 04/11/05 04/25/05 05/09/05 05/23/05 06/06/05 06/20/05 07/04/05 07/18/05 08/01/05 08/15/05 08/29/05 Source: Lehman Brothers Equity Derivatives Strategy. 2
- 3. EQUITY RESEARCH • We believe this elevated level of implied volatility offers investors holding MCD shares – and having a neutral-to-bullish view on the stock – an opportunity to monetize extreme upside uncertainty by writing short-dated out-of-the-money calls against their long underlying position in MCD. • For example, investors can write the October 35 calls against their long MCD position and collect about $1.15, which is approximately 3.5% of MCD’s stock price (Figures 5 and 6). All prices in this report are as of the close of trading on Monday, August 29, 2005. Figure 5: Payoff Diagram: MCD Oct. 35 Overwrite vs. Stock-Only (Prices as Monday, August 29, 2005) Overwrite Payoff $4 Stock-Only Payoff $2 Payoff at Expiration $- $(2) Overwrite Outperforms Stock-Only Strategy $(4) $(6) $27.50 $30.00 $32.50 $35.00 $37.50 Stock Price at Expiry Source: Lehman Brothers Equity Derivatives Strategy. Figure 6: MCD Historical Stock Price vs. Approx. Overwrite Profit Range (in Brackets) $37 $36 $3 $35 $34 Make $ $33 MCD (Closing Price) $32 $0 $31 $30 $29 $28 $27 $26 $25 08/30/04 09/30/04 10/30/04 11/30/04 12/30/04 01/30/05 02/28/05 03/30/05 04/30/05 05/30/05 06/30/05 07/30/05 08/30/05 09/30/05 Source: Lehman Brothers Equity Derivatives Strategy. • This strategy makes money as long as MCD trades above $32.02 as of the October 21 expiration date and outperforms a long-only position in MCD shares if MCD trades at or below $36.15 at expiration. • Although we believe this trading strategy is attractive on a risk / reward basis, a potential risk to overwriting MCD shares versus holding a long position outright is if MCD rallies above $36.15 as of the expiration date ($35 exercise price + $1.15 premium = $36.15). • Under this scenario, the overwrite position would underperform the long-only strategy (opportunity cost above $36.15). In other words, the holding period return for the overwriting strategy is capped at only 8.98% (~60% annualized). • One catalyst that could impact MCD shares is the company’s September 21 – 22 analyst conference. In addition, the company is th expected to report earnings on October 19 . 3
- 4. EQUITY RESEARCH Options are not suitable for all investors and the risks of option trading should be weighed against the potential rewards. Supporting documents that form the basis of the recommendations are available on request. Please note that the trade ideas within this report in no way relate to the fundamental ratings applied to European stocks by Lehman Brothers' Equity Research. Analyst Certification: I, Ryan Renicker, hereby certify (1) that the views expressed in this research Industry Note accurately reflect my personal views about any or all of the subject securities or issuers referred to in this Industry Note and (2) no part of my compensation was, is or will be directly or indirectly related to the specific recommendations or views expressed in this Industry Note. 4
- 5. EQUITY RESEARCH Important Disclosures Rating and Price Target Chart: MCD MCDONALD'S CORP. As of 23-Aug-2005 Currency = USD 42.00 40.00 38.00 36.00 34.00 32.00 30.00 28.00 26.00 24.00 22.00 20.00 18.00 16.00 14.00 12.00 10.00 8-02 11-02 2-03 5-03 8-03 11-03 2-04 5-04 8-04 11-04 2-05 5-05 8-05 Closing Price Price Target Recommendation Change Drop Coverage Source: FactSet Date Closing Price Rating Price Target Date Closing Price Rating Price Target 08-Jun-05 29.23 37.00 21-May-03 17.30 21.00 08-Mar-05 33.48 40.00 21-May-03 17.30 1-Overweight 08-Mar-05 33.48 1-Overweight 27-Feb-03 13.25 17.50 05-May-04 27.81 Dropped 17-Jan-03 15.45 19.00 09-Mar-04 28.98 35.00 17-Dec-02 15.99 2-Equal weight 04-Mar-04 28.84 33.00 17-Oct-02 17.83 21.00 23-Oct-03 24.00 30.00 17-Sep-02 18.91 24.00 09-Sep-03 23.59 27.00 05-Aug-02 23.84 3-Underweight 10-Jul-03 22.26 26.00 FOR EXPLANATION OF RATINGS REFER TO THE STOCK RATING KEYS LOCATED ON THE PAGE FOLLOWING THE LAST PRICE CHART 5
- 6. EQUITY RESEARCH Important Disclosures: The analysts responsible for preparing this report have received compensation based upon various factors including the Firm’s total revenues, a portion of which is generated by investment banking activities. Related Stocks: Disclosures Ticker Price (08/26) Rating McDonald's Corp. J MCD 33.17 1-Overweight J - Lehman Brothers Inc. or an affiliate trade(s) regularly in the shares of the subject company. Risk Disclosure: MCD: Competition, specifically related to price, service, location, personnel and quality of food, is the most significant risk faced by companies in the restaurant industry. If there were a significant change in the competitive landscape from current levels, our earnings forecast, rating and price target would have to be reconsidered. Other risks that would require us to review our investment thesis include food safety, including the effects of food borne illness, changes in interest rates, foreign currency exchange rates, commodity prices and government regulation surrounding the restaurant industry. Guide to Lehman Brothers Equity Research Rating System: Our coverage analysts use a relative rating system in which they rate stocks as 1-Overweight, 2- Equal weight or 3-Underweight (see definitions below) relative to other companies covered by the analyst or a team of analysts that are deemed to be in the same industry sector (the “sector coverage universe”). To see a list of the companies that comprise a particular sector coverage universe, please go to www.lehman.com/disclosures In addition to the stock rating, we provide sector views which rate the outlook for the sector coverage universe as 1-Positive, 2-Neutral or 3-Negative (see definitions below). A rating system using terms such as buy, hold and sell is not the equivalent of our rating system. Investors should carefully read the entire research report including the definitions of all ratings and not infer its contents from ratings alone. Stock Rating 1-Overweight - The stock is expected to outperform the unweighted expected total return of the sector coverage universe over a 12-month investment horizon. 2-Equal weight - The stock is expected to perform in line with the unweighted expected total return of the sector coverage universe over a 12- month investment horizon. 3-Underweight - The stock is expected to underperform the unweighted expected total return of the sector coverage universe over a 12- month investment horizon. RS-Rating Suspended - The rating and target price have been suspended temporarily to comply with applicable regulations and/or firm policies in certain circumstances including when Lehman Brothers is acting in an advisory capacity in a merger or strategic transaction involving the company. Sector View 1-Positive - sector coverage universe fundamentals/valuations are improving. 2-Neutral - sector coverage universe fundamentals/valuations are steady, neither improving nor deteriorating. 3-Negative - sector coverage universe fundamentals/valuations are deteriorating. Stock Ratings From February 2001 to August 5, 2002 (sector view did not exist): This is a guide to expected total return (price performance plus dividend) relative to the total return of the stocks’ local market (i.e. the market where the stock primarily trades) over the next 12 months. 1-Strong Buy - expected to outperform the market by 15 or more percentage points. 2-Buy - expected to outperform the market by 5-15 percentage points. 3-Market Perform - expected to perform in line with the market, plus or minus 5 percentage points. 4-Market Underperform - expected to underperform the market by 5-15 percentage points. 5-Sell - expected to underperform the market by 15 or more percentage points. Distribution of Ratings: Lehman Brothers Global Equity Research has 1745 companies under coverage. 41% have been assigned a 1-Overweight rating which, for purposes of mandatory regulatory disclosures, is classified as Buy rating, 33% of companies with this rating are investment banking clients of the Firm. 42% have been assigned a 2-Equal weight rating which, for purposes of mandatory regulatory disclosures, is classified as Hold rating, 7% of companies with this rating are investment banking clients of the Firm. 17% have been assigned a 3-Underweight rating which, for purposes of mandatory regulatory disclosures, is classified as Sell rating, 85% of companies with this rating are investment banking clients of the Firm. This material has been prepared and/or issued by Lehman Brothers Inc., member SIPC, and/or one of its affiliates (“Lehman Brothers”) and has been approved by Lehman Brothers International (Europe), authorized and regulated by the Financial Services Authority, in connection with its distribution in the European Economic Area. This material is distributed in Japan by Lehman Brothers Japan Inc., and in Hong Kong by Lehman Brothers Asia Limited. This material is distributed in Australia by Lehman Brothers Australia Pty Limited, and in Singapore by Lehman Brothers Inc., Singapore Branch. This material is 6
- 7. EQUITY RESEARCH distributed in Korea by Lehman Brothers International (Europe) Seoul Branch. This document is for information purposes only and it should not be regarded as an offer to sell or as a solicitation of an offer to buy the securities or other instruments mentioned in it. No part of this document may be reproduced in any manner without the written permission of Lehman Brothers. With the exception of disclosures relating to Lehman Brothers, this research report is based on current public information that Lehman Brothers considers reliable, but we make no representation that it is accurate or complete, and it should not be relied on as such. In the case of any disclosure to the effect that Lehman Brothers Inc. or its affiliates beneficially own 1% or more of any class of common equity securities of the subject company, the computation of beneficial ownership of securities is based upon the methodology used to compute ownership under Section 13(d) of the United States' Securities Exchange Act of 1934. In the case of any disclosure to the effect that Lehman Brothers Inc. and/or its affiliates hold a short position of at least 1% of the outstanding share capital of a particular company, such disclosure relates solely to the ordinary share capital of the company. Accordingly, while such calculation represents Lehman Brothers’ holdings net of any long position in the ordinary share capital of the company, such calculation excludes any rights or obligations that Lehman Brothers may otherwise have, or which may accrue in the future, with respect to such ordinary share capital. Similarly such calculation does not include any shares held or owned by Lehman Brothers where such shares are held under a wider agreement or arrangement (be it with a client or a counterparty) concerning the shares of such company (e.g. prime broking and/or stock lending activity). Any such disclosure represents the position of Lehman Brothers as of the last business day of the calendar month preceding the date of this report. This material is provided with the understanding that Lehman Brothers is not acting in a fiduciary capacity. Opinions expressed herein reflect the opinion of Lehman Brothers and are subject to change without notice. The products mentioned in this document may not be eligible for sale in some states or countries, and they may not be suitable for all types of investors. If an investor has any doubts about product suitability, he should consult his Lehman Brothers representative. The value of and the income produced by products may fluctuate, so that an investor may get back less than he invested. Value and income may be adversely affected by exchange rates, interest rates, or other factors. Past performance is not necessarily indicative of future results. If a product is income producing, part of the capital invested may be used to pay that income. © 2005 Lehman Brothers. All rights reserved. Additional information is available on request. Please contact a Lehman Brothers entity in your home jurisdiction. Lehman Brothers policy for managing conflicts of interest in connection with investment research is available at www.lehman.com/researchconflictspolicy. Ratings, earnings per share forecasts and price targets contained in the Firm's equity research reports covering U.S. companies are available at www.lehman.com/disclosures. Complete disclosure information on companies covered by Lehman Brothers Equity Research is available at www.lehman.com/disclosures. 7