
Recommandé
Contenu connexe
Tendances
Tendances (19)
Similaire à Inequalities
Similaire à Inequalities (20)
Inequalities
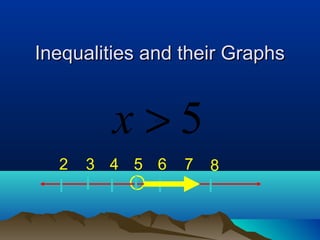
- 1. Inequalities and their Graphs x>5 x>5 2 3 4 5 6 7 8
- 2. Inequalities and their Graphs Objective: To write and graph simple inequalities with one variable
- 3. Inequalities and their Graphs What is a good definition for Inequality? An inequality is a statement that two expressions are not equal 2 3 4 5 6 7 8
- 4. Inequalities and their Graphs Terms you see and need to know to graph inequalities correctly < less than Notice open > greater than circles
- 5. Inequalities and their Graphs Terms you see and need to know to graph inequalities correctly ≤ less than or equal to ≥ greater than or equal to Notice colored in circles
- 6. Inequalities and their Graphs Let’s work a few together Notice: when variable is on left side, sign shows x >3 direction of solution 3
- 7. Inequalities and their Graphs Let’s work a few together Notice: when variable is x<7 on left side, sign shows direction of solution 7
- 8. Inequalities and their Graphs Let’s work a few together Notice: when variable is p ≤ −2 on left side, sign shows direction of solution -2 Color in circle
- 9. Inequalities and their Graphs Let’s work a few together Notice: when variable is x≥8 on left side, sign shows direction of solution 8 Color in circle
- 10. Try this one on your own x > 12
- 11. 12
- 12. On your Own s < 12
- 13. 12
- 14. On your Own m≥2
- 15. 2
- 16. Answer 1 through 5 b ≤ −6 1.
- 17. On your Own x > 10 2.
- 18. On your Own p > − 15 3.
- 19. On your Own g ≥ 25 4.
- 20. On your Own x < 13 5.
- 21. Answers: 1 through 5 1. 2. -6 10 3. 4. -15 25 5. 13
- 22. Answer 6 through 10 b ≤ -7 6.
- 23. On your Own a>8 7.
- 24. On your Own q ≥ -5 8.
- 25. On your Own s < 14 9.
- 26. On your Own m≥8 10.
- 27. Answers: 6 through 10 6. 7. -7 8 8. 9. -5 14 10. 8
- 28. Graphing Inequalities Excellent Job !!! Well Done