SlideShare une entreprise Scribd logo
1  sur  16
Télécharger pour lire hors ligne
Is There Dependence Between Process Maturity, Process Performance?   Ravesteyn, Zoet, Spekschoor & Loggen


  Is There Dependence Between Process Maturity and Process Performance?

                                        Pascal Ravesteyn
                        HU University of Applied Science, The Netherlands
                                     pascal.ravesteijn@hu.nl

                                          Martijn Zoet
                        HU University of Applied Science, The Netherlands
                                       martijn.zoet@hu.nl

                                          Joost Spekschoor
                                    Capgemini, The Netherlands
                                 joost.spekschoor@capgemini.com

                                           Roeland Loggen
                                     Capgemini, The Netherlands
                                   roeland.loggen@capgemini.com


                                            ABSTRACT

During recent years the world has seen rapid changes such as globalization, the Internet, and
the rise of new economies. To survive these changes organizations need to be in control of their
processes, and be able to continuously improve the process performance. Therefore many
organizations are increasingly adopting Business Process Management (BPM). However, it
is not clear if the implementation of BPM(S) is really adding value to an organization.
Consequently, in this paper, we try to answer the following research question: ‘Does adoption of
Business Process Management lead to a higher process performance?’ Based on quantitative
research we show that there is dependence between the performance of processes within an
organization and the BPM maturity of that organization. As a result we conclude that
improvement in process performance can be attained by increasing the BPM maturity of an
organization.

Keywords: Process, maturity, performance, correlation


                                         INTRODUCTION

During the past twenty years the world has seen rapid changes such as globalization, the
adoption of the Internet, mobile communications, and the rise of China and India as important
economies. These developments make it possible and in many cases necessary for organizations
to change their business models. No longer is it possible to cater for the wishes of customers and
consumers as stand-alone companies. Many organizations are outsourcing or off shoring part of

Communications of the IIMA ©2012                       65                         2012 Volume 12 Issue 2
Is There Dependence Between Process Maturity, Process Performance?   Ravesteyn, Zoet, Spekschoor & Loggen


their processes, which enables them to focus on their core competences. By collaborating in ever
growing and changing alliances -virtual organizations or extended enterprises- organizations are
better adapted to cope with increasing competition. To realize such adaptability organizations
need to increase control of their processes in order to be able to continuously improve them.
Therefore many organizations are increasingly adopting Business Process Management (BPM).

Depending on the point of view on the BPM research domain it has either been around for a long
time or it is quite young. One of the first persons to really analyze (manufacturing) workflows
with the aim to improve them was Frederick Winslow Taylor in the early 1880s. Based on his
experiences he wrote The Principles of Scientific Management (1911). However the term
BPM as a label to a specific research area has not been around for more than about two or three
decades, though the idea of process orientated design and analysis of organizations and
supporting this with information systems has a long history starting with Ellis (1979) and Zisman
(1977).

It was not until the mid- and late-nineties before BPM started to emerge as a separate field of
research that aimed at integrating the best elements of both Total Quality Management (TQM)
and Business Process Reengineering (BPR) (Lee & Dale 1997; Elzinga, Horak, Chung-Yee, &
Bruner, 1995; Zairi 1997). Although Information System and Information Technology (IS/IT)
was seen as an important enabler to process management it took until the beginning of this
century before an integrated business and IS/IT approach to process management was envisioned
(Fremantle, Weerawarana, & Khalaf, 2002; van der Aalst, ter Hofstede, & Weske, 2003).

Yet many organizations implementing BPM are hindered by their current IS/IT architecture.
Most large organizations have invested heavily in enterprise systems such as Enterprise Resource
Planning (ERP), Customer Relationship Management (CRM), and Supply Chain Management
(SCM) and now find that these applications are not fully integrated and therefore do not provide
an end-to-end view on their processes, let alone that they are able to control them. This is where
vendors and resellers of Business Process Management Systems (BPMSs) come into play. They
claim that the implementation of a BPMS will enable an organization to increase grip on its
processes by creating transparency (via the modeling of processes), integration of supporting
information systems, and continuous improvement opportunities via real time measurement of
process performance. Whether the future will show if this claim is fully true is unlikely or at least
complex as practice shows (Ernst & Young, 2009) that only one-third of IS/IT projects are
classified as a complete success (success being defined as on time, within budget and delivering
the predefined requirements). As International Data Corporation (IDC) predicts that the revenue
for the BPM market will climb from $1 billion in 2005 to US $3.8 billion by 2012 (Liu, Li, &
Zhao, 2008) the chances on failed BPMS implementation projects increase dramatically and
therefore it is important to know whether the implementation of BPM(S) is really adding value to
an organization. However there is little research on the topic of added value for organizations by
BPM. The most important related research domain is that of process maturity as maturity models
provide organizations the possibility to evaluate organizational processes and identify
opportunities for optimization and thus adding value. Important research in this area is done by
Rosemann, de Bruin, and Hueffner (2004) and Rosemann and de Bruin (2005) on BPM maturity
models, Curtis and Alden (2006) on business process improvement guided by maturity models.

Communications of the IIMA ©2012                       66                         2012 Volume 12 Issue 2
Is There Dependence Between Process Maturity, Process Performance?   Ravesteyn, Zoet, Spekschoor & Loggen


In this paper, we try to answer the following research question: Does adoption of
Business Process Management lead to a higher process performance? To be able to do this we
carried out a quantitative research in the Netherlands into the relation of process maturity
and process performance. The next section describes the research approach and in section 3 the
results are presented. Section 4 gives the conclusions based on this research and section 5
describes future research and discussion.


                                    RESEARCH APPROACH

The research presented in this paper is part of a broader research project on BPM in the
Netherlands (Loggen et al., 2011). For that research, an online survey was developed with
open and closed questions (in Dutch) that (next to general questions) were divided in the
following six parts:

  (i)    Questions on the definition of BPM and the amount of interest BPM receives within the
         organization
 (ii)    Questions on the number of projects within the organization that are executed as being a
         BPM project
 (iii)   Questions on the maturity of BPM within the organization
 (iv)    Questions on the performance of the processes within the organization
  (v)    Questions on future (project) plans in which BPM is involved
 (vi)    Questions on the use of technology in BPM projects

In this paper we only describe in detail the research approach and the results for part 3 and 4 of
the survey (part 5 and 6 are omitted).

The first part of the survey is used to determine how organizations perceive BPM. Based on the
answers, the majority of respondents to this research (58%) defined BPM as a management
discipline that focuses on analyses and implementation of processes to improve the operational
performance as well as the agility of processes. Another (27%) of the respondents stated BPM is
a systematic approach to analyze, (re)engineer, improve and manage a specific process. A small
minority of respondents found BPM to be either a IT project, a cost cutting initiative, or a
process modeling project.

Besides having a similar perspective on BPM, almost all organizations have started BPM
projects within the last 3 years (88,6%). Furthermore 40% of the organizations that participated
in this research executed BPM projects on a tactical level while in 39% of the organizations
BPM is part of the portfolio of the board of directors.

To analyze the maturity of BPM within an organization we constructed 37 questions (items) that
measure 7 dimensions of process maturity (see table 1). Each of the questions could be answered
on a 1 to 5 Likert scale where 1 is ‘totally disagree’ and 5 is ‘totally agree’. The maturity


Communications of the IIMA ©2012                       67                         2012 Volume 12 Issue 2
Is There Dependence Between Process Maturity, Process Performance?   Ravesteyn, Zoet, Spekschoor & Loggen


dimensions are based on the Capability Maturity Model Integrated (CMMI) and research by
Rosemann et al. (2004), Rosemann and de Bruin (2005) and Rosemann, de Bruin, and Power
(2006).

           Dimension                                        Description                            No. of
                                                                                                   Items
Process awareness               Management realizes the importance of a process                       4
                                oriented organization and includes this in its strategy
Process description             Processes and related information within the                          6
                                organization are identified and captured in process
                                descriptions
Measurement of processes        A system to measure and control processes is in place                 5
                                in order to be able to improve processes
Management of processes         Process owners are assigned within the organization                   5
                                whom are “horizontally” responsible for managing
                                processes
Process improvement             The organization strives to continually improve                       6
                                processes and there is a system in place to enable this.
Process resources and knowledge The organization has adequate resources (such as                      4
                                people with process knowledge) to create a “culture
                                of process orientation”
Information Technology          The organization uses IT to design, simulate and                      7
                                execute processes, and to provide real-time
                                measurement information (key performance
                                indicators)

                               Table 1: BPM Maturity Dimensions.

Next to the process maturity we also measured the process performance of an organization. This
was done on the basis of 12 statements that we developed (Table 2, the statements are translated
from Dutch) to measure different process performance characteristics (based on Hüffner, 2007;
Rudden 2007).

The survey was posted online from December 2010 to the end of January 2011 and to get
respondents notifications were sent via news letters to members of the Dutch BPM-Forum,
participants of the 2008 “BPM in the Netherlands” survey and via the database of the Research
Centre for Technology and Innovation of the HU University of Applied Sciences (in total
approximately 1500 persons were reached). The total number of respondents was 168 persons
(about 11.2%).


Communications of the IIMA ©2012                       68                         2012 Volume 12 Issue 2
Is There Dependence Between Process Maturity, Process Performance?   Ravesteyn, Zoet, Spekschoor & Loggen


 Process Performance
                                                             Statement
     Characteristic
Costs                         The processes within the organization are executed against
                              acceptable costs
Traceability                  Processes within the organization are easily traceable (thus
                              transparent)
Efficiency                    Processes within the organization are efficient
Lead-time                     The processes within the organization have an acceptable lead-time
Customer focus                Processes within the organization are customer centric
Continuous improvement        The processes within the organization are continuously being
                              improved
Quality                       The results delivered by processes within the organization are of
                              good quality
Measurability                 Processes within the organization are easily measurable
Employee satisfaction         Processes within the organization contribute to the employee
                              satisfaction
Competitive advantage         The processes within the organization give our organization a
                              competitive advantage
Flexibility                   Processes within the organization can easily be changed
Comprehensibility             Processes within the organization can be understood by everybody

                        Table 2: Statements about Process Performance.


                                              RESULTS

As stated above the total number of respondents amounted to 168 persons. The respondents
represented a cross section of Dutch organizations: 28% governmental organizations (ministries,
provinces, municipalities etc.), 24% financial institutions, 12% business services, 8%
manufacturing companies, 7% logistical service organizations, 5% healthcare, 5% retail, 4%
education & science, and 7% were classified as ‘others’. For ease of analysis we classified all
organizations into three categories 1) private organizations (excluding finance) 2) public
organizations (typically all government organizations) and 3) financial organizations. Since 24%
of the survey respondents consisted of financial organizations we decided to keep this as a
separate category. We also asked the respondents the sizes of their organization (Figure 1).

To get an indication of the experience level of our respondents we first asked if they had any
knowledge about BPM and secondly if they had any practical experience with BPM projects or
initiatives. A large majority of the respondents (77%) stated they had knowledge on BPM and of
this group (42%) also stated that they had a lot of practical experience while the rest (35%) said
to have a limited amount of hands-on experience. Furthermore 19% of the survey contributors
said the did have some knowledge about BPM but no practical experience while 4% had little
knowledge on BPM and no real life experience whatsoever.


Communications of the IIMA ©2012                       69                         2012 Volume 12 Issue 2
Is There Dependence Between Process Maturity, Process Performance?   Ravesteyn, Zoet, Spekschoor & Loggen


                                          12%
                           38%                                       1-100 Small
                                                     24%
                                                                     101-1000 Medium
                                                                     1001-3000 Large
                                       26%
                                                                     > 3000 Very large


                          Figure 1: Company Size (Loggen et al., 2011).

Furthermore we also asked our participants what role or function they had within their
organization. The top five of roles that are mentioned most are:

Management (27)
Consultant (26)
Process manager (25)
Information manager (16)
Business architect (15)

There is relevant variation between the respondents in terms of their sector of employment, size
of the organization, and position within the organization.

Finally we also asked the participants if they would be answering the questions in our survey
from the entire organization perspective (59%) or with a focus on their own business unit
/division (41%). As it turned out there is a clear relationship between the size of the organization
and the answer to this question, the larger the organization the more frequent the focus in the
answers was on the business unit instead of the entire organization.

Based on the above we find that the respondents to our survey are knowledgeable on the topic of
BPM and therefore their answers can be regarded as valid and of high quality.

Process Maturity

As described above the process maturity of an organization was measured in seven different
dimensions by asking 37 different questions. Since it was not mandatory to answer all questions
in the survey the number of respondents that answered the questions on maturity was smaller (N
= 138) than the total number of participants. However this sample is still large enough to present
valid results.


Communications of the IIMA ©2012                       70                          2012 Volume 12 Issue 2
Is There Dependence Between Process Maturity, Process Performance?            Ravesteyn, Zoet, Spekschoor & Loggen


On average across all dimensions and all organizations the BPM maturity was rated 3.02 on a
scale from 1 to 5. This is slightly above the mean of 2.5 and therefore it can be concluded that
overall the organizations participating in this survey are all actively involved in BPM. However
there are some remarkable differences in the averages per organizational type. Financial
organizations are considered to be the most mature with an average of 3.19; while other private
organizations score 3.08 and government organizations only have an average of 2.85 in BPM
maturity. An explanation for this could be that financial organizations were early adopters of
business process management methods and techniques and have therefore had more time to
achieve a higher maturity however we cannot conclude this based on the data from our survey. If
we take a more in-depth view at the 37 items that determine the maturity in each of the
dimensions (see Table 3) the findings become more interesting.

    Process            Process         Measurement       Management         Process           Process         Information
   Awareness          Description      of Processes      of Processes     Improvement        Research &       Technology
                                                                                             Knowledge
      (3.3)              (3.2)             (2.8)              (3.0)           (3.2)             (3.1)             (2.6)
   Work in a        Process               Process       Process owner    Responsibility for    Process    Software for
    process    architecture (3.7)       deliverables    assigned (3.7)        process       resources are   process
   oriented                             defined (3.2)                     improvement is      defined & modeling is used
  manner (3.6)                                                             assigned (3.5) available (3.0)     (3.9)
     Top            Process models Process KPI’s      Process planning Employees are        Training (3.4)   Simulation tools
 management              (3.1)     defined (2.5)        implemented     involved with                         are used (2.1)
 support (3.5)                                              (2.5)      improvements
                                                                            (3.1)
 Strategy &        Work instructions Performance       Process roles Stakeholders are         Process goals Workflow- and
 goals (3.4)        and guidelines targets (related to defined and      involved with        are known and case mgt. is
                         (3.2)        strategy) are     implemented    improvements         actively pursued implemented
                                      defined (2.7)         (3.0)           (3.2)                 (3.1)          (2.6)

 Adoption (2.9)      Roles, tasks and Responsibility for A method for    Improvement           Process    Straight through
                     responsibilities measurements are       process       methods &          knowledge processing were
                           (3.2)           clear (2.8)   management is techniques are        networks are possible (2.9)
                                                          implemented    available (3.1)     implemented
                                                              (2.9)                              (3.1)
                    Stakeholders (3.2)     Process           Process       Continuous                         Business
                                       performance is    compliance and      process                           Activity
                                       evaluated (2.6)      control is  improvement is                    Monitoring (2.2)
                                                          implemented     planned (3.1)
                                                              (3.1)
                  Contribution to                                        Management is                       Software is used
                   strategy (2.8)                                       actively involved                       to improve
                                                                              (3.2)                           processes (1.7)
                                                                                                             IT department is
                                                                                                              involved with
                                                                                                                 process
                                                                                                              improvement
                                                                                                                  (2.6)

                   Table 3: BPM Maturity in Seven Dimensions Based on 37 Items.


Communications of the IIMA ©2012                                71                              2012 Volume 12 Issue 2
Is There Dependence Between Process Maturity, Process Performance?   Ravesteyn, Zoet, Spekschoor & Loggen


The dimension ‘process awareness’ scores highest overall although the item ‘adoption’ scores
comparatively low within that dimension. The corresponding question was: “Are process
changes quickly accepted and adopted by the organization and its employees?” Based on the low
score we can doubt if organizations are able to successfully continuously improve their processes
if improvements are not always readily accepted and adopted. However since the ‘process
improvement’ dimension also scores comparatively high it might be stated that organizations in
the Netherlands are actively pursuing BPM to improve their processes in order to create a
process oriented organization but that adoption of process changes by employees needs
continuous attention and efforts by (process) managers.

The two dimensions that score comparatively low are ‘measurement of process’ and ‘information
technology’. In order to improve processes an organization needs information about how
processes are performing. However based on our survey findings we can assume that many
organizations don’t have key performance indicators defined for their processes, there are no
clear targets for process performance and processes are not evaluated on a regular basis. Thus
while organizations are trying to realize process improvements the information needed to do so is
not readily available nor is their any system in place that defines responsibilities and describes an
evaluation procedure for process measurements. This lack of information that can be used by
management might related to the low score of the items ‘process planning implemented’ and ‘a
method for process management is implemented’. Based on the survey data it is however not
clear which is the cause and which the effect.

The information technology dimension has the overall lowest score while the underlying items
have both the highest score (software for process modeling is used) and the lowest score
(software is used to improve processes) of all 37 items. The score of 3.9 for ‘software for process
modeling is used’ clearly indicates that first and foremost software is being used to only model
processes. Enactment or execution of processes via either straight through processing or the use
of workflow and case management software scores low compared to many of the other items.
Software to simulate processes or to realize real-time process performance measurement (with
business activity monitoring) seems not to be very popular in the BPM initiatives of the
respondents’ organizations. Also process improvement is typically not supported by any IT. The
low maturity scores in the IT dimension are something we didn’t expect beforehand since lot of
the hype on BPM in recent years was created by software vendors and (IT-) consultants in the
BPM domain. So either the developers and consultants are not selling as much software and
services as we would have expected based on the amount of marketing effort or the software and
services are being sold but do not have any clear effect on the BPM maturity of the end-user
organizations.

Based on the findings described above we believe that in order for organizations to become
really mature in business process management they should put more effort into measuring the
performance of processes and relating this to their process improvement initiatives. Furthermore
vendors and consultants of BPM technology and related services need to realize more added
value in relation to the other six dimensions described in this section.


Communications of the IIMA ©2012                       72                         2012 Volume 12 Issue 2
Is There Dependence Between Process Maturity, Process Performance?   Ravesteyn, Zoet, Spekschoor & Loggen


Process Performance Characteristics

Also for the survey questions related to process performance part it was not mandatory to
provide answers. Only the respondents that answered all questions in this part of the
questionnaire were included in our analysis (N=142). In table 4 an overview is shown of the
values given to the process performance characteristics by the respondents and in figure 2 a more
detailed overview of the answers of the respondents is presented. For each characteristic the
respondents were asked whether they agreed or disagreed that processes within their organization
performed good. For example the 3.01 score for ‘costs’ is based on the following question: ‘Are
processes in your organization executed against acceptable costs?’

                Performance                                 Performance
                                         Value                                         Value
                Characteristic                              Characteristic

        Costs                             3.01      Quality                             3.36

        Traceability                      2.97      Measurability                       2.59

        Efficiency                        2.82      Employee satisfaction               2.90

        Lead-time                         3.06      Competitive advantage               2.82

        Customer focus                    3.29      Flexibility                         2.60

        Continuous improvement            3.17      Comprehensibility                   2.96


            Table 4: Process Performance Characteristics Rated by Respondents.

As can be seen in table 4 ‘quality’ and ‘customer focus’ are the highest scoring process
performance characteristics. This means that according to the respondents the processes in their
organization deliver results of good quality and are customer focused. Likewise the lowest
scoring characteristics are ‘measurability’ and ‘flexibility’ so according to the respondents the
processes in their organization cannot be easily measured (i.e. how is a process performing) and
cannot be easily changed. These findings correspond with the low maturity scores for ‘adoption’
in the process awareness dimension and the overall low score for the dimension ‘measurement of
processes’.

Based on the overall scores we can state that the process performance of the organizations that
participated in this survey is just above average (mean of 2.96 across all characteristics) and
therefore there is much room for improvement.


Communications of the IIMA ©2012                       73                         2012 Volume 12 Issue 2
Is There Dependence Between Process Maturity, Process Performance?               Ravesteyn, Zoet, Spekschoor & Loggen


        Comprehensibility     1.4% 26.7%                     47.3%                24.0% 0.7%
                Flexibility     13.7%           39.0%                 24.0%       19.9% 3.4%
    Competitive advantage      8.2%     23.1%                  49.7%                  16.3%2.7%
     Employee satisfaction    2.7% 23.8%                      54.4%                   18.4%0.7%
            Measurability      6.8%            44.9%                   32.0%           15.6%
                                                                                           0.7%        Totally Disagree
                   Quality    0.0%
                                6.8%            51.0%                         41.5%        0.7%        Disagree

 Continuous improvement       4.1% 21.8%               34.7%                  32.0%      7.5%          Neutral

           Customer focus     1.4%
                                 15.0%            42.2%                       36.1%       5.4%         Agree
                                                                                                       Totally Agree
                Lead time     4.1% 23.3%                37.0%                   33.6%      2.1%
                Efficiency    4.1%      30.8%                   44.5%                 19.9% 0.7%
              Traceability    1.4%      36.7%                 28.6%             30.6%      2.7%
                    Costs     2.0%     28.6%                 38.1%              28.6%      2.7%

                              0%         20%           40%           60%        80%        100%


 Figure 2: Response Related to Process Performance Characteristics (Loggen et al., 2011).

Process Maturity and Performance

To answer our research question (Does adoption of Business Process Management lead to a
higher process performance?) we needed to determine if there is dependence between the
process maturity of an organization and its process performance. For this we did a correlation
analysis (with only those respondents which answered both the maturity and the process
performance questions, N=138) which is shown in figure 3. Each dot represents one organization
and is plotted according to its overall BPM Maturity score across the 7 dimensions and its overall
Process Performance score over the 12 process performance characteristics. Based on this
analysis we can safely assume that there is linear relation between the performance of processes
within an organization and the BPM maturity of that organization.

In addition we also did an analysis for subsets of our data such as organizational size and type of
organization. This however did not provide any significant differences.

Furthermore we also analysed if there is a relation between any of the 7 dimensions and one or
more process performance characteristics, here we didn’t find any significant results. Therefore
we conclude that improvement in process performance can only be reached by heightening the
overall BPM maturity of the organization across all dimensions.


Communications of the IIMA ©2012                                74                                 2012 Volume 12 Issue 2
Is There Dependence Between Process Maturity, Process Performance?   Ravesteyn, Zoet, Spekschoor & Loggen


           Process Performance


                                            BPM Maturity

 Figure 3: Relation between BPM Maturity and Process Performance (Loggen et al., 2011

Finally we analyzed whether there were any differences between the top 10 organizations
with the highest overall process performance score and the 10 organizations that scored lowest.
The reason for this analysis is that we found a remarkable pattern in our regression analysis:
there were organizations that had a different BPM maturity rate and all scored low on
performance. Our assumption was that BPM can be implemented in a way that does not add
value (increase in process performance). Furthermore we did find organizations that had high
scores for both maturity and performance but no organizations that had high scores for
performance with low scores for BPM maturity. From this we conclude that BPM is a required
factor for best in class process performance. To understand the lower score on performance with
varying score on maturity, we analyzed the top and bottom 10 organizations.

We found that highest scoring organizations had a significant higher BPM maturity on the
following six items:

     ‘Management is actively involved’ and ‘Continuous process improvement is planned’
from the dimension ‘process improvement’.

     ‘Work instructions and guidelines’ and ‘Contribution to strategy’ from the dimension
‘process description’.

      ‘Process roles defined and implemented’ from the dimension ‘management of processes’.


Communications of the IIMA ©2012                       75                         2012 Volume 12 Issue 2
Is There Dependence Between Process Maturity, Process Performance?   Ravesteyn, Zoet, Spekschoor & Loggen


      ‘Business Activity Monitoring’ from the dimension ‘information technology’.

From these items ‘management is actively involved’ is being mentioned most often by the
respondents that worked for the top 10 performing organizations. Derived from these results we
conclude that business process management should be implemented in organizations with strong
support of top management in order to be successful and cannot be delegated to a staff or IT
department.


                                          CONCLUSIONS

In this research we tried to answer the question: Does adoption of Business Process Management
lead to a higher process performance?

For this a survey was developed that was put online and to which 168 persons responded. Of this
group a large majority (77%) stated that they had knowledge on BPM and also had more or less
practical experience.

Not all respondents answered the questions on BPM maturity and process performance so the
sample size that was analyzed in order to answer the research question was 138 participants.

We found that (on average) across all dimensions and all organizations the BPM maturity was
rated 3.02 on a scale from 1 to 5, from this we assume that the Dutch organizations are actively
involved in business process management to improve their processes and create a more process
oriented organization. However the level of maturity differs depending on the type of
organization, we found that financial organizations are typically more mature than other private
organizations and that government organizations are the least mature.

Although organizations are getting more mature in their BPM efforts we also found that adoption
of changes by employees needs continuous attention and efforts by management. In addition
many organizations that are trying to improve their processes lack the information needed to do
this and don’t have any system in place that defines responsibilities and describes an evaluation
procedure for process measurements. Therefore a plan-do-check-act cycle cannot be fed with
current information and will be less effective.

As it turned out the Information Technology dimension of BPM maturity had the lowest score,
something we didn’t expect beforehand. This might mean that the BPM software and services
which are being sold do not have a measurable effect on the maturity of the organizations that
acquire such software or services.

For organizations to become really mature in business process management we conclude that
more effort needs to be put into measuring the performance of processes and relating this to
ongoing process improvement initiatives. Furthermore we conclude that business process


Communications of the IIMA ©2012                       76                         2012 Volume 12 Issue 2
Is There Dependence Between Process Maturity, Process Performance?   Ravesteyn, Zoet, Spekschoor & Loggen


management should be implemented in organizations with strong support of top management in
order to be successful and cannot be delegated to a staff or IT department.
To determine the process performance of the organizations participants were asked how they
perceived that their organization was performing on a set of 12 process performance
characteristics. This showed that organizations scored just above average (mean of 2.96 across
all characteristics) which leaves much room for improvement.

Finally we analysed the relation between BPM maturity and process performance. The study we
did shows that there is linear relation (R2 = 0.422) between the performance of processes within
an organization and the BPM maturity of that organization. Therefore we conclude that
improvement in process performance can be attained by increasing the BPM maturity of an
organization.


                           DISCUSSION AND FUTURE RESEARCH

As stated we asked respondents whether they answered the questions from a business unit /
division point of view or from an organizational perspective. Some of the respondents that stated
that they answered the survey from a business unit point of view commented that they didn’t
have an organization wide view on BPM initiatives and maturity. This means that although on a
business unit level the relation between maturity and performance is clear there is no assurance
that this will help these organizations. It seems that in these cases there is no overall management
and control on BPM. Furthermore our respondents group might be biased in their answers.
Typically respondents to a BPM survey tend to be interested in the topic already. This notion is
confirmed by the high rate of experienced and knowledgeable participants. However we find that
this usually adds to the quality of the answers and thus the validity.

To measure the process performance of organizations the respondents were asked to agree or
disagree with twelve statements. However their answers are based on the respondent’s perception
of process performance. Since there were no case studies performed we cannot be entirely sure
that the answers are completely correct.

Furthermore, even though we found a significant relation between BPM maturity and process
performance it is possible that this is caused by a third variable which was not considered in this
research. However since BPM maturity was measured with 37 items and process performance is
based on 12 statements we don’t expect that this is the case.

To further support the findings of this research we want to do several case studies at different
organizations in which quite a few people are interviewed in order to determine the BPM
maturity and process performance levels of that organization and see whether we can still find
the correlation between these two variables.

Additionally we also want to repeat this study in other countries to see if we will find the same
results.


Communications of the IIMA ©2012                       77                         2012 Volume 12 Issue 2
Is There Dependence Between Process Maturity, Process Performance?   Ravesteyn, Zoet, Spekschoor & Loggen


                                           REFERENCES

Curtis, B., & Alden, J. (2006). Business process improvement guided by the BPMM.
       Retrieved April 11, 2011, from http://www.bptrends.com/publicationfiles/11-06-COL-
       BPM%26OrganizationalMaturity-Curtis-Alden-Final1.pdf

Ellis, C. A. (1979). Information control nets: A mathematical model of office information
        flow. Proceedings of the Conference on Simulation, Measurement and Modeling of
        computer systems. Boulder, Colorado.

Elzinga, D. J., Horak, T., Chung-Yee, L., & Bruner, C. (1995). Business process management:
       Survey and methodology. IEEE Transactions on Engineering Management 24(2), 119-
       28.

Ernst & Young. (2009). ICT barometer.. Retrieved May 22, 2010, from http://ict-barometer.
       nl/index.php?/_files-cms/File/Rapport%20ICT%20Barometer%20over%20ICT-
       projecten%20en%20portfoliomanagement%20op%2011%20september%202009.pdf

Fremantle, P., Weerawarana, S., and Khalaf, R. (2002). Enterprise services: Examining the
      emerging field of web services and how it is integrated into existing enterprise
      infrastructures. Communication of the ACM 45(10), 77-82.

Hüffner, T. (2007). The BPM maturity model: Towards a framework for assessing the business
       process management maturity of organizations. Norderstedt, Germany: GRIN Verlag.

Lee, R. G., & Dale, B. G. (1997). Business process management: A review and
      evaluation. Business Process Management Journal 4(3), pp. 214-225. doi:
      10.1108/14637159810224322

Liu, C., Li, Q., & Zhao, X. (2008). Challenges and opportunities in collaborative business
       process management: Overview of recent advances and introduction to the special issue.
       Information Systems Frontiers 11(3), pp. 201-209. Retrieved from http://link.springer.
       com/article/10.1007%2Fs10796-008-9089-0?LI=true#page-1

Loggen, R., Havenith, M., Spekschoor, J., Versendaal, J., & Ravesteyn, P. (2011). Business
      process management in Nederland—2011. Utrecht, Netherlands: Capgemini. Retrieved
      from     http://www.nl.capgemini.com/diensten/themas/business_process_management/
      bpm_survey_2011/

Rosemann, M., & de Bruin, T. (2005). Towards a business process management maturity model.
      Proceedings of the 13th European Conference on Information Systems (ECIS 2005).
      Regensburg, Germany, May 26-28, 2005. Retrieved from http://sdaw.info/asp/aspecis/
      20050045.pdf


Communications of the IIMA ©2012                       78                         2012 Volume 12 Issue 2
Is There Dependence Between Process Maturity, Process Performance?   Ravesteyn, Zoet, Spekschoor & Loggen


Rosemann, M., de Bruin, T., & Hueffner, T. (2004). A model for business process management
      maturity. Conference Proceedings of ACIS 2004. Hobart, Tasmania, Australia, University
      of Tasmania.

Rosemann, M., de Bruin, T., & Power, B. (2006). A m odel to m easure b usiness p rocess
      management maturity and improve performance. In J. Jeston & J. Nelis (Eds). Business
      process management (pp. 299-315). London: Butterworth-Heinemann.

Rudden, J. (2007). Making the case for BPM: A benefits checklist. Retrieved March 16, 2011,
      from      http://www.bptrends.com/publicationfiles/01-07-ART-MakingtheCaseforBPM-
      BenefitsChecklist-Rudden.pdf

Taylor, F. W. (1911). The principles of scientific management. New York, NY: Harper &
       Brothers.

van der Aalst, W. M. P., ter Hofstede, A. H. M., & Weske, M. (2003). Business process
      management: A survey. Proceedings of the 2003 International Conference on Business
      Process Management,1-12.

Zairi, M. (1997). Business process management: A boundaryless approach to modern
       competitiveness. Business Process Management Journal, 3(1), 64-80. doi:
       10.1108/14637159710161585

Zisman, M. D. (1977). Representation, specification and automation of office procedures
      (Unpublished doctoral dissertation). University of Pennsylvania, Warton School of
      Business, Philadelphia, PA.


                                    ACKNOWLEDGEMENTS

We would like to thank Capgemini Netherlands for their sponsorship and contribution to this
research project.


Communications of the IIMA ©2012                       79                         2012 Volume 12 Issue 2
Is There Dependence Between Process Maturity, Process Performance?   Ravesteyn, Zoet, Spekschoor & Loggen


                    This Page Was Left Blank Intentionally.


Communications of the IIMA ©2012                       80                         2012 Volume 12 Issue 2

Contenu connexe

Tendances

Industry 4.0 paradox report
Industry 4.0 paradox reportIndustry 4.0 paradox report
Industry 4.0 paradox report42medien
 
Improve success DevOps
Improve success DevOpsImprove success DevOps
Improve success DevOpsAbhishek Sood
 
Sixfoot4 business architecture
Sixfoot4 business architectureSixfoot4 business architecture
Sixfoot4 business architectureGarth Holloway
 
Office Hours: Top Tips on How to Create an Effective Open Door Policy for You...
Office Hours: Top Tips on How to Create an Effective Open Door Policy for You...Office Hours: Top Tips on How to Create an Effective Open Door Policy for You...
Office Hours: Top Tips on How to Create an Effective Open Door Policy for You...QuekelsBaro
 
Master Thesis proposal Agile Transformation
Master Thesis proposal Agile TransformationMaster Thesis proposal Agile Transformation
Master Thesis proposal Agile TransformationHammad Saif
 
[Process Day 2011] A ELO Group – Apresentação no Process Day
[Process Day 2011] A ELO Group – Apresentação no Process Day [Process Day 2011] A ELO Group – Apresentação no Process Day
[Process Day 2011] A ELO Group – Apresentação no Process Day EloGroup
 
Stakeholder management
Stakeholder managementStakeholder management
Stakeholder managementGarth Holloway
 

Tendances (9)

Industry 4.0 paradox report
Industry 4.0 paradox reportIndustry 4.0 paradox report
Industry 4.0 paradox report
 
Improve success DevOps
Improve success DevOpsImprove success DevOps
Improve success DevOps
 
Sixfoot4 business architecture
Sixfoot4 business architectureSixfoot4 business architecture
Sixfoot4 business architecture
 
Rimb final ppt
Rimb final pptRimb final ppt
Rimb final ppt
 
Office Hours: Top Tips on How to Create an Effective Open Door Policy for You...
Office Hours: Top Tips on How to Create an Effective Open Door Policy for You...Office Hours: Top Tips on How to Create an Effective Open Door Policy for You...
Office Hours: Top Tips on How to Create an Effective Open Door Policy for You...
 
Master Thesis proposal Agile Transformation
Master Thesis proposal Agile TransformationMaster Thesis proposal Agile Transformation
Master Thesis proposal Agile Transformation
 
Sage Business Index 2012
Sage Business Index 2012Sage Business Index 2012
Sage Business Index 2012
 
[Process Day 2011] A ELO Group – Apresentação no Process Day
[Process Day 2011] A ELO Group – Apresentação no Process Day [Process Day 2011] A ELO Group – Apresentação no Process Day
[Process Day 2011] A ELO Group – Apresentação no Process Day
 
Stakeholder management
Stakeholder managementStakeholder management
Stakeholder management
 

Similaire à 9 ciima-2012-12-2-ravesteyn-zoet-capgemini-capgemini-65-80

1820-02141300020S.pdf
1820-02141300020S.pdf1820-02141300020S.pdf
1820-02141300020S.pdfTesfish Hailu
 
BPM And SOA Alignment Maturity Model
BPM And SOA Alignment Maturity ModelBPM And SOA Alignment Maturity Model
BPM And SOA Alignment Maturity ModelAnne Hiemstra
 
Process Day 2010 - EloGroup – Apresentação no Process Day
Process Day 2010 - EloGroup – Apresentação no Process Day Process Day 2010 - EloGroup – Apresentação no Process Day
Process Day 2010 - EloGroup – Apresentação no Process Day EloGroup
 
7 Rights newest invention on information system.
7 Rights newest invention on information system.7 Rights newest invention on information system.
7 Rights newest invention on information system.Md Al Amin Raju
 
State of Project Portfolio Management (PPM) 2013 Research Report
State of Project Portfolio Management (PPM) 2013 Research ReportState of Project Portfolio Management (PPM) 2013 Research Report
State of Project Portfolio Management (PPM) 2013 Research ReportPM Solutions
 
MIS Quarterly Executive Vol. 10 No. 2 Jun 2011 81© 2011 U.docx
MIS Quarterly Executive Vol. 10 No. 2  Jun 2011    81© 2011 U.docxMIS Quarterly Executive Vol. 10 No. 2  Jun 2011    81© 2011 U.docx
MIS Quarterly Executive Vol. 10 No. 2 Jun 2011 81© 2011 U.docxraju957290
 
04 small interventions sepg 2007
04 small interventions sepg 200704 small interventions sepg 2007
04 small interventions sepg 2007Jorge Boria
 
Business process analysis and optimization: A pragmatic approach to business ...
Business process analysis and optimization: A pragmatic approach to business ...Business process analysis and optimization: A pragmatic approach to business ...
Business process analysis and optimization: A pragmatic approach to business ...Mozammel Hoque
 
Re-engineering the design phase of appreciative inquiry_WAIC2015_workshop pap...
Re-engineering the design phase of appreciative inquiry_WAIC2015_workshop pap...Re-engineering the design phase of appreciative inquiry_WAIC2015_workshop pap...
Re-engineering the design phase of appreciative inquiry_WAIC2015_workshop pap...Jan De Winter
 
Enterprise Fusion: Your Pathway To A Better Customer Experience
Enterprise Fusion: Your Pathway To A Better Customer ExperienceEnterprise Fusion: Your Pathway To A Better Customer Experience
Enterprise Fusion: Your Pathway To A Better Customer ExperienceCognizant
 
Running head OVERCOMING CHALLENGES OF IMPLEMENTING PMO2OVERC.docx
Running head OVERCOMING CHALLENGES OF IMPLEMENTING PMO2OVERC.docxRunning head OVERCOMING CHALLENGES OF IMPLEMENTING PMO2OVERC.docx
Running head OVERCOMING CHALLENGES OF IMPLEMENTING PMO2OVERC.docxglendar3
 
Running head OVERCOMING CHALLENGES OF IMPLEMENTING PMO2OVERC.docx
Running head OVERCOMING CHALLENGES OF IMPLEMENTING PMO2OVERC.docxRunning head OVERCOMING CHALLENGES OF IMPLEMENTING PMO2OVERC.docx
Running head OVERCOMING CHALLENGES OF IMPLEMENTING PMO2OVERC.docxtodd581
 
© 2007, David Po-Chedley & Rob St.Germain - 1 - Originally.docx
© 2007, David Po-Chedley & Rob St.Germain - 1 -  Originally.docx© 2007, David Po-Chedley & Rob St.Germain - 1 -  Originally.docx
© 2007, David Po-Chedley & Rob St.Germain - 1 - Originally.docxdurantheseldine
 
process-excellence-2931947
process-excellence-2931947process-excellence-2931947
process-excellence-2931947Mike Metcalf
 
The impact of the digital era on the implementation of lean six sigma
The impact of the digital era on the implementation of lean six sigmaThe impact of the digital era on the implementation of lean six sigma
The impact of the digital era on the implementation of lean six sigmaUduakLuke
 
10%2 D04%20 Art%20 Bp%20 Maturity%20 Model%20%2 D%20 Fisher%2 Epdf
10%2 D04%20 Art%20 Bp%20 Maturity%20 Model%20%2 D%20 Fisher%2 Epdf10%2 D04%20 Art%20 Bp%20 Maturity%20 Model%20%2 D%20 Fisher%2 Epdf
10%2 D04%20 Art%20 Bp%20 Maturity%20 Model%20%2 D%20 Fisher%2 Epdfshinikju
 

Similaire à 9 ciima-2012-12-2-ravesteyn-zoet-capgemini-capgemini-65-80 (20)

1820-02141300020S.pdf
1820-02141300020S.pdf1820-02141300020S.pdf
1820-02141300020S.pdf
 
BPM And SOA Alignment Maturity Model
BPM And SOA Alignment Maturity ModelBPM And SOA Alignment Maturity Model
BPM And SOA Alignment Maturity Model
 
Process Day 2010 - EloGroup – Apresentação no Process Day
Process Day 2010 - EloGroup – Apresentação no Process Day Process Day 2010 - EloGroup – Apresentação no Process Day
Process Day 2010 - EloGroup – Apresentação no Process Day
 
bpm
bpmbpm
bpm
 
7 Rights newest invention on information system.
7 Rights newest invention on information system.7 Rights newest invention on information system.
7 Rights newest invention on information system.
 
State of Project Portfolio Management (PPM) 2013 Research Report
State of Project Portfolio Management (PPM) 2013 Research ReportState of Project Portfolio Management (PPM) 2013 Research Report
State of Project Portfolio Management (PPM) 2013 Research Report
 
MIS Quarterly Executive Vol. 10 No. 2 Jun 2011 81© 2011 U.docx
MIS Quarterly Executive Vol. 10 No. 2  Jun 2011    81© 2011 U.docxMIS Quarterly Executive Vol. 10 No. 2  Jun 2011    81© 2011 U.docx
MIS Quarterly Executive Vol. 10 No. 2 Jun 2011 81© 2011 U.docx
 
Ijetr021207
Ijetr021207Ijetr021207
Ijetr021207
 
Ijetr021207
Ijetr021207Ijetr021207
Ijetr021207
 
04 small interventions sepg 2007
04 small interventions sepg 200704 small interventions sepg 2007
04 small interventions sepg 2007
 
Measuring Business Readiness & Adoption
Measuring Business Readiness & AdoptionMeasuring Business Readiness & Adoption
Measuring Business Readiness & Adoption
 
Business process analysis and optimization: A pragmatic approach to business ...
Business process analysis and optimization: A pragmatic approach to business ...Business process analysis and optimization: A pragmatic approach to business ...
Business process analysis and optimization: A pragmatic approach to business ...
 
Re-engineering the design phase of appreciative inquiry_WAIC2015_workshop pap...
Re-engineering the design phase of appreciative inquiry_WAIC2015_workshop pap...Re-engineering the design phase of appreciative inquiry_WAIC2015_workshop pap...
Re-engineering the design phase of appreciative inquiry_WAIC2015_workshop pap...
 
Enterprise Fusion: Your Pathway To A Better Customer Experience
Enterprise Fusion: Your Pathway To A Better Customer ExperienceEnterprise Fusion: Your Pathway To A Better Customer Experience
Enterprise Fusion: Your Pathway To A Better Customer Experience
 
Running head OVERCOMING CHALLENGES OF IMPLEMENTING PMO2OVERC.docx
Running head OVERCOMING CHALLENGES OF IMPLEMENTING PMO2OVERC.docxRunning head OVERCOMING CHALLENGES OF IMPLEMENTING PMO2OVERC.docx
Running head OVERCOMING CHALLENGES OF IMPLEMENTING PMO2OVERC.docx
 
Running head OVERCOMING CHALLENGES OF IMPLEMENTING PMO2OVERC.docx
Running head OVERCOMING CHALLENGES OF IMPLEMENTING PMO2OVERC.docxRunning head OVERCOMING CHALLENGES OF IMPLEMENTING PMO2OVERC.docx
Running head OVERCOMING CHALLENGES OF IMPLEMENTING PMO2OVERC.docx
 
© 2007, David Po-Chedley & Rob St.Germain - 1 - Originally.docx
© 2007, David Po-Chedley & Rob St.Germain - 1 -  Originally.docx© 2007, David Po-Chedley & Rob St.Germain - 1 -  Originally.docx
© 2007, David Po-Chedley & Rob St.Germain - 1 - Originally.docx
 
process-excellence-2931947
process-excellence-2931947process-excellence-2931947
process-excellence-2931947
 
The impact of the digital era on the implementation of lean six sigma
The impact of the digital era on the implementation of lean six sigmaThe impact of the digital era on the implementation of lean six sigma
The impact of the digital era on the implementation of lean six sigma
 
10%2 D04%20 Art%20 Bp%20 Maturity%20 Model%20%2 D%20 Fisher%2 Epdf
10%2 D04%20 Art%20 Bp%20 Maturity%20 Model%20%2 D%20 Fisher%2 Epdf10%2 D04%20 Art%20 Bp%20 Maturity%20 Model%20%2 D%20 Fisher%2 Epdf
10%2 D04%20 Art%20 Bp%20 Maturity%20 Model%20%2 D%20 Fisher%2 Epdf
 

Plus de rloggen

Adviesrapport dmxy
Adviesrapport dmxyAdviesrapport dmxy
Adviesrapport dmxyrloggen
 
Eindrapport onderzoek ouderen_groep_bory
Eindrapport onderzoek ouderen_groep_boryEindrapport onderzoek ouderen_groep_bory
Eindrapport onderzoek ouderen_groep_boryrloggen
 
Onderzoeksrapport acrs v3.0_definitief
Onderzoeksrapport acrs v3.0_definitiefOnderzoeksrapport acrs v3.0_definitief
Onderzoeksrapport acrs v3.0_definitiefrloggen
 
Eindrapport hartrevalidatie v2.1
Eindrapport hartrevalidatie v2.1Eindrapport hartrevalidatie v2.1
Eindrapport hartrevalidatie v2.1rloggen
 
Carrouselpresentatie 21 01-2016 - roeland loggen - human centric design - vit...
Carrouselpresentatie 21 01-2016 - roeland loggen - human centric design - vit...Carrouselpresentatie 21 01-2016 - roeland loggen - human centric design - vit...
Carrouselpresentatie 21 01-2016 - roeland loggen - human centric design - vit...rloggen
 
Ello2 verbinden generaties - adviesrapport 2.0
Ello2   verbinden generaties - adviesrapport 2.0Ello2   verbinden generaties - adviesrapport 2.0
Ello2 verbinden generaties - adviesrapport 2.0rloggen
 
Vr voor kerkbezoek onderzoeksrapport versie-2
Vr voor kerkbezoek   onderzoeksrapport versie-2Vr voor kerkbezoek   onderzoeksrapport versie-2
Vr voor kerkbezoek onderzoeksrapport versie-2rloggen
 
Slides vitalITylab vs1.0 extern
Slides vitalITylab vs1.0 externSlides vitalITylab vs1.0 extern
Slides vitalITylab vs1.0 externrloggen
 
Presentatie schriftelijke werkstukken vs1.0
Presentatie schriftelijke werkstukken vs1.0Presentatie schriftelijke werkstukken vs1.0
Presentatie schriftelijke werkstukken vs1.0rloggen
 
Resultaten bpm in nederland 2011 low resolution
Resultaten bpm in nederland 2011   low resolutionResultaten bpm in nederland 2011   low resolution
Resultaten bpm in nederland 2011 low resolutionrloggen
 
Bpmrapport2008
Bpmrapport2008Bpmrapport2008
Bpmrapport2008rloggen
 
Case management for_public_sector_web
Case management for_public_sector_webCase management for_public_sector_web
Case management for_public_sector_webrloggen
 
Artikel 4+2 procesmodel v1.0
Artikel 4+2 procesmodel v1.0Artikel 4+2 procesmodel v1.0
Artikel 4+2 procesmodel v1.0rloggen
 
Introduction to case management - Roeland Loggen vs1.1
Introduction to case management - Roeland Loggen vs1.1Introduction to case management - Roeland Loggen vs1.1
Introduction to case management - Roeland Loggen vs1.1rloggen
 
Artikel bpm en groepsdynamica vs1.0
Artikel bpm en groepsdynamica vs1.0Artikel bpm en groepsdynamica vs1.0
Artikel bpm en groepsdynamica vs1.0rloggen
 

Plus de rloggen (15)

Adviesrapport dmxy
Adviesrapport dmxyAdviesrapport dmxy
Adviesrapport dmxy
 
Eindrapport onderzoek ouderen_groep_bory
Eindrapport onderzoek ouderen_groep_boryEindrapport onderzoek ouderen_groep_bory
Eindrapport onderzoek ouderen_groep_bory
 
Onderzoeksrapport acrs v3.0_definitief
Onderzoeksrapport acrs v3.0_definitiefOnderzoeksrapport acrs v3.0_definitief
Onderzoeksrapport acrs v3.0_definitief
 
Eindrapport hartrevalidatie v2.1
Eindrapport hartrevalidatie v2.1Eindrapport hartrevalidatie v2.1
Eindrapport hartrevalidatie v2.1
 
Carrouselpresentatie 21 01-2016 - roeland loggen - human centric design - vit...
Carrouselpresentatie 21 01-2016 - roeland loggen - human centric design - vit...Carrouselpresentatie 21 01-2016 - roeland loggen - human centric design - vit...
Carrouselpresentatie 21 01-2016 - roeland loggen - human centric design - vit...
 
Ello2 verbinden generaties - adviesrapport 2.0
Ello2   verbinden generaties - adviesrapport 2.0Ello2   verbinden generaties - adviesrapport 2.0
Ello2 verbinden generaties - adviesrapport 2.0
 
Vr voor kerkbezoek onderzoeksrapport versie-2
Vr voor kerkbezoek   onderzoeksrapport versie-2Vr voor kerkbezoek   onderzoeksrapport versie-2
Vr voor kerkbezoek onderzoeksrapport versie-2
 
Slides vitalITylab vs1.0 extern
Slides vitalITylab vs1.0 externSlides vitalITylab vs1.0 extern
Slides vitalITylab vs1.0 extern
 
Presentatie schriftelijke werkstukken vs1.0
Presentatie schriftelijke werkstukken vs1.0Presentatie schriftelijke werkstukken vs1.0
Presentatie schriftelijke werkstukken vs1.0
 
Resultaten bpm in nederland 2011 low resolution
Resultaten bpm in nederland 2011   low resolutionResultaten bpm in nederland 2011   low resolution
Resultaten bpm in nederland 2011 low resolution
 
Bpmrapport2008
Bpmrapport2008Bpmrapport2008
Bpmrapport2008
 
Case management for_public_sector_web
Case management for_public_sector_webCase management for_public_sector_web
Case management for_public_sector_web
 
Artikel 4+2 procesmodel v1.0
Artikel 4+2 procesmodel v1.0Artikel 4+2 procesmodel v1.0
Artikel 4+2 procesmodel v1.0
 
Introduction to case management - Roeland Loggen vs1.1
Introduction to case management - Roeland Loggen vs1.1Introduction to case management - Roeland Loggen vs1.1
Introduction to case management - Roeland Loggen vs1.1
 
Artikel bpm en groepsdynamica vs1.0
Artikel bpm en groepsdynamica vs1.0Artikel bpm en groepsdynamica vs1.0
Artikel bpm en groepsdynamica vs1.0
 

9 ciima-2012-12-2-ravesteyn-zoet-capgemini-capgemini-65-80

  • 1. Is There Dependence Between Process Maturity, Process Performance? Ravesteyn, Zoet, Spekschoor & Loggen Is There Dependence Between Process Maturity and Process Performance? Pascal Ravesteyn HU University of Applied Science, The Netherlands pascal.ravesteijn@hu.nl Martijn Zoet HU University of Applied Science, The Netherlands martijn.zoet@hu.nl Joost Spekschoor Capgemini, The Netherlands joost.spekschoor@capgemini.com Roeland Loggen Capgemini, The Netherlands roeland.loggen@capgemini.com ABSTRACT During recent years the world has seen rapid changes such as globalization, the Internet, and the rise of new economies. To survive these changes organizations need to be in control of their processes, and be able to continuously improve the process performance. Therefore many organizations are increasingly adopting Business Process Management (BPM). However, it is not clear if the implementation of BPM(S) is really adding value to an organization. Consequently, in this paper, we try to answer the following research question: ‘Does adoption of Business Process Management lead to a higher process performance?’ Based on quantitative research we show that there is dependence between the performance of processes within an organization and the BPM maturity of that organization. As a result we conclude that improvement in process performance can be attained by increasing the BPM maturity of an organization. Keywords: Process, maturity, performance, correlation INTRODUCTION During the past twenty years the world has seen rapid changes such as globalization, the adoption of the Internet, mobile communications, and the rise of China and India as important economies. These developments make it possible and in many cases necessary for organizations to change their business models. No longer is it possible to cater for the wishes of customers and consumers as stand-alone companies. Many organizations are outsourcing or off shoring part of Communications of the IIMA ©2012 65 2012 Volume 12 Issue 2
  • 2. Is There Dependence Between Process Maturity, Process Performance? Ravesteyn, Zoet, Spekschoor & Loggen their processes, which enables them to focus on their core competences. By collaborating in ever growing and changing alliances -virtual organizations or extended enterprises- organizations are better adapted to cope with increasing competition. To realize such adaptability organizations need to increase control of their processes in order to be able to continuously improve them. Therefore many organizations are increasingly adopting Business Process Management (BPM). Depending on the point of view on the BPM research domain it has either been around for a long time or it is quite young. One of the first persons to really analyze (manufacturing) workflows with the aim to improve them was Frederick Winslow Taylor in the early 1880s. Based on his experiences he wrote The Principles of Scientific Management (1911). However the term BPM as a label to a specific research area has not been around for more than about two or three decades, though the idea of process orientated design and analysis of organizations and supporting this with information systems has a long history starting with Ellis (1979) and Zisman (1977). It was not until the mid- and late-nineties before BPM started to emerge as a separate field of research that aimed at integrating the best elements of both Total Quality Management (TQM) and Business Process Reengineering (BPR) (Lee & Dale 1997; Elzinga, Horak, Chung-Yee, & Bruner, 1995; Zairi 1997). Although Information System and Information Technology (IS/IT) was seen as an important enabler to process management it took until the beginning of this century before an integrated business and IS/IT approach to process management was envisioned (Fremantle, Weerawarana, & Khalaf, 2002; van der Aalst, ter Hofstede, & Weske, 2003). Yet many organizations implementing BPM are hindered by their current IS/IT architecture. Most large organizations have invested heavily in enterprise systems such as Enterprise Resource Planning (ERP), Customer Relationship Management (CRM), and Supply Chain Management (SCM) and now find that these applications are not fully integrated and therefore do not provide an end-to-end view on their processes, let alone that they are able to control them. This is where vendors and resellers of Business Process Management Systems (BPMSs) come into play. They claim that the implementation of a BPMS will enable an organization to increase grip on its processes by creating transparency (via the modeling of processes), integration of supporting information systems, and continuous improvement opportunities via real time measurement of process performance. Whether the future will show if this claim is fully true is unlikely or at least complex as practice shows (Ernst & Young, 2009) that only one-third of IS/IT projects are classified as a complete success (success being defined as on time, within budget and delivering the predefined requirements). As International Data Corporation (IDC) predicts that the revenue for the BPM market will climb from $1 billion in 2005 to US $3.8 billion by 2012 (Liu, Li, & Zhao, 2008) the chances on failed BPMS implementation projects increase dramatically and therefore it is important to know whether the implementation of BPM(S) is really adding value to an organization. However there is little research on the topic of added value for organizations by BPM. The most important related research domain is that of process maturity as maturity models provide organizations the possibility to evaluate organizational processes and identify opportunities for optimization and thus adding value. Important research in this area is done by Rosemann, de Bruin, and Hueffner (2004) and Rosemann and de Bruin (2005) on BPM maturity models, Curtis and Alden (2006) on business process improvement guided by maturity models. Communications of the IIMA ©2012 66 2012 Volume 12 Issue 2
  • 3. Is There Dependence Between Process Maturity, Process Performance? Ravesteyn, Zoet, Spekschoor & Loggen In this paper, we try to answer the following research question: Does adoption of Business Process Management lead to a higher process performance? To be able to do this we carried out a quantitative research in the Netherlands into the relation of process maturity and process performance. The next section describes the research approach and in section 3 the results are presented. Section 4 gives the conclusions based on this research and section 5 describes future research and discussion. RESEARCH APPROACH The research presented in this paper is part of a broader research project on BPM in the Netherlands (Loggen et al., 2011). For that research, an online survey was developed with open and closed questions (in Dutch) that (next to general questions) were divided in the following six parts: (i) Questions on the definition of BPM and the amount of interest BPM receives within the organization (ii) Questions on the number of projects within the organization that are executed as being a BPM project (iii) Questions on the maturity of BPM within the organization (iv) Questions on the performance of the processes within the organization (v) Questions on future (project) plans in which BPM is involved (vi) Questions on the use of technology in BPM projects In this paper we only describe in detail the research approach and the results for part 3 and 4 of the survey (part 5 and 6 are omitted). The first part of the survey is used to determine how organizations perceive BPM. Based on the answers, the majority of respondents to this research (58%) defined BPM as a management discipline that focuses on analyses and implementation of processes to improve the operational performance as well as the agility of processes. Another (27%) of the respondents stated BPM is a systematic approach to analyze, (re)engineer, improve and manage a specific process. A small minority of respondents found BPM to be either a IT project, a cost cutting initiative, or a process modeling project. Besides having a similar perspective on BPM, almost all organizations have started BPM projects within the last 3 years (88,6%). Furthermore 40% of the organizations that participated in this research executed BPM projects on a tactical level while in 39% of the organizations BPM is part of the portfolio of the board of directors. To analyze the maturity of BPM within an organization we constructed 37 questions (items) that measure 7 dimensions of process maturity (see table 1). Each of the questions could be answered on a 1 to 5 Likert scale where 1 is ‘totally disagree’ and 5 is ‘totally agree’. The maturity Communications of the IIMA ©2012 67 2012 Volume 12 Issue 2
  • 4. Is There Dependence Between Process Maturity, Process Performance? Ravesteyn, Zoet, Spekschoor & Loggen dimensions are based on the Capability Maturity Model Integrated (CMMI) and research by Rosemann et al. (2004), Rosemann and de Bruin (2005) and Rosemann, de Bruin, and Power (2006). Dimension Description No. of Items Process awareness Management realizes the importance of a process 4 oriented organization and includes this in its strategy Process description Processes and related information within the 6 organization are identified and captured in process descriptions Measurement of processes A system to measure and control processes is in place 5 in order to be able to improve processes Management of processes Process owners are assigned within the organization 5 whom are “horizontally” responsible for managing processes Process improvement The organization strives to continually improve 6 processes and there is a system in place to enable this. Process resources and knowledge The organization has adequate resources (such as 4 people with process knowledge) to create a “culture of process orientation” Information Technology The organization uses IT to design, simulate and 7 execute processes, and to provide real-time measurement information (key performance indicators) Table 1: BPM Maturity Dimensions. Next to the process maturity we also measured the process performance of an organization. This was done on the basis of 12 statements that we developed (Table 2, the statements are translated from Dutch) to measure different process performance characteristics (based on Hüffner, 2007; Rudden 2007). The survey was posted online from December 2010 to the end of January 2011 and to get respondents notifications were sent via news letters to members of the Dutch BPM-Forum, participants of the 2008 “BPM in the Netherlands” survey and via the database of the Research Centre for Technology and Innovation of the HU University of Applied Sciences (in total approximately 1500 persons were reached). The total number of respondents was 168 persons (about 11.2%). Communications of the IIMA ©2012 68 2012 Volume 12 Issue 2
  • 5. Is There Dependence Between Process Maturity, Process Performance? Ravesteyn, Zoet, Spekschoor & Loggen Process Performance Statement Characteristic Costs The processes within the organization are executed against acceptable costs Traceability Processes within the organization are easily traceable (thus transparent) Efficiency Processes within the organization are efficient Lead-time The processes within the organization have an acceptable lead-time Customer focus Processes within the organization are customer centric Continuous improvement The processes within the organization are continuously being improved Quality The results delivered by processes within the organization are of good quality Measurability Processes within the organization are easily measurable Employee satisfaction Processes within the organization contribute to the employee satisfaction Competitive advantage The processes within the organization give our organization a competitive advantage Flexibility Processes within the organization can easily be changed Comprehensibility Processes within the organization can be understood by everybody Table 2: Statements about Process Performance. RESULTS As stated above the total number of respondents amounted to 168 persons. The respondents represented a cross section of Dutch organizations: 28% governmental organizations (ministries, provinces, municipalities etc.), 24% financial institutions, 12% business services, 8% manufacturing companies, 7% logistical service organizations, 5% healthcare, 5% retail, 4% education & science, and 7% were classified as ‘others’. For ease of analysis we classified all organizations into three categories 1) private organizations (excluding finance) 2) public organizations (typically all government organizations) and 3) financial organizations. Since 24% of the survey respondents consisted of financial organizations we decided to keep this as a separate category. We also asked the respondents the sizes of their organization (Figure 1). To get an indication of the experience level of our respondents we first asked if they had any knowledge about BPM and secondly if they had any practical experience with BPM projects or initiatives. A large majority of the respondents (77%) stated they had knowledge on BPM and of this group (42%) also stated that they had a lot of practical experience while the rest (35%) said to have a limited amount of hands-on experience. Furthermore 19% of the survey contributors said the did have some knowledge about BPM but no practical experience while 4% had little knowledge on BPM and no real life experience whatsoever. Communications of the IIMA ©2012 69 2012 Volume 12 Issue 2
  • 6. Is There Dependence Between Process Maturity, Process Performance? Ravesteyn, Zoet, Spekschoor & Loggen 12% 38% 1-100 Small 24% 101-1000 Medium 1001-3000 Large 26% > 3000 Very large Figure 1: Company Size (Loggen et al., 2011). Furthermore we also asked our participants what role or function they had within their organization. The top five of roles that are mentioned most are: Management (27) Consultant (26) Process manager (25) Information manager (16) Business architect (15) There is relevant variation between the respondents in terms of their sector of employment, size of the organization, and position within the organization. Finally we also asked the participants if they would be answering the questions in our survey from the entire organization perspective (59%) or with a focus on their own business unit /division (41%). As it turned out there is a clear relationship between the size of the organization and the answer to this question, the larger the organization the more frequent the focus in the answers was on the business unit instead of the entire organization. Based on the above we find that the respondents to our survey are knowledgeable on the topic of BPM and therefore their answers can be regarded as valid and of high quality. Process Maturity As described above the process maturity of an organization was measured in seven different dimensions by asking 37 different questions. Since it was not mandatory to answer all questions in the survey the number of respondents that answered the questions on maturity was smaller (N = 138) than the total number of participants. However this sample is still large enough to present valid results. Communications of the IIMA ©2012 70 2012 Volume 12 Issue 2
  • 7. Is There Dependence Between Process Maturity, Process Performance? Ravesteyn, Zoet, Spekschoor & Loggen On average across all dimensions and all organizations the BPM maturity was rated 3.02 on a scale from 1 to 5. This is slightly above the mean of 2.5 and therefore it can be concluded that overall the organizations participating in this survey are all actively involved in BPM. However there are some remarkable differences in the averages per organizational type. Financial organizations are considered to be the most mature with an average of 3.19; while other private organizations score 3.08 and government organizations only have an average of 2.85 in BPM maturity. An explanation for this could be that financial organizations were early adopters of business process management methods and techniques and have therefore had more time to achieve a higher maturity however we cannot conclude this based on the data from our survey. If we take a more in-depth view at the 37 items that determine the maturity in each of the dimensions (see Table 3) the findings become more interesting. Process Process Measurement Management Process Process Information Awareness Description of Processes of Processes Improvement Research & Technology Knowledge (3.3) (3.2) (2.8) (3.0) (3.2) (3.1) (2.6) Work in a Process Process Process owner Responsibility for Process Software for process architecture (3.7) deliverables assigned (3.7) process resources are process oriented defined (3.2) improvement is defined & modeling is used manner (3.6) assigned (3.5) available (3.0) (3.9) Top Process models Process KPI’s Process planning Employees are Training (3.4) Simulation tools management (3.1) defined (2.5) implemented involved with are used (2.1) support (3.5) (2.5) improvements (3.1) Strategy & Work instructions Performance Process roles Stakeholders are Process goals Workflow- and goals (3.4) and guidelines targets (related to defined and involved with are known and case mgt. is (3.2) strategy) are implemented improvements actively pursued implemented defined (2.7) (3.0) (3.2) (3.1) (2.6) Adoption (2.9) Roles, tasks and Responsibility for A method for Improvement Process Straight through responsibilities measurements are process methods & knowledge processing were (3.2) clear (2.8) management is techniques are networks are possible (2.9) implemented available (3.1) implemented (2.9) (3.1) Stakeholders (3.2) Process Process Continuous Business performance is compliance and process Activity evaluated (2.6) control is improvement is Monitoring (2.2) implemented planned (3.1) (3.1) Contribution to Management is Software is used strategy (2.8) actively involved to improve (3.2) processes (1.7) IT department is involved with process improvement (2.6) Table 3: BPM Maturity in Seven Dimensions Based on 37 Items. Communications of the IIMA ©2012 71 2012 Volume 12 Issue 2
  • 8. Is There Dependence Between Process Maturity, Process Performance? Ravesteyn, Zoet, Spekschoor & Loggen The dimension ‘process awareness’ scores highest overall although the item ‘adoption’ scores comparatively low within that dimension. The corresponding question was: “Are process changes quickly accepted and adopted by the organization and its employees?” Based on the low score we can doubt if organizations are able to successfully continuously improve their processes if improvements are not always readily accepted and adopted. However since the ‘process improvement’ dimension also scores comparatively high it might be stated that organizations in the Netherlands are actively pursuing BPM to improve their processes in order to create a process oriented organization but that adoption of process changes by employees needs continuous attention and efforts by (process) managers. The two dimensions that score comparatively low are ‘measurement of process’ and ‘information technology’. In order to improve processes an organization needs information about how processes are performing. However based on our survey findings we can assume that many organizations don’t have key performance indicators defined for their processes, there are no clear targets for process performance and processes are not evaluated on a regular basis. Thus while organizations are trying to realize process improvements the information needed to do so is not readily available nor is their any system in place that defines responsibilities and describes an evaluation procedure for process measurements. This lack of information that can be used by management might related to the low score of the items ‘process planning implemented’ and ‘a method for process management is implemented’. Based on the survey data it is however not clear which is the cause and which the effect. The information technology dimension has the overall lowest score while the underlying items have both the highest score (software for process modeling is used) and the lowest score (software is used to improve processes) of all 37 items. The score of 3.9 for ‘software for process modeling is used’ clearly indicates that first and foremost software is being used to only model processes. Enactment or execution of processes via either straight through processing or the use of workflow and case management software scores low compared to many of the other items. Software to simulate processes or to realize real-time process performance measurement (with business activity monitoring) seems not to be very popular in the BPM initiatives of the respondents’ organizations. Also process improvement is typically not supported by any IT. The low maturity scores in the IT dimension are something we didn’t expect beforehand since lot of the hype on BPM in recent years was created by software vendors and (IT-) consultants in the BPM domain. So either the developers and consultants are not selling as much software and services as we would have expected based on the amount of marketing effort or the software and services are being sold but do not have any clear effect on the BPM maturity of the end-user organizations. Based on the findings described above we believe that in order for organizations to become really mature in business process management they should put more effort into measuring the performance of processes and relating this to their process improvement initiatives. Furthermore vendors and consultants of BPM technology and related services need to realize more added value in relation to the other six dimensions described in this section. Communications of the IIMA ©2012 72 2012 Volume 12 Issue 2
  • 9. Is There Dependence Between Process Maturity, Process Performance? Ravesteyn, Zoet, Spekschoor & Loggen Process Performance Characteristics Also for the survey questions related to process performance part it was not mandatory to provide answers. Only the respondents that answered all questions in this part of the questionnaire were included in our analysis (N=142). In table 4 an overview is shown of the values given to the process performance characteristics by the respondents and in figure 2 a more detailed overview of the answers of the respondents is presented. For each characteristic the respondents were asked whether they agreed or disagreed that processes within their organization performed good. For example the 3.01 score for ‘costs’ is based on the following question: ‘Are processes in your organization executed against acceptable costs?’ Performance Performance Value Value Characteristic Characteristic Costs 3.01 Quality 3.36 Traceability 2.97 Measurability 2.59 Efficiency 2.82 Employee satisfaction 2.90 Lead-time 3.06 Competitive advantage 2.82 Customer focus 3.29 Flexibility 2.60 Continuous improvement 3.17 Comprehensibility 2.96 Table 4: Process Performance Characteristics Rated by Respondents. As can be seen in table 4 ‘quality’ and ‘customer focus’ are the highest scoring process performance characteristics. This means that according to the respondents the processes in their organization deliver results of good quality and are customer focused. Likewise the lowest scoring characteristics are ‘measurability’ and ‘flexibility’ so according to the respondents the processes in their organization cannot be easily measured (i.e. how is a process performing) and cannot be easily changed. These findings correspond with the low maturity scores for ‘adoption’ in the process awareness dimension and the overall low score for the dimension ‘measurement of processes’. Based on the overall scores we can state that the process performance of the organizations that participated in this survey is just above average (mean of 2.96 across all characteristics) and therefore there is much room for improvement. Communications of the IIMA ©2012 73 2012 Volume 12 Issue 2
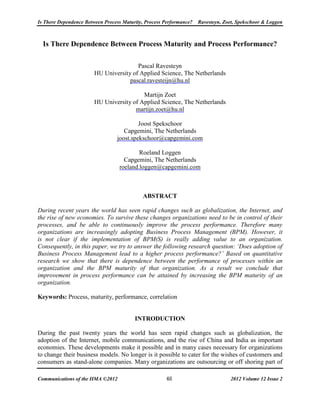
  • 10. Is There Dependence Between Process Maturity, Process Performance? Ravesteyn, Zoet, Spekschoor & Loggen Comprehensibility 1.4% 26.7% 47.3% 24.0% 0.7% Flexibility 13.7% 39.0% 24.0% 19.9% 3.4% Competitive advantage 8.2% 23.1% 49.7% 16.3%2.7% Employee satisfaction 2.7% 23.8% 54.4% 18.4%0.7% Measurability 6.8% 44.9% 32.0% 15.6% 0.7% Totally Disagree Quality 0.0% 6.8% 51.0% 41.5% 0.7% Disagree Continuous improvement 4.1% 21.8% 34.7% 32.0% 7.5% Neutral Customer focus 1.4% 15.0% 42.2% 36.1% 5.4% Agree Totally Agree Lead time 4.1% 23.3% 37.0% 33.6% 2.1% Efficiency 4.1% 30.8% 44.5% 19.9% 0.7% Traceability 1.4% 36.7% 28.6% 30.6% 2.7% Costs 2.0% 28.6% 38.1% 28.6% 2.7% 0% 20% 40% 60% 80% 100% Figure 2: Response Related to Process Performance Characteristics (Loggen et al., 2011). Process Maturity and Performance To answer our research question (Does adoption of Business Process Management lead to a higher process performance?) we needed to determine if there is dependence between the process maturity of an organization and its process performance. For this we did a correlation analysis (with only those respondents which answered both the maturity and the process performance questions, N=138) which is shown in figure 3. Each dot represents one organization and is plotted according to its overall BPM Maturity score across the 7 dimensions and its overall Process Performance score over the 12 process performance characteristics. Based on this analysis we can safely assume that there is linear relation between the performance of processes within an organization and the BPM maturity of that organization. In addition we also did an analysis for subsets of our data such as organizational size and type of organization. This however did not provide any significant differences. Furthermore we also analysed if there is a relation between any of the 7 dimensions and one or more process performance characteristics, here we didn’t find any significant results. Therefore we conclude that improvement in process performance can only be reached by heightening the overall BPM maturity of the organization across all dimensions. Communications of the IIMA ©2012 74 2012 Volume 12 Issue 2
  • 11. Is There Dependence Between Process Maturity, Process Performance? Ravesteyn, Zoet, Spekschoor & Loggen Process Performance BPM Maturity Figure 3: Relation between BPM Maturity and Process Performance (Loggen et al., 2011 Finally we analyzed whether there were any differences between the top 10 organizations with the highest overall process performance score and the 10 organizations that scored lowest. The reason for this analysis is that we found a remarkable pattern in our regression analysis: there were organizations that had a different BPM maturity rate and all scored low on performance. Our assumption was that BPM can be implemented in a way that does not add value (increase in process performance). Furthermore we did find organizations that had high scores for both maturity and performance but no organizations that had high scores for performance with low scores for BPM maturity. From this we conclude that BPM is a required factor for best in class process performance. To understand the lower score on performance with varying score on maturity, we analyzed the top and bottom 10 organizations. We found that highest scoring organizations had a significant higher BPM maturity on the following six items: ‘Management is actively involved’ and ‘Continuous process improvement is planned’ from the dimension ‘process improvement’. ‘Work instructions and guidelines’ and ‘Contribution to strategy’ from the dimension ‘process description’. ‘Process roles defined and implemented’ from the dimension ‘management of processes’. Communications of the IIMA ©2012 75 2012 Volume 12 Issue 2
  • 12. Is There Dependence Between Process Maturity, Process Performance? Ravesteyn, Zoet, Spekschoor & Loggen ‘Business Activity Monitoring’ from the dimension ‘information technology’. From these items ‘management is actively involved’ is being mentioned most often by the respondents that worked for the top 10 performing organizations. Derived from these results we conclude that business process management should be implemented in organizations with strong support of top management in order to be successful and cannot be delegated to a staff or IT department. CONCLUSIONS In this research we tried to answer the question: Does adoption of Business Process Management lead to a higher process performance? For this a survey was developed that was put online and to which 168 persons responded. Of this group a large majority (77%) stated that they had knowledge on BPM and also had more or less practical experience. Not all respondents answered the questions on BPM maturity and process performance so the sample size that was analyzed in order to answer the research question was 138 participants. We found that (on average) across all dimensions and all organizations the BPM maturity was rated 3.02 on a scale from 1 to 5, from this we assume that the Dutch organizations are actively involved in business process management to improve their processes and create a more process oriented organization. However the level of maturity differs depending on the type of organization, we found that financial organizations are typically more mature than other private organizations and that government organizations are the least mature. Although organizations are getting more mature in their BPM efforts we also found that adoption of changes by employees needs continuous attention and efforts by management. In addition many organizations that are trying to improve their processes lack the information needed to do this and don’t have any system in place that defines responsibilities and describes an evaluation procedure for process measurements. Therefore a plan-do-check-act cycle cannot be fed with current information and will be less effective. As it turned out the Information Technology dimension of BPM maturity had the lowest score, something we didn’t expect beforehand. This might mean that the BPM software and services which are being sold do not have a measurable effect on the maturity of the organizations that acquire such software or services. For organizations to become really mature in business process management we conclude that more effort needs to be put into measuring the performance of processes and relating this to ongoing process improvement initiatives. Furthermore we conclude that business process Communications of the IIMA ©2012 76 2012 Volume 12 Issue 2
  • 13. Is There Dependence Between Process Maturity, Process Performance? Ravesteyn, Zoet, Spekschoor & Loggen management should be implemented in organizations with strong support of top management in order to be successful and cannot be delegated to a staff or IT department. To determine the process performance of the organizations participants were asked how they perceived that their organization was performing on a set of 12 process performance characteristics. This showed that organizations scored just above average (mean of 2.96 across all characteristics) which leaves much room for improvement. Finally we analysed the relation between BPM maturity and process performance. The study we did shows that there is linear relation (R2 = 0.422) between the performance of processes within an organization and the BPM maturity of that organization. Therefore we conclude that improvement in process performance can be attained by increasing the BPM maturity of an organization. DISCUSSION AND FUTURE RESEARCH As stated we asked respondents whether they answered the questions from a business unit / division point of view or from an organizational perspective. Some of the respondents that stated that they answered the survey from a business unit point of view commented that they didn’t have an organization wide view on BPM initiatives and maturity. This means that although on a business unit level the relation between maturity and performance is clear there is no assurance that this will help these organizations. It seems that in these cases there is no overall management and control on BPM. Furthermore our respondents group might be biased in their answers. Typically respondents to a BPM survey tend to be interested in the topic already. This notion is confirmed by the high rate of experienced and knowledgeable participants. However we find that this usually adds to the quality of the answers and thus the validity. To measure the process performance of organizations the respondents were asked to agree or disagree with twelve statements. However their answers are based on the respondent’s perception of process performance. Since there were no case studies performed we cannot be entirely sure that the answers are completely correct. Furthermore, even though we found a significant relation between BPM maturity and process performance it is possible that this is caused by a third variable which was not considered in this research. However since BPM maturity was measured with 37 items and process performance is based on 12 statements we don’t expect that this is the case. To further support the findings of this research we want to do several case studies at different organizations in which quite a few people are interviewed in order to determine the BPM maturity and process performance levels of that organization and see whether we can still find the correlation between these two variables. Additionally we also want to repeat this study in other countries to see if we will find the same results. Communications of the IIMA ©2012 77 2012 Volume 12 Issue 2
  • 14. Is There Dependence Between Process Maturity, Process Performance? Ravesteyn, Zoet, Spekschoor & Loggen REFERENCES Curtis, B., & Alden, J. (2006). Business process improvement guided by the BPMM. Retrieved April 11, 2011, from http://www.bptrends.com/publicationfiles/11-06-COL- BPM%26OrganizationalMaturity-Curtis-Alden-Final1.pdf Ellis, C. A. (1979). Information control nets: A mathematical model of office information flow. Proceedings of the Conference on Simulation, Measurement and Modeling of computer systems. Boulder, Colorado. Elzinga, D. J., Horak, T., Chung-Yee, L., & Bruner, C. (1995). Business process management: Survey and methodology. IEEE Transactions on Engineering Management 24(2), 119- 28. Ernst & Young. (2009). ICT barometer.. Retrieved May 22, 2010, from http://ict-barometer. nl/index.php?/_files-cms/File/Rapport%20ICT%20Barometer%20over%20ICT- projecten%20en%20portfoliomanagement%20op%2011%20september%202009.pdf Fremantle, P., Weerawarana, S., and Khalaf, R. (2002). Enterprise services: Examining the emerging field of web services and how it is integrated into existing enterprise infrastructures. Communication of the ACM 45(10), 77-82. Hüffner, T. (2007). The BPM maturity model: Towards a framework for assessing the business process management maturity of organizations. Norderstedt, Germany: GRIN Verlag. Lee, R. G., & Dale, B. G. (1997). Business process management: A review and evaluation. Business Process Management Journal 4(3), pp. 214-225. doi: 10.1108/14637159810224322 Liu, C., Li, Q., & Zhao, X. (2008). Challenges and opportunities in collaborative business process management: Overview of recent advances and introduction to the special issue. Information Systems Frontiers 11(3), pp. 201-209. Retrieved from http://link.springer. com/article/10.1007%2Fs10796-008-9089-0?LI=true#page-1 Loggen, R., Havenith, M., Spekschoor, J., Versendaal, J., & Ravesteyn, P. (2011). Business process management in Nederland—2011. Utrecht, Netherlands: Capgemini. Retrieved from http://www.nl.capgemini.com/diensten/themas/business_process_management/ bpm_survey_2011/ Rosemann, M., & de Bruin, T. (2005). Towards a business process management maturity model. Proceedings of the 13th European Conference on Information Systems (ECIS 2005). Regensburg, Germany, May 26-28, 2005. Retrieved from http://sdaw.info/asp/aspecis/ 20050045.pdf Communications of the IIMA ©2012 78 2012 Volume 12 Issue 2
  • 15. Is There Dependence Between Process Maturity, Process Performance? Ravesteyn, Zoet, Spekschoor & Loggen Rosemann, M., de Bruin, T., & Hueffner, T. (2004). A model for business process management maturity. Conference Proceedings of ACIS 2004. Hobart, Tasmania, Australia, University of Tasmania. Rosemann, M., de Bruin, T., & Power, B. (2006). A m odel to m easure b usiness p rocess management maturity and improve performance. In J. Jeston & J. Nelis (Eds). Business process management (pp. 299-315). London: Butterworth-Heinemann. Rudden, J. (2007). Making the case for BPM: A benefits checklist. Retrieved March 16, 2011, from http://www.bptrends.com/publicationfiles/01-07-ART-MakingtheCaseforBPM- BenefitsChecklist-Rudden.pdf Taylor, F. W. (1911). The principles of scientific management. New York, NY: Harper & Brothers. van der Aalst, W. M. P., ter Hofstede, A. H. M., & Weske, M. (2003). Business process management: A survey. Proceedings of the 2003 International Conference on Business Process Management,1-12. Zairi, M. (1997). Business process management: A boundaryless approach to modern competitiveness. Business Process Management Journal, 3(1), 64-80. doi: 10.1108/14637159710161585 Zisman, M. D. (1977). Representation, specification and automation of office procedures (Unpublished doctoral dissertation). University of Pennsylvania, Warton School of Business, Philadelphia, PA. ACKNOWLEDGEMENTS We would like to thank Capgemini Netherlands for their sponsorship and contribution to this research project. Communications of the IIMA ©2012 79 2012 Volume 12 Issue 2
  • 16. Is There Dependence Between Process Maturity, Process Performance? Ravesteyn, Zoet, Spekschoor & Loggen This Page Was Left Blank Intentionally. Communications of the IIMA ©2012 80 2012 Volume 12 Issue 2