SlideShare une entreprise Scribd logo
1  sur  11
Unit 3 Part 2


                  Food
                Pyramids
                 p. 95-100
Define Food Pyramid

•   Diagram showing each
    trophic level as a horizontal   LESS
    bar.

•   Producers are located on
    bottom

•   Higher consumers are
    placed on top of each
    other.
                                    MORE
•   Each bar is drawn in
    proportion to the mass of
    organisms

•   More mass at the lower
    levels, less at the top…
    hence the triangular shape!
Why are there fewer organisms at each trophic level?
P. 97


If humans became primary
consumers only, then more of
the human population could be
supported.


•   As you go up the food chain, less energy is available at each higher
    level.

•   (1/10th of lower level). Remember 90% is used up!

•   Organisms higher up have to eat MORE food from lower levels to
    survive.

•   Therefore, fewer organisms can obtain energy to live = fewer
    organisms are at each higher level.
Higher means Less!
The higher up you go, there is less:
a. Mass of organisms         –     food pyramid
b. Number of organisms       –     pyramid of numbers
c. Amount of energy          –     energy pyramid
Why is this pyramid upside down?


 Biological
Amplification
Why is this pyramid upside down?


     Biological
    Amplification


• Biological Amplification is the tendency of pollutants/toxins
  to become more concentrated in higher trophic levels.

• Often, this is to the detriment of the higher order organisms in
  which these materials concentrate, since the pollutants are
  often toxic.

• Also referred to as Biological magnification
Biological Amplification – simplified!

• FACT! - Some toxins (DDT
  & mercury) are stored in
  fat and are NOT water
  soluble or excreted.

• Plants/organisms at lower
  levels take in toxins.

• Animals higher up eat
  MANY of these lower
  organisms to obtain
  enough energy.

• Taking in MORE toxins as
  well = build up of toxins is
  much higher in these
  higher up consumers.
Consumer- eats 3 fox   Coyote   = 300 units of toxins
                                      built up


 Consumer- eats 5       Fox     = 100 units of toxins
     rabbits                          built up


 Consumer- eats 20     Rabbit   = 20 units of toxins
      shrubs                          built up


     Producer          Shrub      = 1 unit of toxin
How do food pyramids help explain DDT
amplification? P. 97 (Handout!!)

•   DDT was a particularly dangerous toxin because
    it is fat soluble and stays in an animal's fat. (Some
    poisons are water soluble and can be excreted from the system.)


•   Lower order organisms ingest some poison
    which is store in their fat.

•   Higher order organisms eat large numbers of
    lower order organisms. (Ex. A small amount in a frog
    becomes large in a hawk that eats 100 frogs.
Introduction of new species?
• What could be the probable impact that:


• the recent arrival of coyotes on the island of
  Newfoundland may have on the local ecosystem?

• the introduction of snowshoe hare or even the
  moose to the island of Newfoundland?

• the introduction of chinch bugs when it arrived
  through sods imported from mainland Canada?
Possible Effects ???
• Elimination/disruption of their food sources/species.

• Competition for food sources may cause decline or
  endanger other native species that eat same food source.
• Diseases or DANGER may be introduced causing decline
  or disruption.
• May cause interruption or decline in economic activity
  related to lost/declining species. (ex. Moose & Caribou)
• Financial cost to subsequently control new species.

• May cause the CREATION OF NEW BUSINESSES… to
  control the species, tourism etc..
• The new plant/animal could be a FOOD SOURCE for the local
  ecosystem.

Contenu connexe

Tendances

Natural resources 2
Natural resources  2Natural resources  2
Natural resources 2roshanrm
 
Selective breeding powerpoint
Selective breeding powerpointSelective breeding powerpoint
Selective breeding powerpointhannahreed
 

Tendances (20)

Crossbreeding with Katahdins
Crossbreeding with KatahdinsCrossbreeding with Katahdins
Crossbreeding with Katahdins
 
Integrating Anthelmintics, FAMACHA and Other Alternative Measures for Control...
Integrating Anthelmintics, FAMACHA and Other Alternative Measures for Control...Integrating Anthelmintics, FAMACHA and Other Alternative Measures for Control...
Integrating Anthelmintics, FAMACHA and Other Alternative Measures for Control...
 
Barber Pole Worm: #1 Killer
Barber Pole Worm: #1 KillerBarber Pole Worm: #1 Killer
Barber Pole Worm: #1 Killer
 
Natural parasite control in small ruminants
Natural parasite control in small ruminantsNatural parasite control in small ruminants
Natural parasite control in small ruminants
 
Strategies for Improving Parasite Management on Tennessee Sheep farms
Strategies for Improving Parasite Management on Tennessee Sheep farmsStrategies for Improving Parasite Management on Tennessee Sheep farms
Strategies for Improving Parasite Management on Tennessee Sheep farms
 
Winning against worms
Winning against wormsWinning against worms
Winning against worms
 
Preventing and treating coccidiosis
Preventing and treating coccidiosisPreventing and treating coccidiosis
Preventing and treating coccidiosis
 
MaintainingHoofHealth
MaintainingHoofHealthMaintainingHoofHealth
MaintainingHoofHealth
 
TheBigFiveTopics
TheBigFiveTopicsTheBigFiveTopics
TheBigFiveTopics
 
Sericea lespedeza
Sericea lespedeza Sericea lespedeza
Sericea lespedeza
 
Deworming right
Deworming rightDeworming right
Deworming right
 
Targeted grazing
Targeted grazingTargeted grazing
Targeted grazing
 
When deworming is not enough
When deworming is not enoughWhen deworming is not enough
When deworming is not enough
 
Current recommendations for internal parasite control in small ruminants
Current recommendations for internal parasite control in small ruminantsCurrent recommendations for internal parasite control in small ruminants
Current recommendations for internal parasite control in small ruminants
 
Natural resources 2
Natural resources  2Natural resources  2
Natural resources 2
 
Sheep 101
Sheep 101Sheep 101
Sheep 101
 
Animal Breeding
Animal BreedingAnimal Breeding
Animal Breeding
 
Selective breeding powerpoint
Selective breeding powerpointSelective breeding powerpoint
Selective breeding powerpoint
 
Nutrition for Small-Scale Goat Farms
Nutrition for Small-Scale Goat FarmsNutrition for Small-Scale Goat Farms
Nutrition for Small-Scale Goat Farms
 
Causes & Treatment of Diarrhoea in Cattle
Causes & Treatment of Diarrhoea in CattleCauses & Treatment of Diarrhoea in Cattle
Causes & Treatment of Diarrhoea in Cattle
 

Similaire à Unit 3 lesson 2 food pyramids

1 food chains and webs edexcel new mp
1 food chains and webs edexcel new mp1 food chains and webs edexcel new mp
1 food chains and webs edexcel new mpMrs Parker
 
Sampling and Ecosystems
Sampling and EcosystemsSampling and Ecosystems
Sampling and EcosystemsMrs Parker
 
Ap Bio ch 37 Communties & Ecosystems PPT
Ap Bio ch 37 Communties & Ecosystems PPTAp Bio ch 37 Communties & Ecosystems PPT
Ap Bio ch 37 Communties & Ecosystems PPTzernwoman
 
FoodChains CSEC PowerPoint Presentation for students
FoodChains CSEC PowerPoint Presentation for studentsFoodChains CSEC PowerPoint Presentation for students
FoodChains CSEC PowerPoint Presentation for studentsStephanSamuels1
 
Ecosystem functioning: food webs and trophicl evels.ppt
Ecosystem functioning:  food webs and trophicl evels.pptEcosystem functioning:  food webs and trophicl evels.ppt
Ecosystem functioning: food webs and trophicl evels.pptSumant Saini
 
Ch18.4&16.4&30-Biodiversity.ppt
Ch18.4&16.4&30-Biodiversity.pptCh18.4&16.4&30-Biodiversity.ppt
Ch18.4&16.4&30-Biodiversity.pptJanetBarcimo1
 
CHAPER 5 ECOSYTEM AND BEHAVIOR OF THE ANIMAL KINGDOM
CHAPER 5 ECOSYTEM AND BEHAVIOR OF THE ANIMAL KINGDOMCHAPER 5 ECOSYTEM AND BEHAVIOR OF THE ANIMAL KINGDOM
CHAPER 5 ECOSYTEM AND BEHAVIOR OF THE ANIMAL KINGDOMJarizaBravo4
 
Types of interactions
Types of interactionsTypes of interactions
Types of interactionsKerriep7
 
AQA Unit 4 A2 Biology
AQA Unit 4 A2 BiologyAQA Unit 4 A2 Biology
AQA Unit 4 A2 BiologyJosh Wanklyn
 
AP Biology Community Ecology
AP Biology Community Ecology AP Biology Community Ecology
AP Biology Community Ecology Stephanie Beck
 
Types of interactions
Types of interactionsTypes of interactions
Types of interactionsjdrinks
 
Biomagnification and 10% law
Biomagnification and 10% lawBiomagnification and 10% law
Biomagnification and 10% lawdivya rajput
 
Food chain,food web and ecological pyramids
Food chain,food web and ecological pyramidsFood chain,food web and ecological pyramids
Food chain,food web and ecological pyramidssaksheebhaiswar
 
Foodchainfoodwebandecologicalcycle 140302224948-phpapp02
Foodchainfoodwebandecologicalcycle 140302224948-phpapp02Foodchainfoodwebandecologicalcycle 140302224948-phpapp02
Foodchainfoodwebandecologicalcycle 140302224948-phpapp02nitifamous2234
 
Foodchain foodweb and ecological cycle
Foodchain foodweb and ecological cycleFoodchain foodweb and ecological cycle
Foodchain foodweb and ecological cycleCU UNIVERSITY
 
Cool australia biodiversity 9 & 10 presentation
Cool australia biodiversity 9 & 10 presentationCool australia biodiversity 9 & 10 presentation
Cool australia biodiversity 9 & 10 presentationTheanicholas
 

Similaire à Unit 3 lesson 2 food pyramids (20)

1 food chains and webs edexcel new mp
1 food chains and webs edexcel new mp1 food chains and webs edexcel new mp
1 food chains and webs edexcel new mp
 
The Biosphere
The BiosphereThe Biosphere
The Biosphere
 
Sampling and Ecosystems
Sampling and EcosystemsSampling and Ecosystems
Sampling and Ecosystems
 
Ap Bio ch 37 Communties & Ecosystems PPT
Ap Bio ch 37 Communties & Ecosystems PPTAp Bio ch 37 Communties & Ecosystems PPT
Ap Bio ch 37 Communties & Ecosystems PPT
 
Ecology Notes
Ecology NotesEcology Notes
Ecology Notes
 
FoodChains CSEC PowerPoint Presentation for students
FoodChains CSEC PowerPoint Presentation for studentsFoodChains CSEC PowerPoint Presentation for students
FoodChains CSEC PowerPoint Presentation for students
 
Ecosystem functioning: food webs and trophicl evels.ppt
Ecosystem functioning:  food webs and trophicl evels.pptEcosystem functioning:  food webs and trophicl evels.ppt
Ecosystem functioning: food webs and trophicl evels.ppt
 
Ch18.4&16.4&30-Biodiversity.ppt
Ch18.4&16.4&30-Biodiversity.pptCh18.4&16.4&30-Biodiversity.ppt
Ch18.4&16.4&30-Biodiversity.ppt
 
CHAPER 5 ECOSYTEM AND BEHAVIOR OF THE ANIMAL KINGDOM
CHAPER 5 ECOSYTEM AND BEHAVIOR OF THE ANIMAL KINGDOMCHAPER 5 ECOSYTEM AND BEHAVIOR OF THE ANIMAL KINGDOM
CHAPER 5 ECOSYTEM AND BEHAVIOR OF THE ANIMAL KINGDOM
 
Types of interactions
Types of interactionsTypes of interactions
Types of interactions
 
AQA Unit 4 A2 Biology
AQA Unit 4 A2 BiologyAQA Unit 4 A2 Biology
AQA Unit 4 A2 Biology
 
AP Biology Community Ecology
AP Biology Community Ecology AP Biology Community Ecology
AP Biology Community Ecology
 
Types of interactions
Types of interactionsTypes of interactions
Types of interactions
 
Biomagnification and 10% law
Biomagnification and 10% lawBiomagnification and 10% law
Biomagnification and 10% law
 
Food chain,food web and ecological pyramids
Food chain,food web and ecological pyramidsFood chain,food web and ecological pyramids
Food chain,food web and ecological pyramids
 
Foodchainfoodwebandecologicalcycle 140302224948-phpapp02
Foodchainfoodwebandecologicalcycle 140302224948-phpapp02Foodchainfoodwebandecologicalcycle 140302224948-phpapp02
Foodchainfoodwebandecologicalcycle 140302224948-phpapp02
 
Foodchain foodweb and ecological cycle
Foodchain foodweb and ecological cycleFoodchain foodweb and ecological cycle
Foodchain foodweb and ecological cycle
 
Cool australia biodiversity 9 & 10 presentation
Cool australia biodiversity 9 & 10 presentationCool australia biodiversity 9 & 10 presentation
Cool australia biodiversity 9 & 10 presentation
 
Entomophagy
EntomophagyEntomophagy
Entomophagy
 
ange.pptx
ange.pptxange.pptx
ange.pptx
 

Dernier

Accessible design: Minimum effort, maximum impact
Accessible design: Minimum effort, maximum impactAccessible design: Minimum effort, maximum impact
Accessible design: Minimum effort, maximum impactdawncurless
 
Sanyam Choudhary Chemistry practical.pdf
Sanyam Choudhary Chemistry practical.pdfSanyam Choudhary Chemistry practical.pdf
Sanyam Choudhary Chemistry practical.pdfsanyamsingh5019
 
Kisan Call Centre - To harness potential of ICT in Agriculture by answer farm...
Kisan Call Centre - To harness potential of ICT in Agriculture by answer farm...Kisan Call Centre - To harness potential of ICT in Agriculture by answer farm...
Kisan Call Centre - To harness potential of ICT in Agriculture by answer farm...Krashi Coaching
 
How to Make a Pirate ship Primary Education.pptx
How to Make a Pirate ship Primary Education.pptxHow to Make a Pirate ship Primary Education.pptx
How to Make a Pirate ship Primary Education.pptxmanuelaromero2013
 
Grant Readiness 101 TechSoup and Remy Consulting
Grant Readiness 101 TechSoup and Remy ConsultingGrant Readiness 101 TechSoup and Remy Consulting
Grant Readiness 101 TechSoup and Remy ConsultingTechSoup
 
The basics of sentences session 2pptx copy.pptx
The basics of sentences session 2pptx copy.pptxThe basics of sentences session 2pptx copy.pptx
The basics of sentences session 2pptx copy.pptxheathfieldcps1
 
Q4-W6-Restating Informational Text Grade 3
Q4-W6-Restating Informational Text Grade 3Q4-W6-Restating Informational Text Grade 3
Q4-W6-Restating Informational Text Grade 3JemimahLaneBuaron
 
microwave assisted reaction. General introduction
microwave assisted reaction. General introductionmicrowave assisted reaction. General introduction
microwave assisted reaction. General introductionMaksud Ahmed
 
Activity 01 - Artificial Culture (1).pdf
Activity 01 - Artificial Culture (1).pdfActivity 01 - Artificial Culture (1).pdf
Activity 01 - Artificial Culture (1).pdfciinovamais
 
Z Score,T Score, Percential Rank and Box Plot Graph
Z Score,T Score, Percential Rank and Box Plot GraphZ Score,T Score, Percential Rank and Box Plot Graph
Z Score,T Score, Percential Rank and Box Plot GraphThiyagu K
 
Industrial Policy - 1948, 1956, 1973, 1977, 1980, 1991
Industrial Policy - 1948, 1956, 1973, 1977, 1980, 1991Industrial Policy - 1948, 1956, 1973, 1977, 1980, 1991
Industrial Policy - 1948, 1956, 1973, 1977, 1980, 1991RKavithamani
 
BASLIQ CURRENT LOOKBOOK LOOKBOOK(1) (1).pdf
BASLIQ CURRENT LOOKBOOK  LOOKBOOK(1) (1).pdfBASLIQ CURRENT LOOKBOOK  LOOKBOOK(1) (1).pdf
BASLIQ CURRENT LOOKBOOK LOOKBOOK(1) (1).pdfSoniaTolstoy
 
1029 - Danh muc Sach Giao Khoa 10 . pdf
1029 -  Danh muc Sach Giao Khoa 10 . pdf1029 -  Danh muc Sach Giao Khoa 10 . pdf
1029 - Danh muc Sach Giao Khoa 10 . pdfQucHHunhnh
 
Hybridoma Technology ( Production , Purification , and Application )
Hybridoma Technology  ( Production , Purification , and Application  ) Hybridoma Technology  ( Production , Purification , and Application  )
Hybridoma Technology ( Production , Purification , and Application ) Sakshi Ghasle
 
Student login on Anyboli platform.helpin
Student login on Anyboli platform.helpinStudent login on Anyboli platform.helpin
Student login on Anyboli platform.helpinRaunakKeshri1
 
Web & Social Media Analytics Previous Year Question Paper.pdf
Web & Social Media Analytics Previous Year Question Paper.pdfWeb & Social Media Analytics Previous Year Question Paper.pdf
Web & Social Media Analytics Previous Year Question Paper.pdfJayanti Pande
 
Measures of Central Tendency: Mean, Median and Mode
Measures of Central Tendency: Mean, Median and ModeMeasures of Central Tendency: Mean, Median and Mode
Measures of Central Tendency: Mean, Median and ModeThiyagu K
 
A Critique of the Proposed National Education Policy Reform
A Critique of the Proposed National Education Policy ReformA Critique of the Proposed National Education Policy Reform
A Critique of the Proposed National Education Policy ReformChameera Dedduwage
 
Privatization and Disinvestment - Meaning, Objectives, Advantages and Disadva...
Privatization and Disinvestment - Meaning, Objectives, Advantages and Disadva...Privatization and Disinvestment - Meaning, Objectives, Advantages and Disadva...
Privatization and Disinvestment - Meaning, Objectives, Advantages and Disadva...RKavithamani
 

Dernier (20)

Accessible design: Minimum effort, maximum impact
Accessible design: Minimum effort, maximum impactAccessible design: Minimum effort, maximum impact
Accessible design: Minimum effort, maximum impact
 
Sanyam Choudhary Chemistry practical.pdf
Sanyam Choudhary Chemistry practical.pdfSanyam Choudhary Chemistry practical.pdf
Sanyam Choudhary Chemistry practical.pdf
 
Kisan Call Centre - To harness potential of ICT in Agriculture by answer farm...
Kisan Call Centre - To harness potential of ICT in Agriculture by answer farm...Kisan Call Centre - To harness potential of ICT in Agriculture by answer farm...
Kisan Call Centre - To harness potential of ICT in Agriculture by answer farm...
 
How to Make a Pirate ship Primary Education.pptx
How to Make a Pirate ship Primary Education.pptxHow to Make a Pirate ship Primary Education.pptx
How to Make a Pirate ship Primary Education.pptx
 
Grant Readiness 101 TechSoup and Remy Consulting
Grant Readiness 101 TechSoup and Remy ConsultingGrant Readiness 101 TechSoup and Remy Consulting
Grant Readiness 101 TechSoup and Remy Consulting
 
The basics of sentences session 2pptx copy.pptx
The basics of sentences session 2pptx copy.pptxThe basics of sentences session 2pptx copy.pptx
The basics of sentences session 2pptx copy.pptx
 
Q4-W6-Restating Informational Text Grade 3
Q4-W6-Restating Informational Text Grade 3Q4-W6-Restating Informational Text Grade 3
Q4-W6-Restating Informational Text Grade 3
 
microwave assisted reaction. General introduction
microwave assisted reaction. General introductionmicrowave assisted reaction. General introduction
microwave assisted reaction. General introduction
 
Activity 01 - Artificial Culture (1).pdf
Activity 01 - Artificial Culture (1).pdfActivity 01 - Artificial Culture (1).pdf
Activity 01 - Artificial Culture (1).pdf
 
Z Score,T Score, Percential Rank and Box Plot Graph
Z Score,T Score, Percential Rank and Box Plot GraphZ Score,T Score, Percential Rank and Box Plot Graph
Z Score,T Score, Percential Rank and Box Plot Graph
 
Industrial Policy - 1948, 1956, 1973, 1977, 1980, 1991
Industrial Policy - 1948, 1956, 1973, 1977, 1980, 1991Industrial Policy - 1948, 1956, 1973, 1977, 1980, 1991
Industrial Policy - 1948, 1956, 1973, 1977, 1980, 1991
 
BASLIQ CURRENT LOOKBOOK LOOKBOOK(1) (1).pdf
BASLIQ CURRENT LOOKBOOK  LOOKBOOK(1) (1).pdfBASLIQ CURRENT LOOKBOOK  LOOKBOOK(1) (1).pdf
BASLIQ CURRENT LOOKBOOK LOOKBOOK(1) (1).pdf
 
1029 - Danh muc Sach Giao Khoa 10 . pdf
1029 -  Danh muc Sach Giao Khoa 10 . pdf1029 -  Danh muc Sach Giao Khoa 10 . pdf
1029 - Danh muc Sach Giao Khoa 10 . pdf
 
Hybridoma Technology ( Production , Purification , and Application )
Hybridoma Technology  ( Production , Purification , and Application  ) Hybridoma Technology  ( Production , Purification , and Application  )
Hybridoma Technology ( Production , Purification , and Application )
 
Student login on Anyboli platform.helpin
Student login on Anyboli platform.helpinStudent login on Anyboli platform.helpin
Student login on Anyboli platform.helpin
 
Staff of Color (SOC) Retention Efforts DDSD
Staff of Color (SOC) Retention Efforts DDSDStaff of Color (SOC) Retention Efforts DDSD
Staff of Color (SOC) Retention Efforts DDSD
 
Web & Social Media Analytics Previous Year Question Paper.pdf
Web & Social Media Analytics Previous Year Question Paper.pdfWeb & Social Media Analytics Previous Year Question Paper.pdf
Web & Social Media Analytics Previous Year Question Paper.pdf
 
Measures of Central Tendency: Mean, Median and Mode
Measures of Central Tendency: Mean, Median and ModeMeasures of Central Tendency: Mean, Median and Mode
Measures of Central Tendency: Mean, Median and Mode
 
A Critique of the Proposed National Education Policy Reform
A Critique of the Proposed National Education Policy ReformA Critique of the Proposed National Education Policy Reform
A Critique of the Proposed National Education Policy Reform
 
Privatization and Disinvestment - Meaning, Objectives, Advantages and Disadva...
Privatization and Disinvestment - Meaning, Objectives, Advantages and Disadva...Privatization and Disinvestment - Meaning, Objectives, Advantages and Disadva...
Privatization and Disinvestment - Meaning, Objectives, Advantages and Disadva...
 

Unit 3 lesson 2 food pyramids

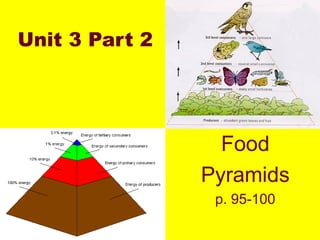
  • 1. Unit 3 Part 2 Food Pyramids p. 95-100
  • 2. Define Food Pyramid • Diagram showing each trophic level as a horizontal LESS bar. • Producers are located on bottom • Higher consumers are placed on top of each other. MORE • Each bar is drawn in proportion to the mass of organisms • More mass at the lower levels, less at the top… hence the triangular shape!
  • 3. Why are there fewer organisms at each trophic level? P. 97 If humans became primary consumers only, then more of the human population could be supported. • As you go up the food chain, less energy is available at each higher level. • (1/10th of lower level). Remember 90% is used up! • Organisms higher up have to eat MORE food from lower levels to survive. • Therefore, fewer organisms can obtain energy to live = fewer organisms are at each higher level.
  • 4. Higher means Less! The higher up you go, there is less: a. Mass of organisms – food pyramid b. Number of organisms – pyramid of numbers c. Amount of energy – energy pyramid
  • 5. Why is this pyramid upside down? Biological Amplification
  • 6. Why is this pyramid upside down? Biological Amplification • Biological Amplification is the tendency of pollutants/toxins to become more concentrated in higher trophic levels. • Often, this is to the detriment of the higher order organisms in which these materials concentrate, since the pollutants are often toxic. • Also referred to as Biological magnification
  • 7. Biological Amplification – simplified! • FACT! - Some toxins (DDT & mercury) are stored in fat and are NOT water soluble or excreted. • Plants/organisms at lower levels take in toxins. • Animals higher up eat MANY of these lower organisms to obtain enough energy. • Taking in MORE toxins as well = build up of toxins is much higher in these higher up consumers.
  • 8. Consumer- eats 3 fox Coyote = 300 units of toxins built up Consumer- eats 5 Fox = 100 units of toxins rabbits built up Consumer- eats 20 Rabbit = 20 units of toxins shrubs built up Producer Shrub = 1 unit of toxin
  • 9. How do food pyramids help explain DDT amplification? P. 97 (Handout!!) • DDT was a particularly dangerous toxin because it is fat soluble and stays in an animal's fat. (Some poisons are water soluble and can be excreted from the system.) • Lower order organisms ingest some poison which is store in their fat. • Higher order organisms eat large numbers of lower order organisms. (Ex. A small amount in a frog becomes large in a hawk that eats 100 frogs.
  • 10. Introduction of new species? • What could be the probable impact that: • the recent arrival of coyotes on the island of Newfoundland may have on the local ecosystem? • the introduction of snowshoe hare or even the moose to the island of Newfoundland? • the introduction of chinch bugs when it arrived through sods imported from mainland Canada?
  • 11. Possible Effects ??? • Elimination/disruption of their food sources/species. • Competition for food sources may cause decline or endanger other native species that eat same food source. • Diseases or DANGER may be introduced causing decline or disruption. • May cause interruption or decline in economic activity related to lost/declining species. (ex. Moose & Caribou) • Financial cost to subsequently control new species. • May cause the CREATION OF NEW BUSINESSES… to control the species, tourism etc.. • The new plant/animal could be a FOOD SOURCE for the local ecosystem.