Polkadot JAM Slides - Token2049 - By Dr. Gavin Wood
Independent research
1. Ryohei Kimura
P 2 IB Physics HL 1
May 18th 2011
Independent Research: Straw tube and Wavelength
In this lab, a straw is blown to create sound and cut to make different sound. In
straw tube, standing waves are formed. As a blown straw gets shorter, the frequency of
sound increases. Moreover, as frequency increases, the wavelength of standing wave
decreases. Thus, the relationship between length of a straw blown and wavelength of the
sound wave is investigated in this experiment.
Since it is very hard to physically measure the wavelength of standing waves, a
formula is used in order to measure the wavelength of standing waves in the straw tube,
λ= (Eq. 1)
where λ is wavelength of the standing wave, v is velocity of sound, and f is frequency of
the standing waves.
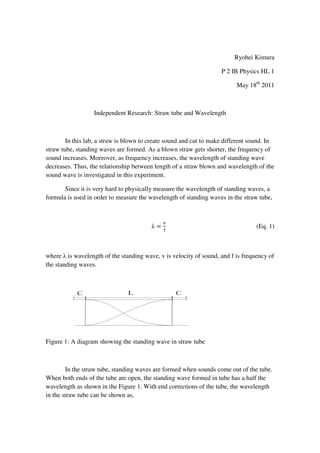
Figure 1: A diagram showing the standing wave in straw tube
In the straw tube, standing waves are formed when sounds come out of the tube.
When both ends of the tube are open, the standing wave formed in tube has a half the
wavelength as shown in the Figure 1. With end corrections of the tube, the wavelength
in the straw tube can be shown as,
2. λ = L + 2C (Eq. 2)
or,
λ = 2L + 4C (Eq. 3)
where λ is wavelength of the standing wave, L is the length of straw tube, and C is
the end correction of both end of the straw tube.
From those equations, the relationship of the length of straw tube and
wavelength is predicted to be linear. Moreover, from Equation 3, it can also be
predicted that the y intercept of graph of length of straw vs. wavelength of sound wave
will be 4 times as much as the end correction of straw tube.
Design
Research Question
- What is the relationship between length of a straw blown and wavelength of the
sound wave at constant temperature?
Independent Variable
- Length of straw
Dependent variable
- Wavelength of the sound wave
Controlled factors
- Constant temperature of room
- Same straw
- Diameter of straw tube
- Same microphone
3. Method
Figure 2: The Experimental Set-up
First, the equipments are set up as shown in the diagram above. The sample rate
of frequency probe is set at 10000 per one second, and time length is set at 0.5 second.
A trumpet mouth piece is used to stabilize the sound while collecting the data. Next, the
straw is blown and the frequency of sound is collected. After collecting data for 3 times,
one end of straw tube is cut and the frequency was measured while blowing. Seven
different frequencies are measured for 3 times each.
The control factors in this lab are velocity of sound wave. The velocity was kept
by keeping the room temperature constant since velocity is totally dependent on the
temperature. The room temperature was kept by turning on the air conditioner all the
time.
The independent variable in this experiment is the length of straw tube. It was
changed by cutting the end of straw tube by a scissor. The length of straw tube was
measured by a 30cm-ruler. The range of the variable was 10.5 cm to 25.5cm and three
trials were held for each value.
4. Data Collection and Proceeding
Constants
- T = 26.0(±0.1℃)
- V of sound in 26.0℃= 347 (±0.06 m/s)
- Diameter of straw = 5(±1mm)
Figure 3:Calculated speed of sound in 26℃ from Sengpielaudio.com.
Sample Graph
Figure 4: This sample graph shows the relationship between time and Sound Pressure at
12.5cm straw tube.
5. Figure 5: The graph of Fast Fourier Transform (FFT) which shows the peak frequency.
Table 1: Average Frequency for each Straw tube
Length of straw Frequency (±0.01Hz) Average
(±0.001m) Trial 1 Trial 2 Trial 3 Frequency
(±4Hz)
0.125 300.60 305.18 300.60 301
0.145 292.97 297.55 292.97 295
0.165 283.81 280.76 280.76 282
0.185 267.03 273.13 274.66 272
0.205 262.45 257.87 256.35 259
0.225 241.09 242.61 242.61 242
0.245 219.73 222.78 218.20 220
Caption: The uncertainty of average frequency is half the range of three trials
Table 2: Average Frequency and Calculated Wavelength
Average Frequency Calculated Wavelength
(±4Hz) (±0.03m)
220 1.58
242 1.43
259 1.34
272 1.28
282 1.23
295 1.18
301 1.15
6. Figure 6: The relationship between length of straw and wavelength of standing wave in
straw tube.
Figure 7: The graph shows the relationship between Length of straw tube to the 4th and
calculated wavelength with best linear fit.
7. Figure 8: The graph shows the relationship between Length of straw tube to the 4th and
calculated wavelength with possible highest and lowest fit.
Sample Calculation
-Uncertainty of wavelength
λ=v/f
Actual Wavelength … 347(m/s)/220(Hz) = 1.58 m
Highest … 347.1(m/s)/216.9(Hz) = 1.61m
Lowest … 346.9(m/s)/224(Hz) = 1.55
(1.61m – 1.55m)/2 = 0.03m
∴ uncertainty = ±0.03m
-Uncertainty of Slope
Actual … 122.75
Highest … 140
Lowest …110
(140-110)/2 = 15 ∴ uncertainty = ±15
8. Conclusion
Unexpectedly, the relationship between the length of straw tube and wavelength
of standing wave is,
λ = 123 ± 15L m + 1.13 ± 0.03m (Eq.4)
where λ is wavelength of standing waves in straw tube and L is the length of straw.
Level of confidence of the result is low. Even though the quality of fit is very
high, the result is not close to the prediction at all. However, the fact that the
relationship is linear is supported. Thus, the fact that the slope of the equation is linear
is applicable of every experiment but slope will not be same as this data.
There are some weaknesses in this experiment. First, the microphone might
catch sounds which were not the sound from straw tube and this might affect the result.
In order to overcome this problem, data would be collected in quiet space so that there
would be less chance of microphone catching outer sounds. Data of longer straw tubes
would be collected to increase the range of data so that the results would be more
accurate. Moreover, the sound pitch might differ as straw tube was blown. To improve
this weakness, the person who blow the straw would practice more on blowing hence
the frequency of sound would not likely change.